| Param | Original file | Final file |
|---|---|---|
| Filename | modeM0/AS1C09_011T05_9000006466_51906cztM0_level2.fits | modeM0/AS1C09_011T05_9000006466_51906cztM0_level2_quad_clean.evt |
| Size (bytes) | 703,656,000 | 102,640,320 |
| Size | 671.1 MB | 97.9 MB |
| Events in quadrant A | 7,908,937 | 632,535 |
| Events in quadrant B | 5,092,508 | 752,422 |
| Events in quadrant C | 4,954,424 | 662,695 |
| Events in quadrant D | 7,496,820 | 525,921 |
| Mode SS | |||
|---|---|---|---|
| Quadrant | BADHDUFLAG | Total packets | Discarded packets |
| A | 0 | 154 | 0 |
| B | 0 | 154 | 0 |
| C | 0 | 154 | 0 |
| D | 0 | 154 | 0 |
| Mode M0 | |||
|---|---|---|---|
| Quadrant | BADHDUFLAG | Total packets | Discarded packets |
| A | 0 | 28826 | 0 |
| B | 0 | 20406 | 0 |
| C | 0 | 20262 | 0 |
| D | 0 | 27699 | 4 |
| Quadrant | Total seconds | Saturated seconds | Saturation percentage |
|---|---|---|---|
| A | 7675 | 931 | 12.130293% |
| B | 7675 | 229 | 2.983713% |
| C | 7675 | 332 | 4.325733% |
| D | 7675 | 1420 | 18.501629% |
Noise dominated data is calculated using 1-second bins in cleaned event files. If a bin has >2000 counts, and if more than 50% of those come from <1% of pixels, then it is considered to be noise-dominated and hence unusable.
| Quadrant | # 1 sec bins | Bins with >0 counts | Bins with >2000 counts | High rate bins dominated by noise | Noise dominated (total time) | Noise dominated (detector-on time) | Marked lightcurve |
|---|---|---|---|---|---|---|---|
| A | 7675 | 7675 | 720 | 720 | 9.38% | 9.38% | 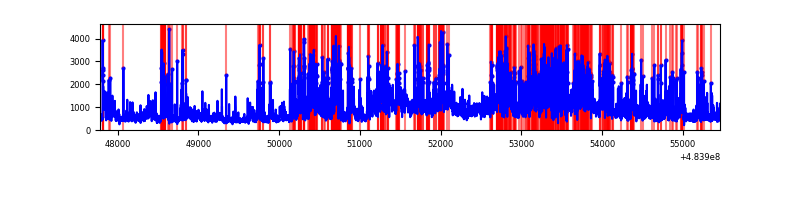 |
| B | 7675 | 7675 | 152 | 152 | 1.98% | 1.98% | 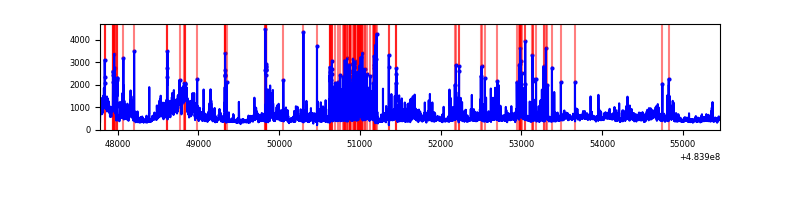 |
| C | 7675 | 7675 | 215 | 215 | 2.80% | 2.80% | 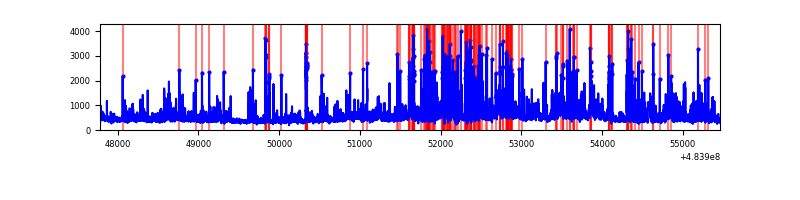 |
| D | 7675 | 7675 | 1338 | 1338 | 17.43% | 17.43% | 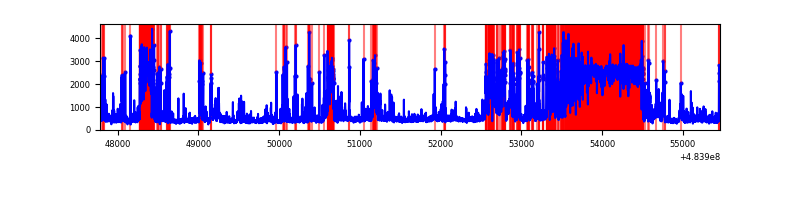 |
Top three noisy pixels from each quadrant. If the there are fewer than three noisy pixels in the level2.evt file, extra rows are filled as -1
| Pixel properties | Quadrant properties | ||||||
|---|---|---|---|---|---|---|---|
| Quadrant | DetID | PixID | Counts | Sigma | Mean | Median | Sigma |
| A | 7 | 64 | 2115710 | 11636.84 | 742 | 726 | 181.7 |
| A | 4 | 175 | 762618 | 4192.0 | 742 | 726 | 181.7 |
| A | 11 | 3 | 630861 | 3467.06 | 742 | 726 | 181.7 |
| B | 10 | 254 | 791027 | 4758.72 | 779 | 751 | 166.1 |
| B | 5 | 172 | 520643 | 3130.58 | 779 | 751 | 166.1 |
| B | 12 | 32 | 180633 | 1083.18 | 779 | 751 | 166.1 |
| C | 13 | 3 | 483284 | 2350.87 | 746 | 742 | 205.3 |
| C | 15 | 178 | 399058 | 1940.54 | 746 | 742 | 205.3 |
| C | 15 | 224 | 223749 | 1086.46 | 746 | 742 | 205.3 |
| D | 6 | 42 | 2528601 | 13192.13 | 664 | 637 | 191.6 |
| D | 3 | 12 | 579521 | 3020.9 | 664 | 637 | 191.6 |
| D | 0 | 5 | 509560 | 2655.8 | 664 | 637 | 191.6 |
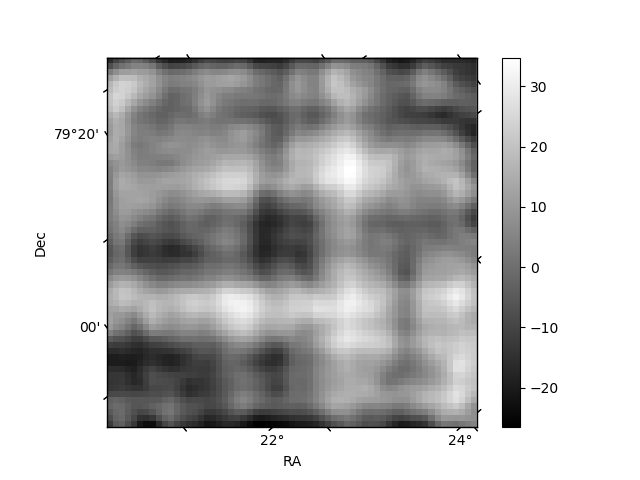
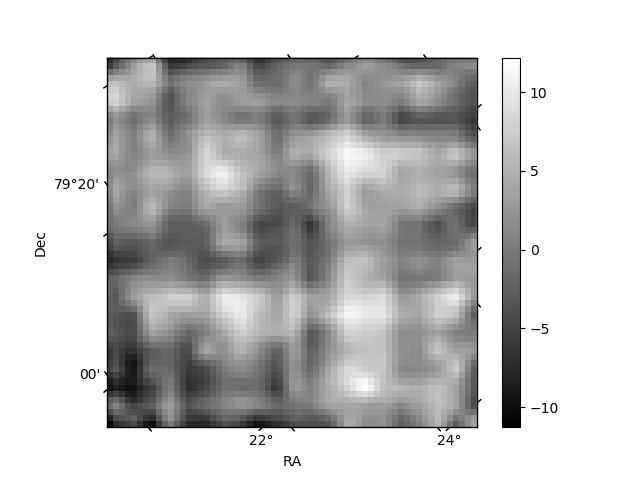
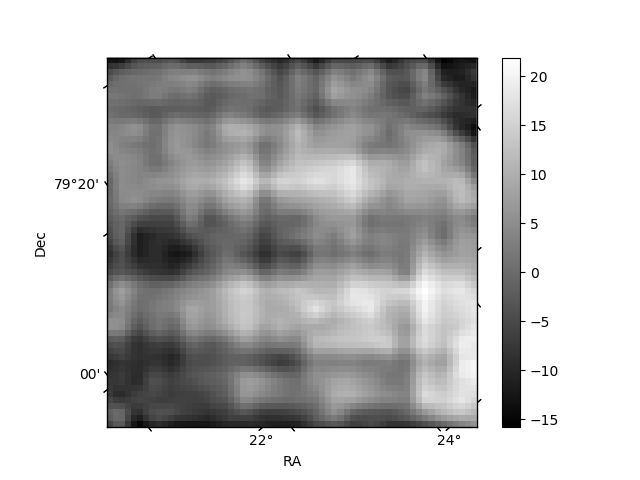
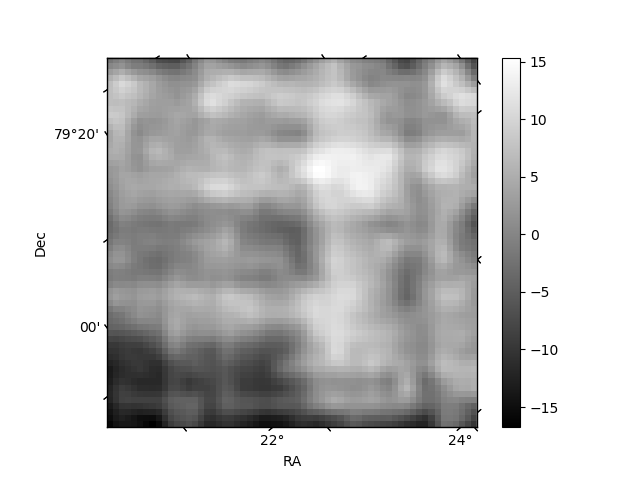
Histogram calculated using DETX and DETY for each event in the final _common_clean file
| Quadrant A | 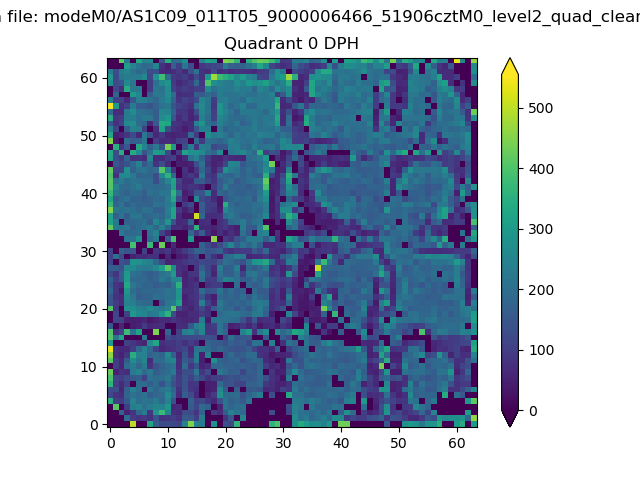 |
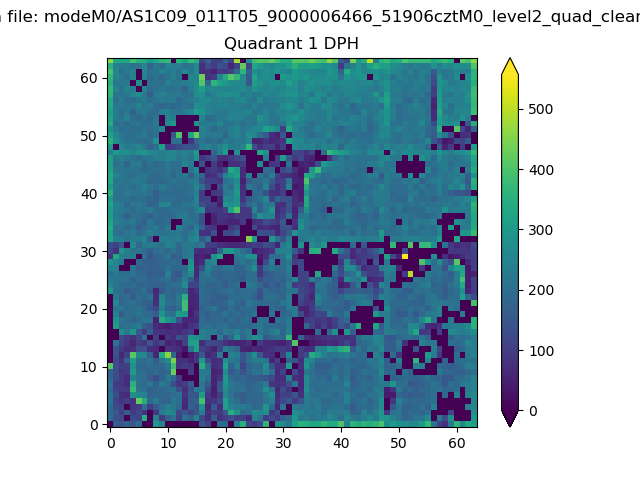 |
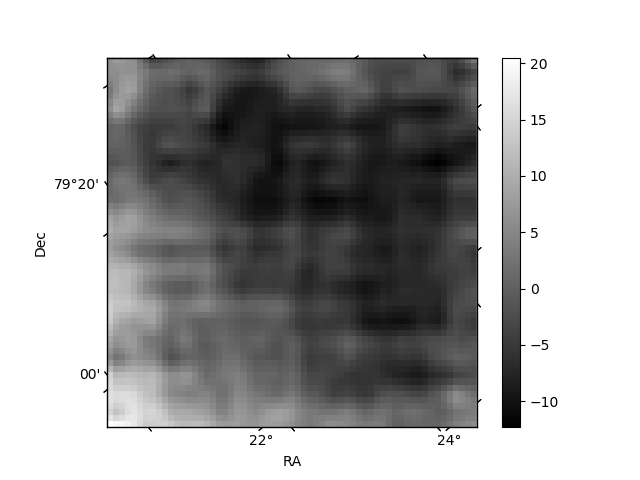
Quadrant B |
|---|---|---|---|
| Quadrant D | 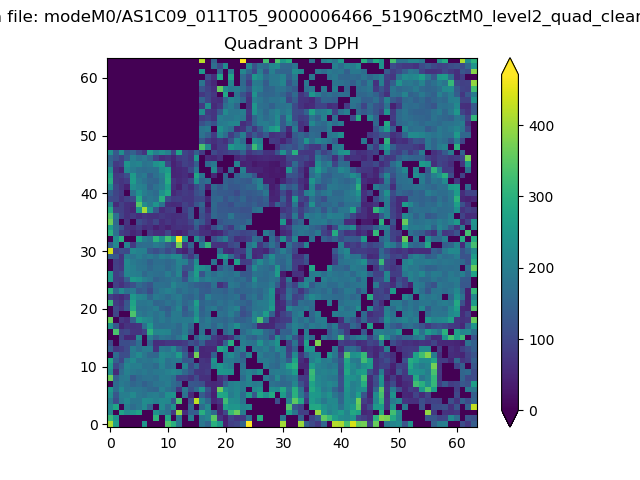 |
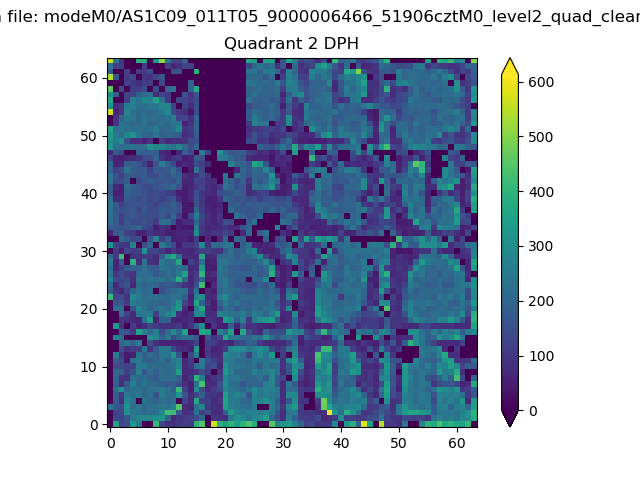 |
Quadrant C |
| Plot type | Count rate plots | Images |
|---|---|---|
| Comparison with Poisson distribution Blue bars denote a histogram of data divided into 1 sec bins. Red curve is a Poisson curve with rate = median count rate of data. |
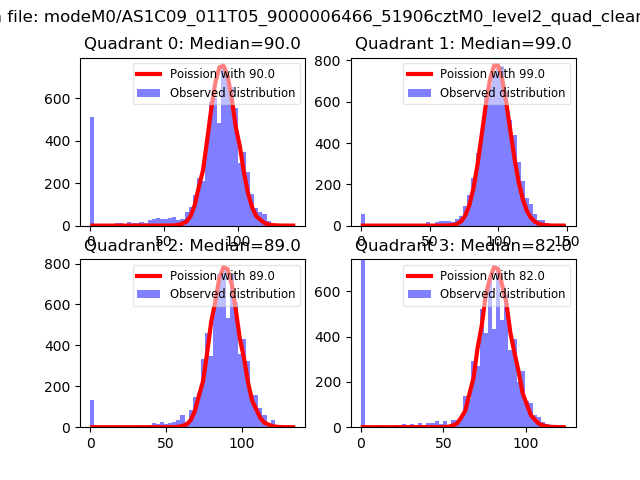 |
 |
| Quadrant-wise count rates Data is divided into 100 sec bins |
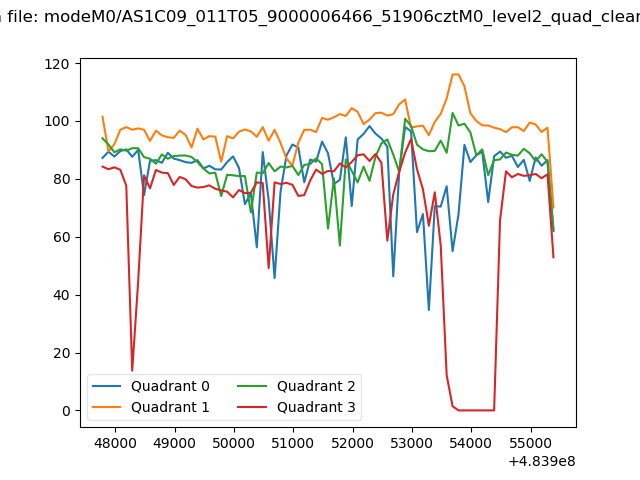 |
|
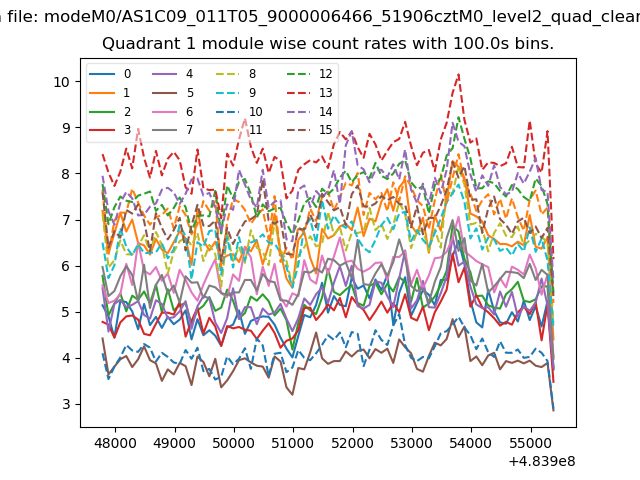
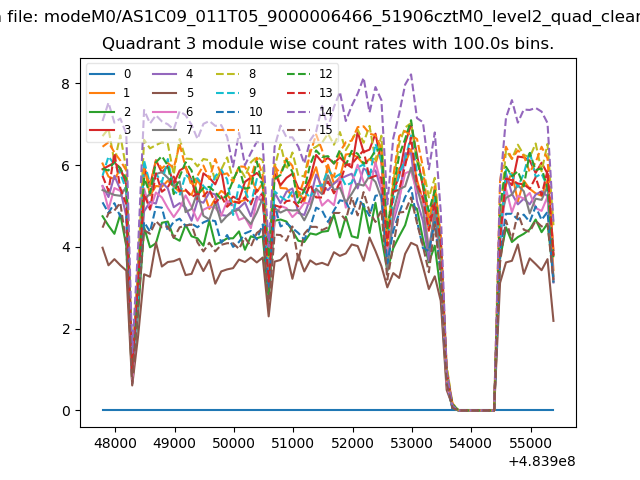
| Module-wise count rates for Quadrant A Data is divided into 100 sec bins |
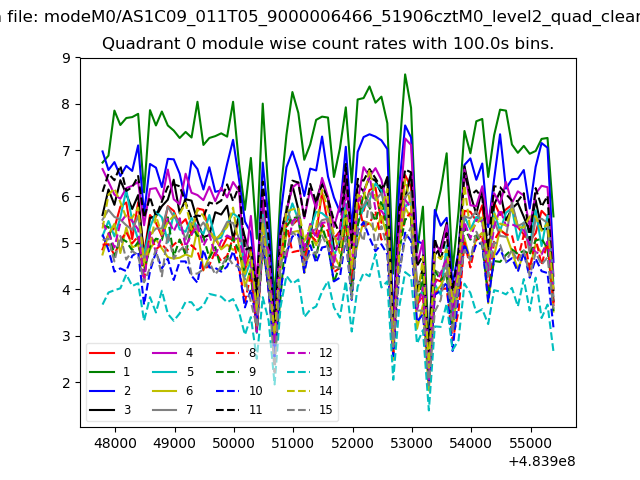 |
 |
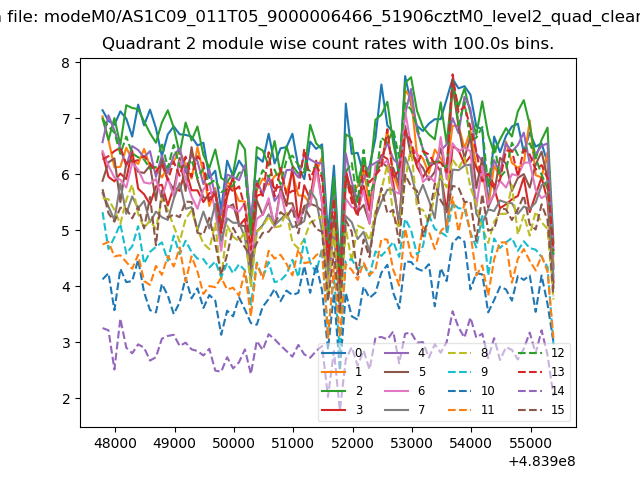
| Module-wise count rates for Quadrant B Data is divided into 100 sec bins |
 |
 |
| Module-wise count rates for Quadrant C Data is divided into 100 sec bins |
 |
 |
| Module-wise count rates for Quadrant D Data is divided into 100 sec bins |
 |
 |
| Parameter | Plot |
|---|---|
| CZT HV Monitor | 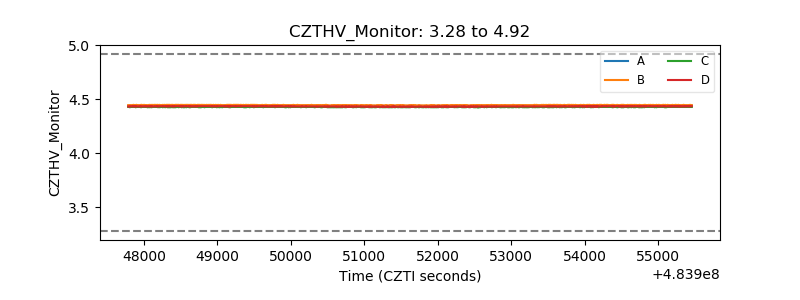 |
| D_VDD | 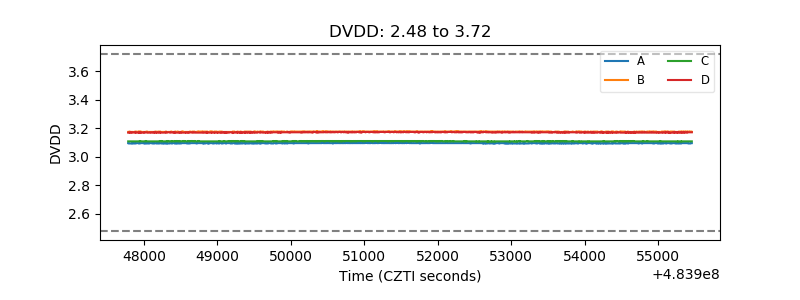 |
| Temperature 1 | 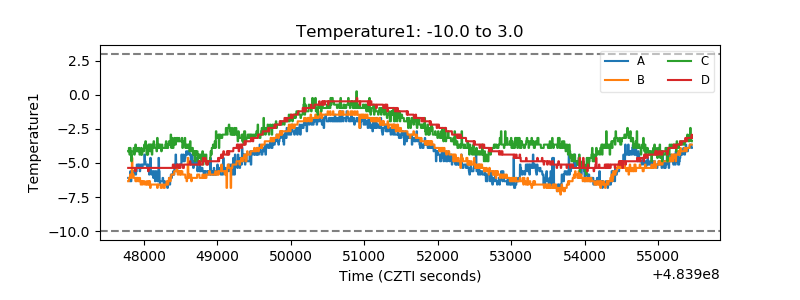 |
| Veto HV Monitor | 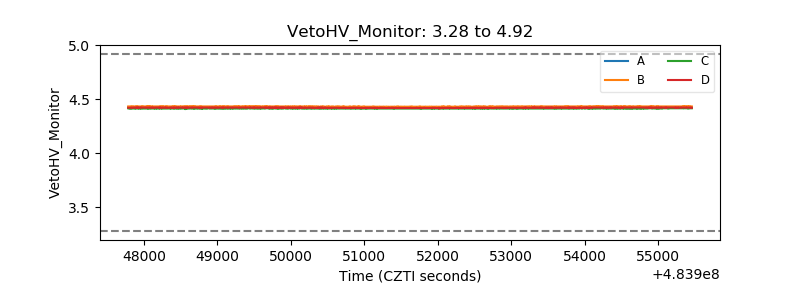 |
| Veto LLD | 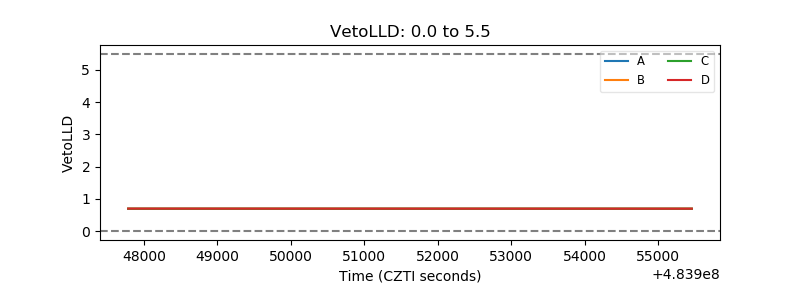 |
| Alpha Counter | 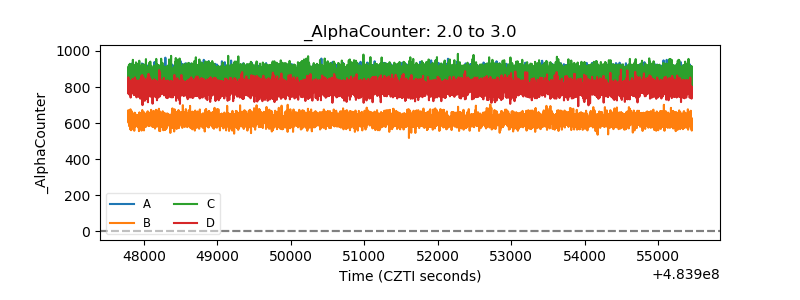 |
| _CPM_Rate | 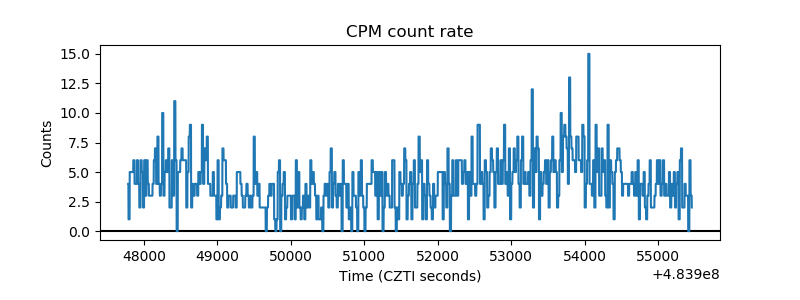 |
| CZT Counter | 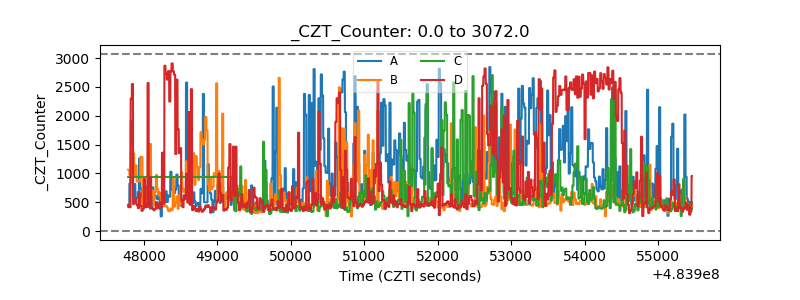 |
| +2.5 Volts monitor | 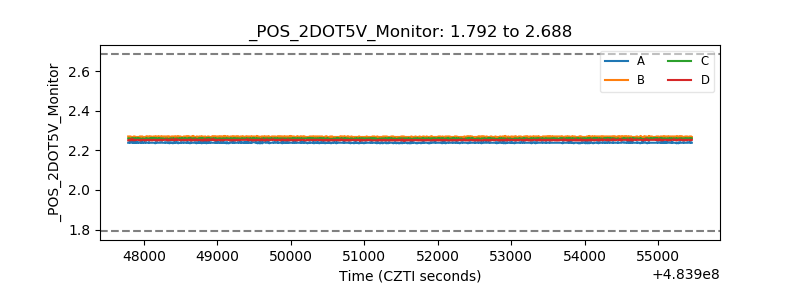 |
| +5 Volts monitor | 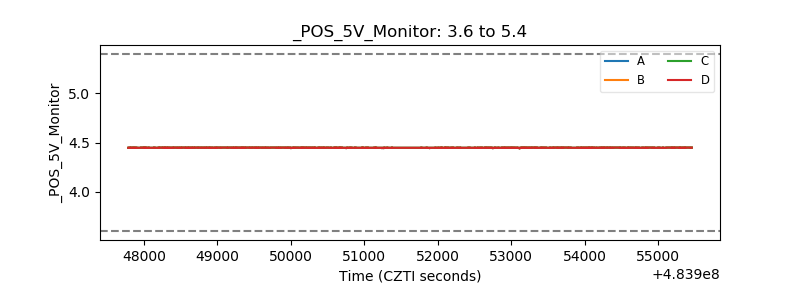 |
| _ROLL_ROT | 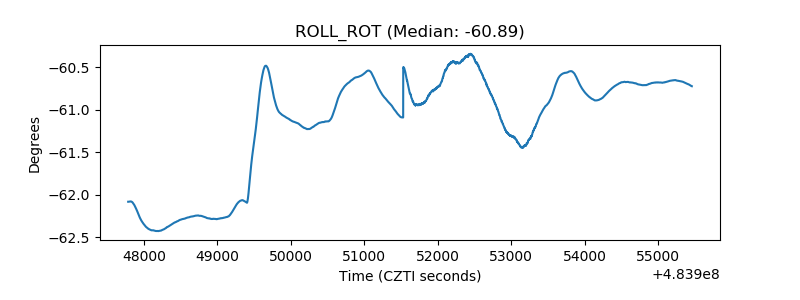 |
| _Roll_DEC | 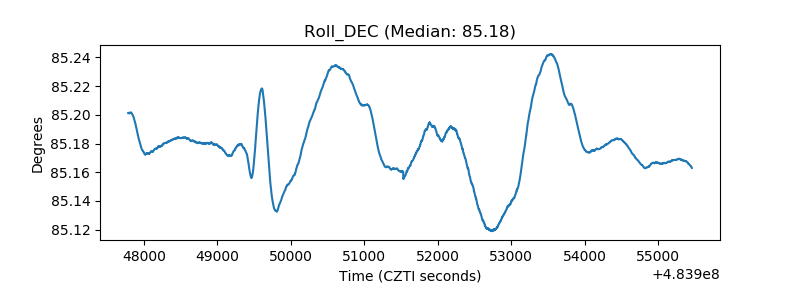 |
| _Roll_RA | 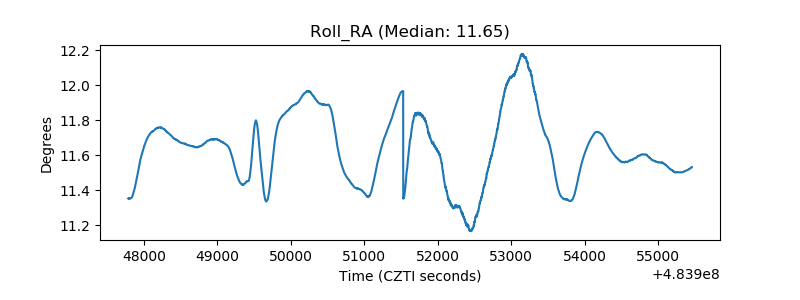 |
| Veto Counter | 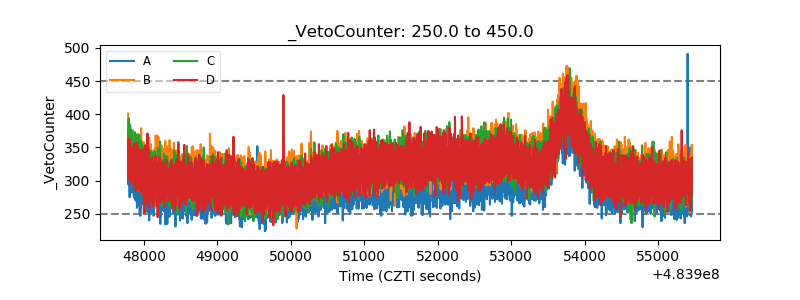 |