| Param | Original file | Final file |
|---|---|---|
| Filename | modeM0/AS1C09_011T05_9000006466_51907cztM0_level2.fits | modeM0/AS1C09_011T05_9000006466_51907cztM0_level2_quad_clean.evt |
| Size (bytes) | 42,266,880 | 2,589,120 |
| Size | 40.3 MB | 2.5 MB |
| Events in quadrant A | 612,280 | 386 |
| Events in quadrant B | 141,906 | 25,861 |
| Events in quadrant C | 136,762 | 21,150 |
| Events in quadrant D | 647,301 | 2,625 |
| Mode SS | |||
|---|---|---|---|
| Quadrant | BADHDUFLAG | Total packets | Discarded packets |
| A | 0 | 6 | 0 |
| B | 0 | 6 | 0 |
| C | 0 | 6 | 0 |
| D | 0 | 6 | 0 |
| Mode M0 | |||
|---|---|---|---|
| Quadrant | BADHDUFLAG | Total packets | Discarded packets |
| A | 0 | 2024 | 0 |
| B | 0 | 641 | 0 |
| C | 0 | 640 | 1 |
| D | 0 | 2122 | 0 |
| Quadrant | Total seconds | Saturated seconds | Saturation percentage |
|---|---|---|---|
| A | 291 | 270 | 92.783505% |
| B | 292 | 4 | 1.369863% |
| C | 291 | 3 | 1.030928% |
| D | 291 | 221 | 75.945017% |
Noise dominated data is calculated using 1-second bins in cleaned event files. If a bin has >2000 counts, and if more than 50% of those come from <1% of pixels, then it is considered to be noise-dominated and hence unusable.
| Quadrant | # 1 sec bins | Bins with >0 counts | Bins with >2000 counts | High rate bins dominated by noise | Noise dominated (total time) | Noise dominated (detector-on time) | Marked lightcurve |
|---|---|---|---|---|---|---|---|
| A | 290 | 290 | 172 | 172 | 59.31% | 59.31% | 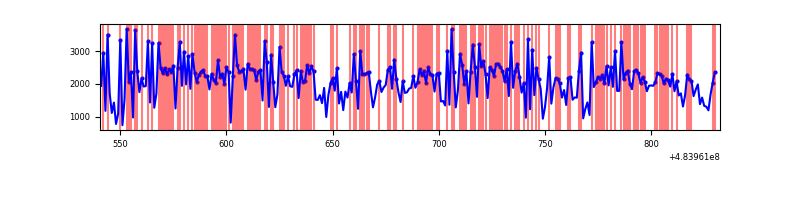 |
| B | 292 | 292 | 4 | 4 | 1.37% | 1.37% | 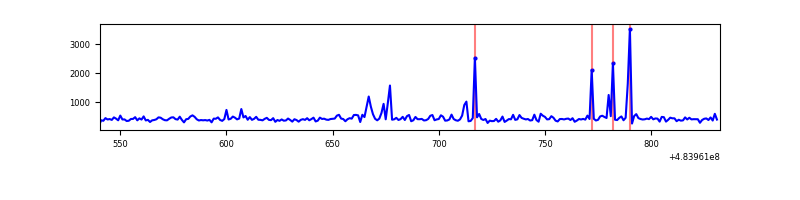 |
| C | 291 | 291 | 3 | 3 | 1.03% | 1.03% | 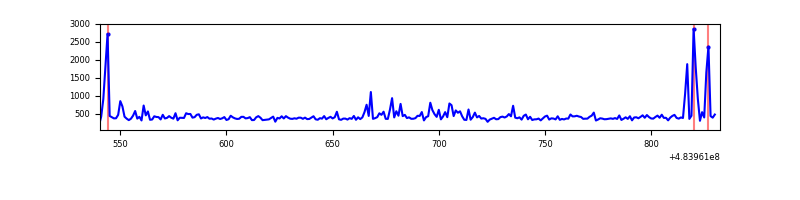 |
| D | 290 | 290 | 202 | 202 | 69.66% | 69.66% | 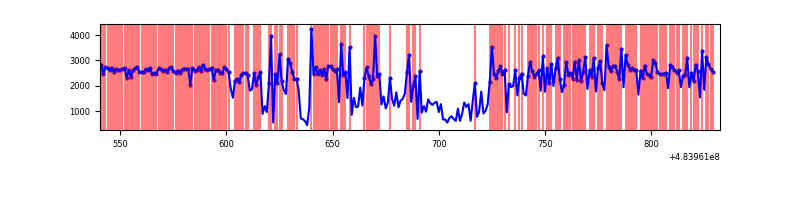 |
Top three noisy pixels from each quadrant. If the there are fewer than three noisy pixels in the level2.evt file, extra rows are filled as -1
| Pixel properties | Quadrant properties | ||||||
|---|---|---|---|---|---|---|---|
| Quadrant | DetID | PixID | Counts | Sigma | Mean | Median | Sigma |
| A | 3 | 95 | 502635 | 117062.75 | 11 | 10 | 4.3 |
| A | 12 | 80 | 34705 | 8080.56 | 11 | 10 | 4.3 |
| A | 12 | 3 | 13267 | 3087.59 | 11 | 10 | 4.3 |
| B | 0 | 153 | 14538 | 1796.61 | 28 | 27 | 8.1 |
| B | 12 | 32 | 6364 | 784.58 | 28 | 27 | 8.1 |
| B | 8 | 128 | 3633 | 446.46 | 28 | 27 | 8.1 |
| C | 15 | 224 | 12326 | 1384.38 | 27 | 26 | 8.9 |
| C | 13 | 3 | 10497 | 1178.53 | 27 | 26 | 8.9 |
| C | 15 | 219 | 4259 | 476.43 | 27 | 26 | 8.9 |
| D | 12 | 17 | 415800 | 66802.54 | 16 | 15 | 6.2 |
| D | 6 | 42 | 123542 | 19846.6 | 16 | 15 | 6.2 |
| D | 2 | 172 | 12224 | 1961.57 | 16 | 15 | 6.2 |
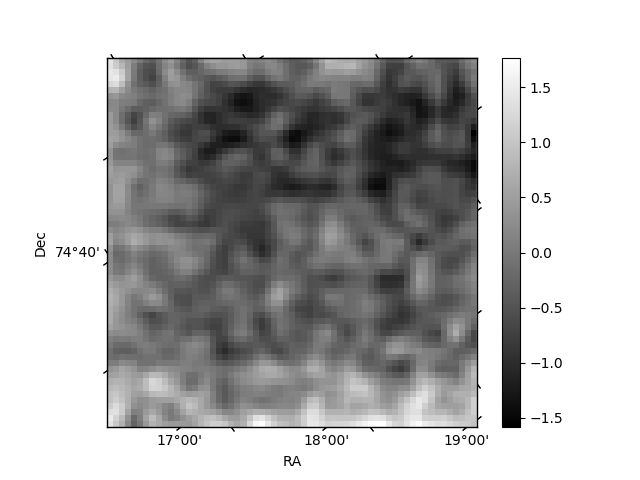
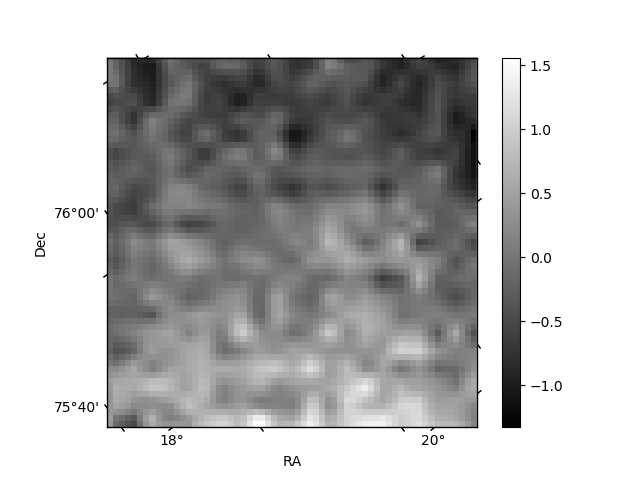
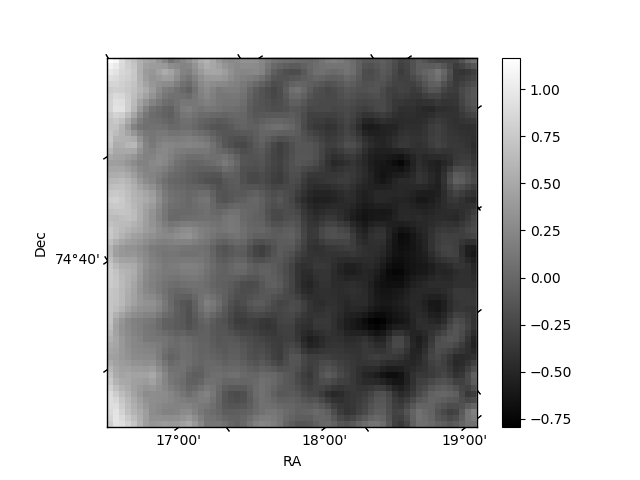
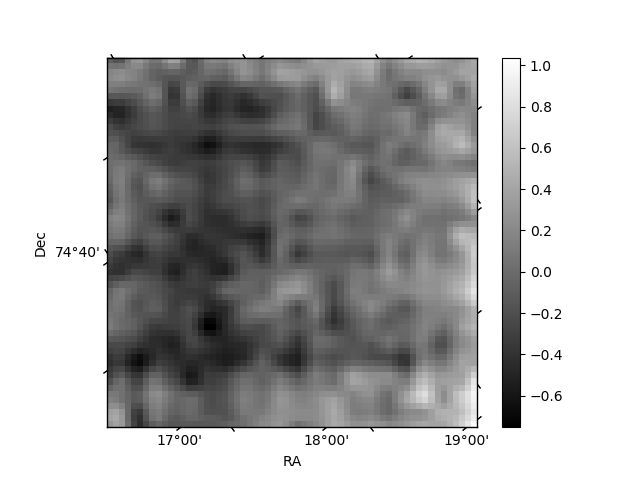
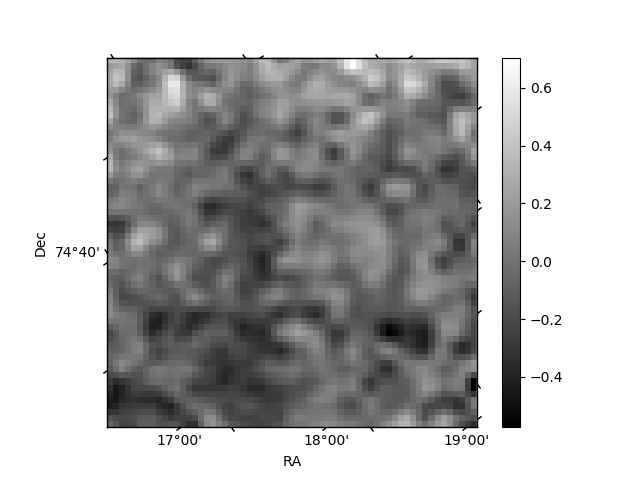
Histogram calculated using DETX and DETY for each event in the final _common_clean file
| Quadrant A | 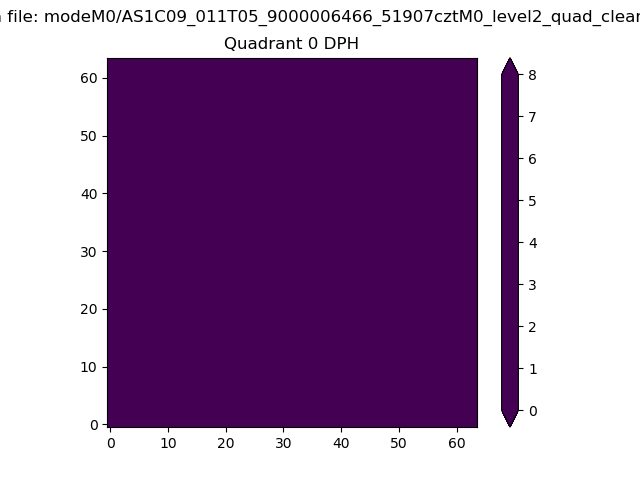 |
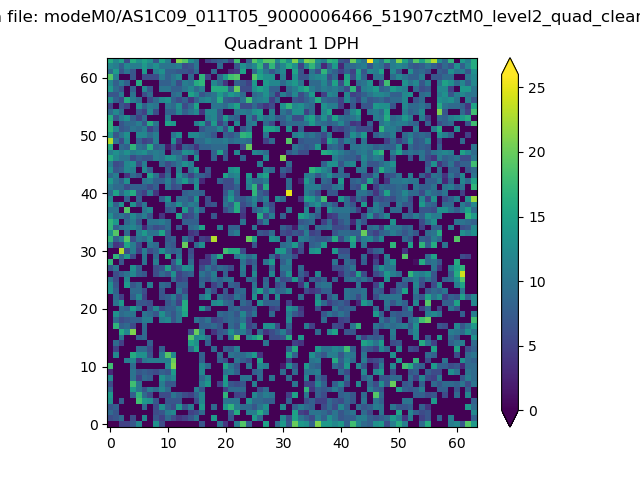 |
Quadrant B |
|---|---|---|---|
| Quadrant D | 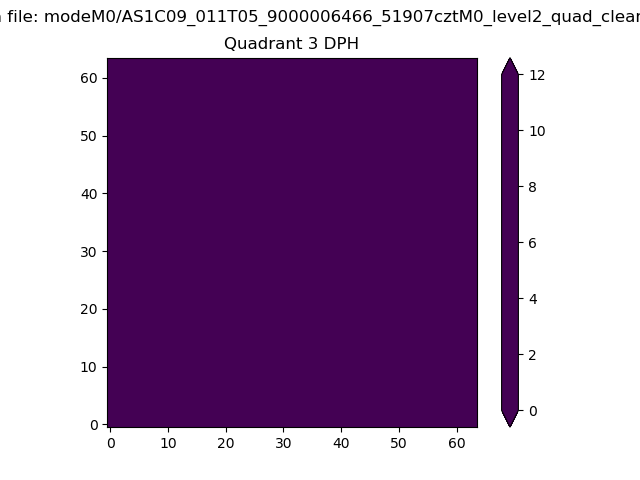 |
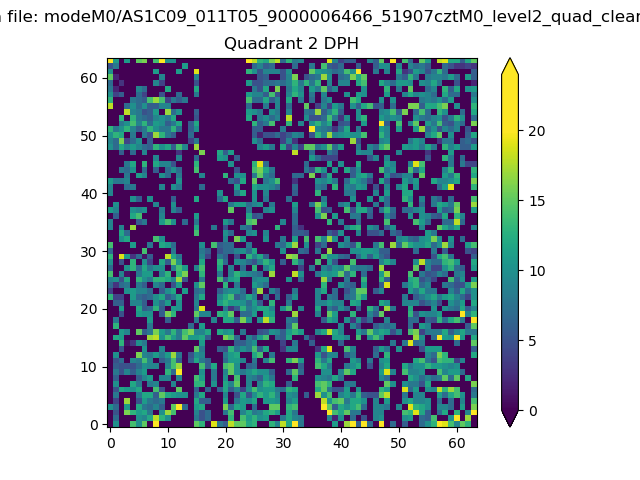 |
Quadrant C |
| Plot type | Count rate plots | Images |
|---|---|---|
| Comparison with Poisson distribution Blue bars denote a histogram of data divided into 1 sec bins. Red curve is a Poisson curve with rate = median count rate of data. |
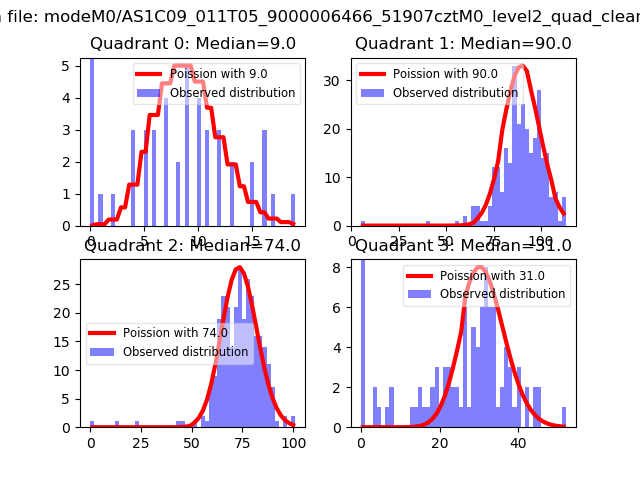 |
 |
| Quadrant-wise count rates Data is divided into 100 sec bins |
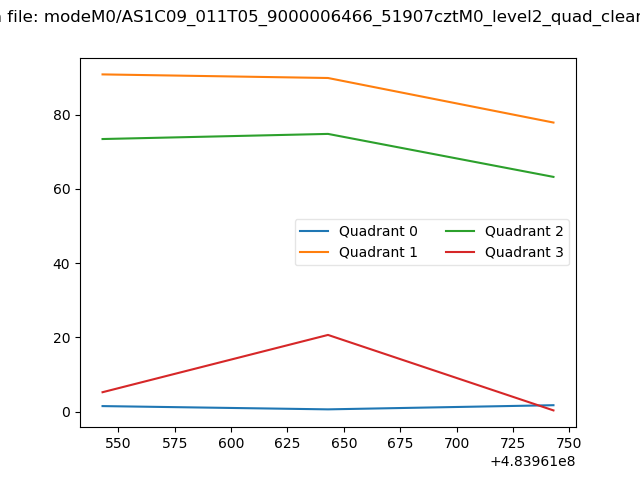 |
|
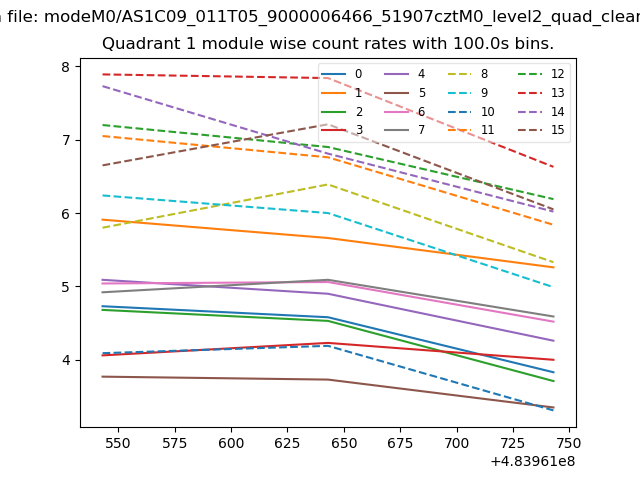
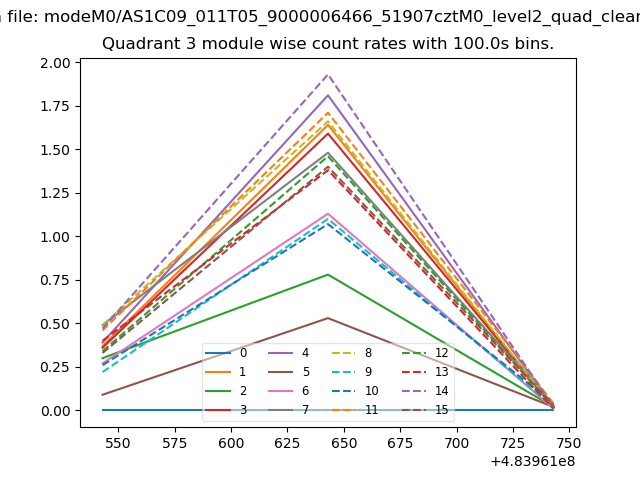
| Module-wise count rates for Quadrant A Data is divided into 100 sec bins |
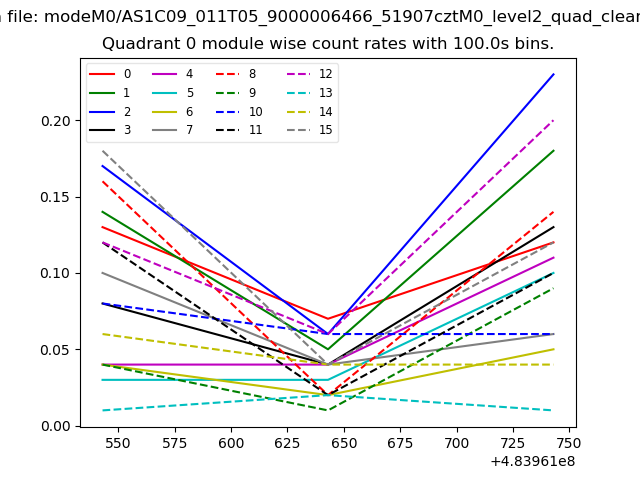 |
 |
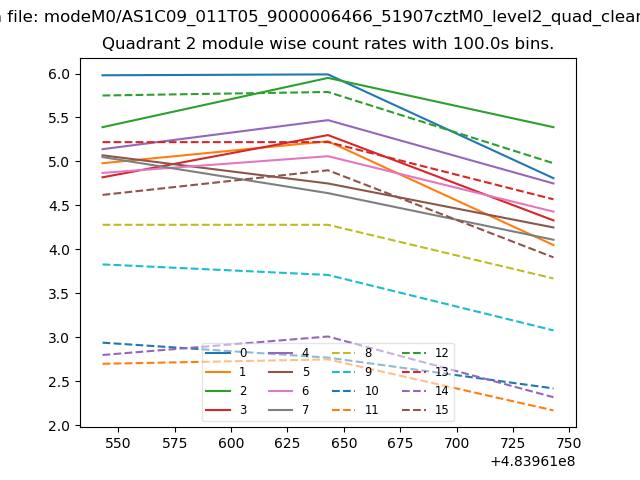
| Module-wise count rates for Quadrant B Data is divided into 100 sec bins |
 |
 |
| Module-wise count rates for Quadrant C Data is divided into 100 sec bins |
 |
 |
| Module-wise count rates for Quadrant D Data is divided into 100 sec bins |
 |
 |
| Parameter | Plot |
|---|---|
| CZT HV Monitor | 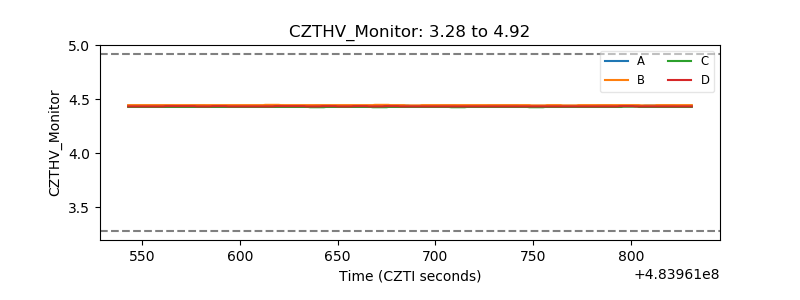 |
| D_VDD | 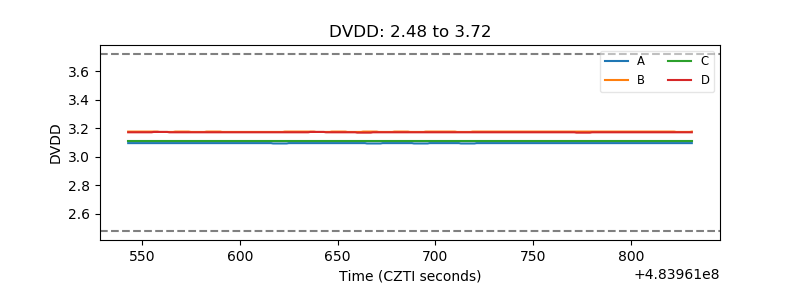 |
| Temperature 1 | 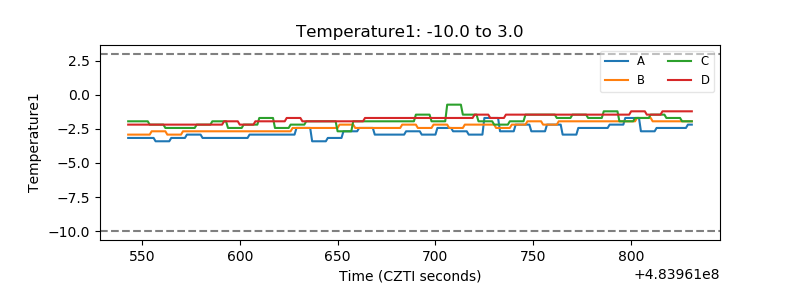 |
| Veto HV Monitor | 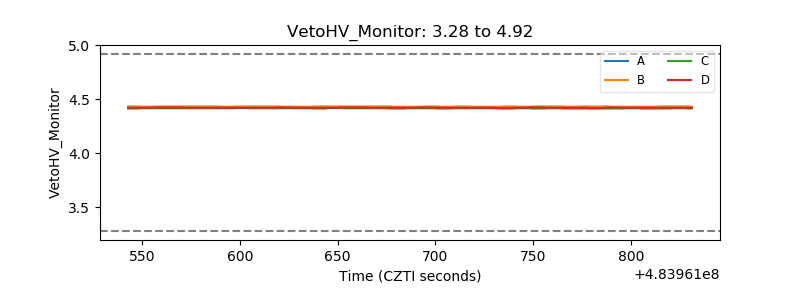 |
| Veto LLD | 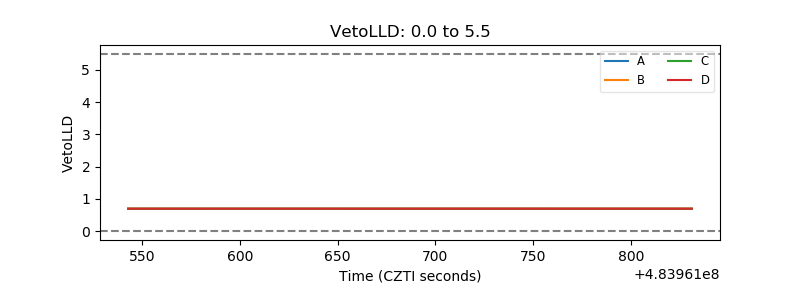 |
| Alpha Counter | 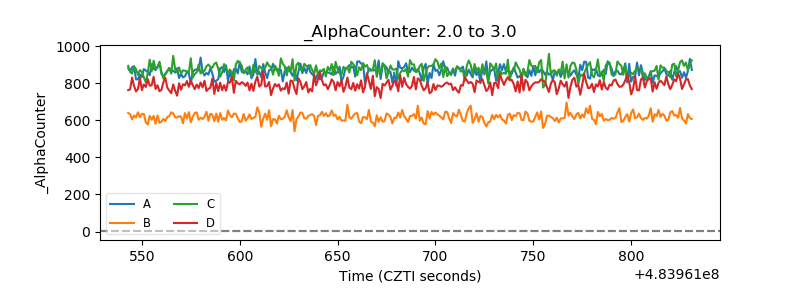 |
| _CPM_Rate | 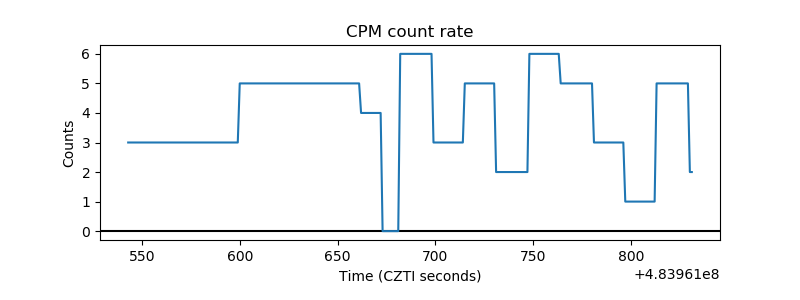 |
| CZT Counter | 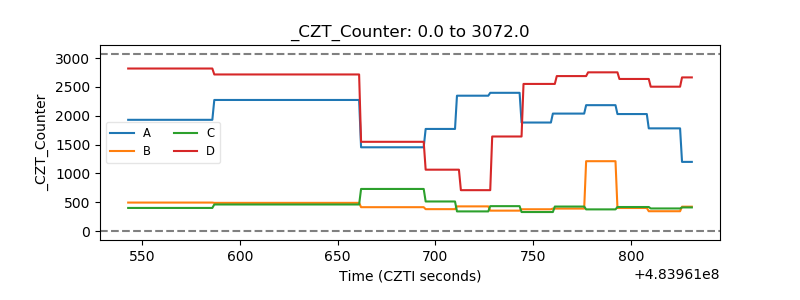 |
| +2.5 Volts monitor | 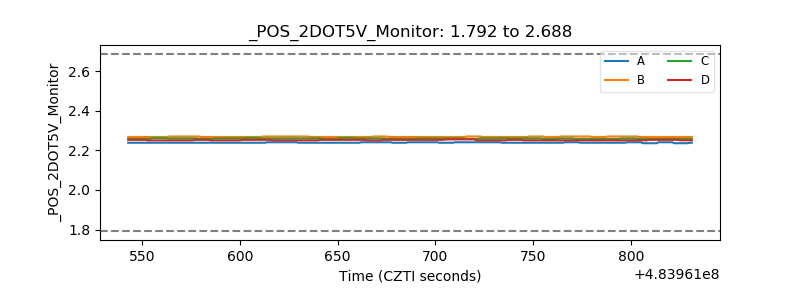 |
| +5 Volts monitor | 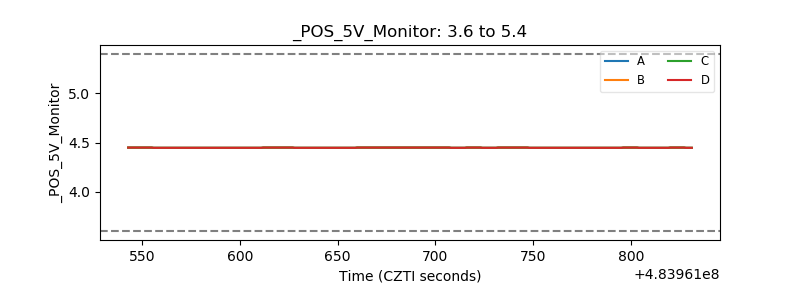 |
| _ROLL_ROT | 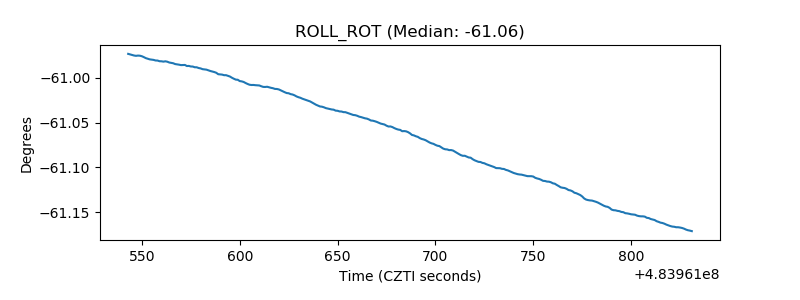 |
| _Roll_DEC | 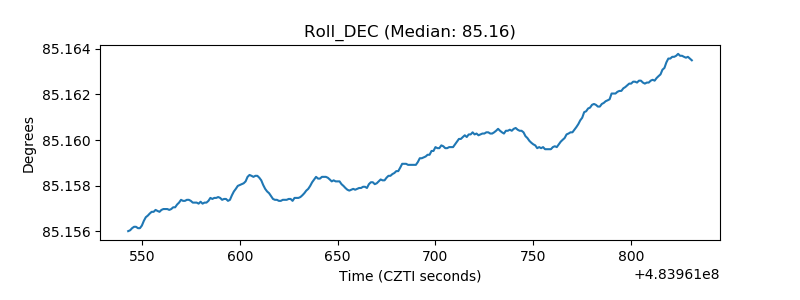 |
| _Roll_RA | 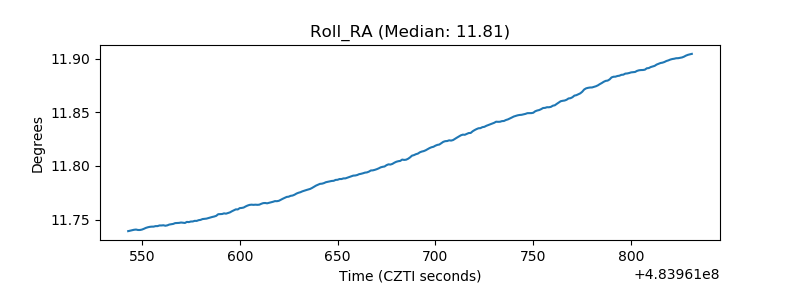 |
| Veto Counter | 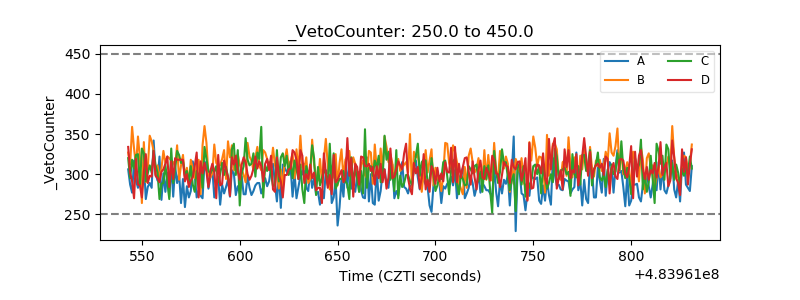 |