| Param | Original file | Final file |
|---|---|---|
| Filename | modeM0/AS1C09_011T05_9000006466_51911cztM0_level2.fits | modeM0/AS1C09_011T05_9000006466_51911cztM0_level2_quad_clean.evt |
| Size (bytes) | 951,992,640 | 67,299,840 |
| Size | 907.9 MB | 64.2 MB |
| Events in quadrant A | 7,446,902 | 495,882 |
| Events in quadrant B | 11,028,825 | 323,740 |
| Events in quadrant C | 7,530,979 | 435,528 |
| Events in quadrant D | 8,755,224 | 349,355 |
| Mode SS | |||
|---|---|---|---|
| Quadrant | BADHDUFLAG | Total packets | Discarded packets |
| A | 0 | 126 | 0 |
| B | 0 | 126 | 0 |
| C | 0 | 126 | 0 |
| D | 0 | 126 | 0 |
| Mode M0 | |||
|---|---|---|---|
| Quadrant | BADHDUFLAG | Total packets | Discarded packets |
| A | 0 | 26441 | 1 |
| B | 0 | 37012 | 1 |
| C | 0 | 26625 | 1 |
| D | 0 | 30281 | 1 |
| Mode M9 | |||
|---|---|---|---|
| Quadrant | BADHDUFLAG | Total packets | Discarded packets |
| A | 0 | 8 | 0 |
| B | 0 | 8 | 0 |
| C | 0 | 8 | 0 |
| D | 0 | 8 | 0 |
| Quadrant | Total seconds | Saturated seconds | Saturation percentage |
|---|---|---|---|
| A | 6195 | 1153 | 18.611784% |
| B | 6195 | 3440 | 55.528652% |
| C | 6195 | 1546 | 24.955609% |
| D | 6196 | 2209 | 35.652034% |
Noise dominated data is calculated using 1-second bins in cleaned event files. If a bin has >2000 counts, and if more than 50% of those come from <1% of pixels, then it is considered to be noise-dominated and hence unusable.
| Quadrant | # 1 sec bins | Bins with >0 counts | Bins with >2000 counts | High rate bins dominated by noise | Noise dominated (total time) | Noise dominated (detector-on time) | Marked lightcurve |
|---|---|---|---|---|---|---|---|
| A | 7009 | 6195 | 919 | 919 | 13.11% | 14.83% | 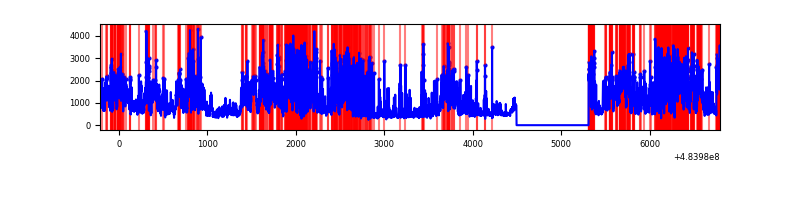 |
| B | 7010 | 6196 | 2669 | 2669 | 38.07% | 43.08% | 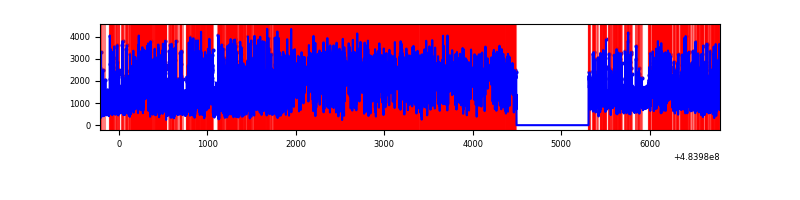 |
| C | 7010 | 6195 | 1231 | 1231 | 17.56% | 19.87% | 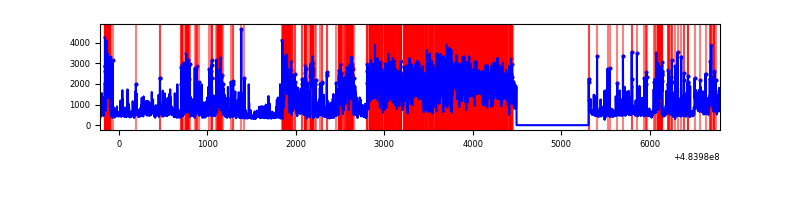 |
| D | 7011 | 6196 | 1802 | 1802 | 25.70% | 29.08% | 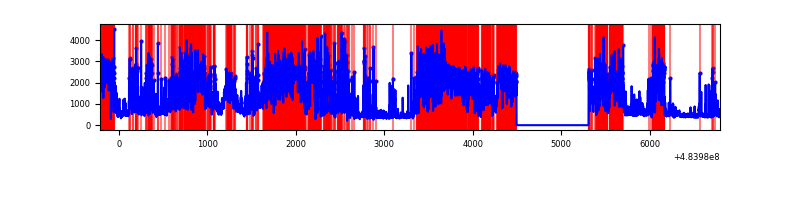 |
Top three noisy pixels from each quadrant. If the there are fewer than three noisy pixels in the level2.evt file, extra rows are filled as -1
| Pixel properties | Quadrant properties | ||||||
|---|---|---|---|---|---|---|---|
| Quadrant | DetID | PixID | Counts | Sigma | Mean | Median | Sigma |
| A | 12 | 3 | 2256106 | 14855.22 | 602 | 587 | 151.8 |
| A | 7 | 64 | 1027964 | 6766.48 | 602 | 587 | 151.8 |
| A | 3 | 95 | 938330 | 6176.13 | 602 | 587 | 151.8 |
| B | 12 | 32 | 7953342 | 78942.83 | 472 | 457 | 100.7 |
| B | 5 | 32 | 365395 | 3622.49 | 472 | 457 | 100.7 |
| B | 5 | 172 | 329518 | 3266.36 | 472 | 457 | 100.7 |
| C | 15 | 158 | 3535522 | 21930.54 | 585 | 580 | 161.2 |
| C | 0 | 193 | 263081 | 1628.54 | 585 | 580 | 161.2 |
| C | 13 | 3 | 233524 | 1445.17 | 585 | 580 | 161.2 |
| D | 12 | 17 | 2816152 | 19879.57 | 489 | 467 | 141.6 |
| D | 2 | 172 | 1239632 | 8748.87 | 489 | 467 | 141.6 |
| D | 3 | 12 | 1213590 | 8565.01 | 489 | 467 | 141.6 |
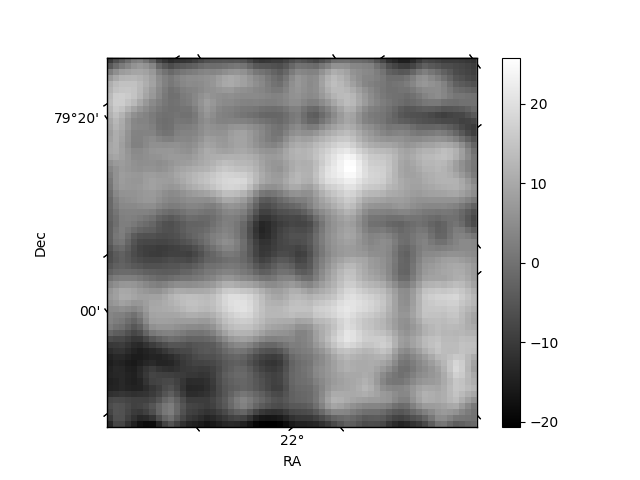
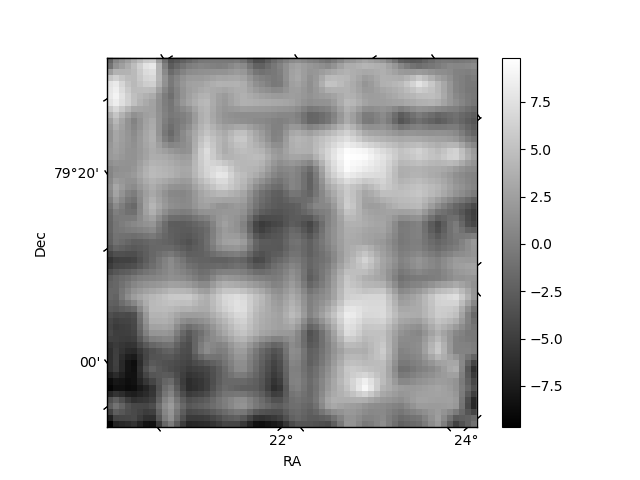
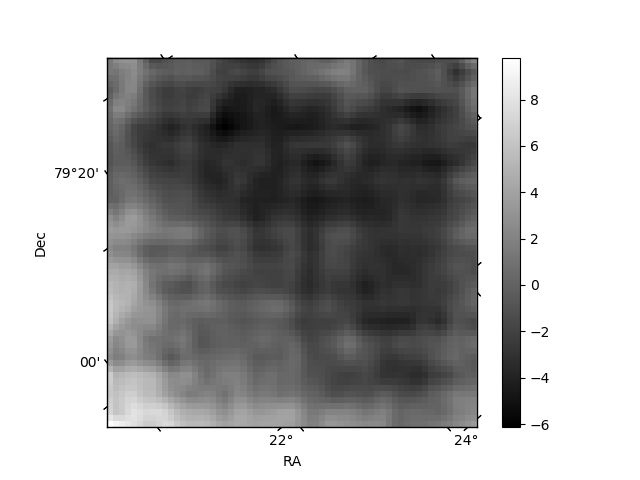
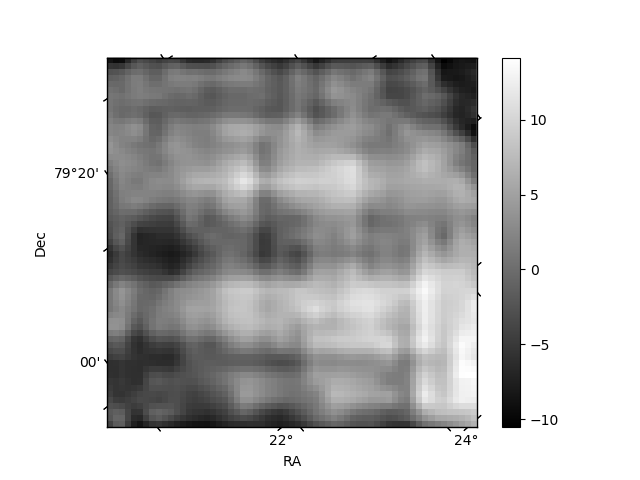
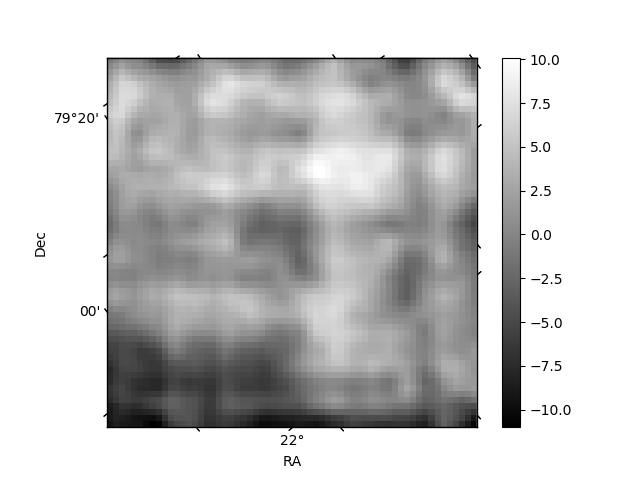
Histogram calculated using DETX and DETY for each event in the final _common_clean file
| Quadrant A | 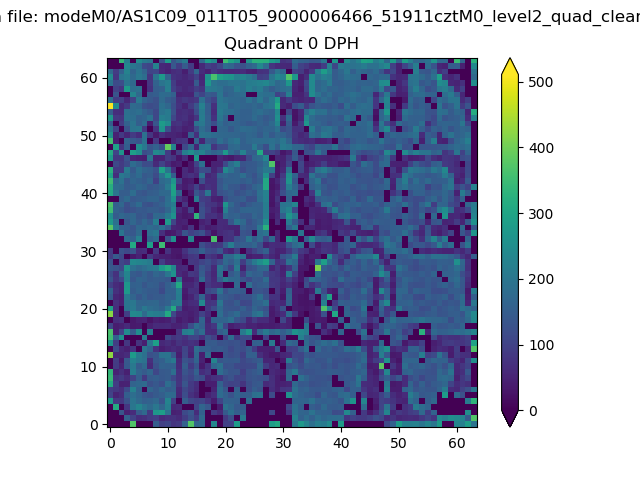 |
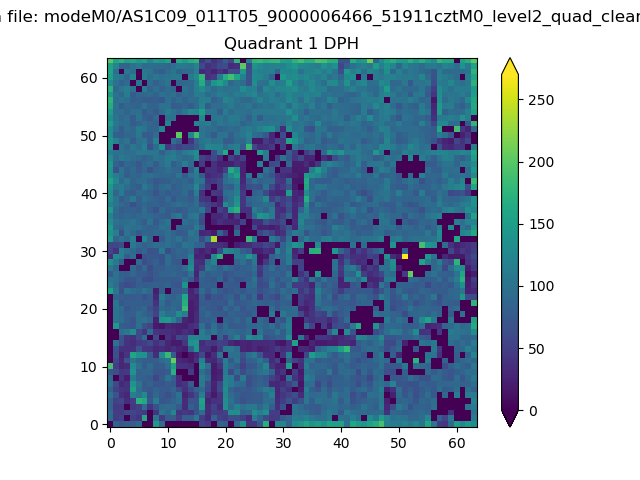 |
Quadrant B |
|---|---|---|---|
| Quadrant D | 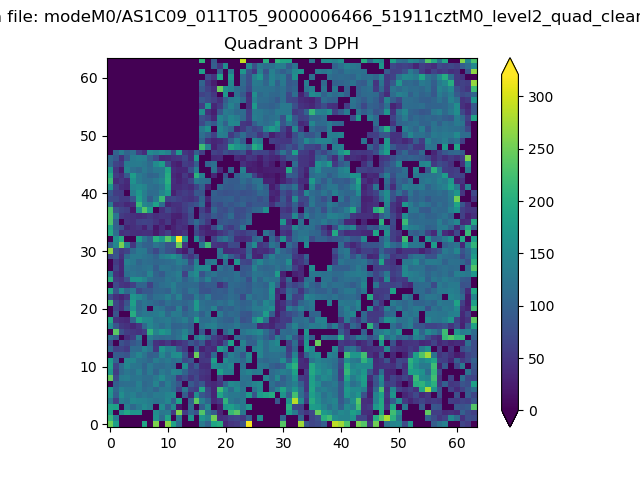 |
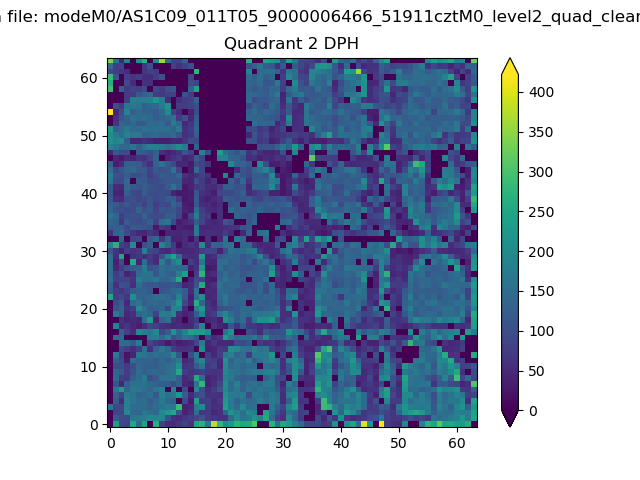 |
Quadrant C |
| Plot type | Count rate plots | Images |
|---|---|---|
| Comparison with Poisson distribution Blue bars denote a histogram of data divided into 1 sec bins. Red curve is a Poisson curve with rate = median count rate of data. |
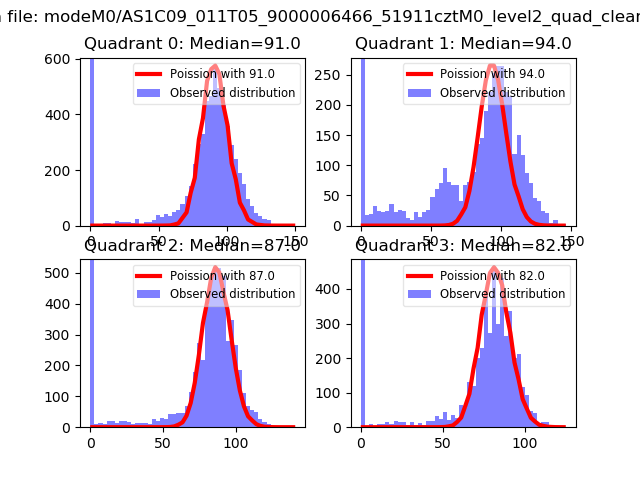 |
 |
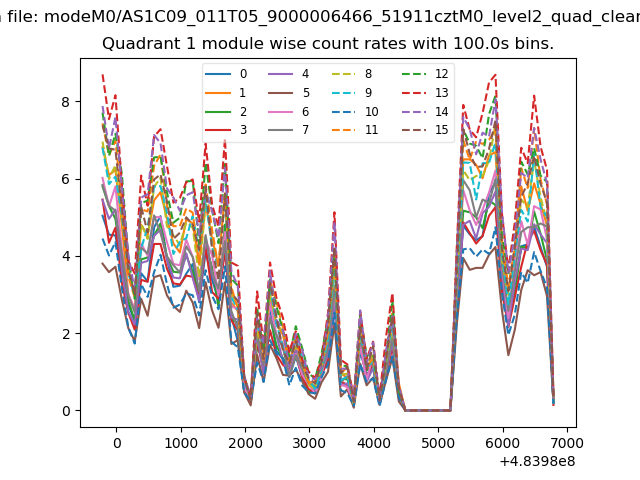
| Quadrant-wise count rates Data is divided into 100 sec bins |
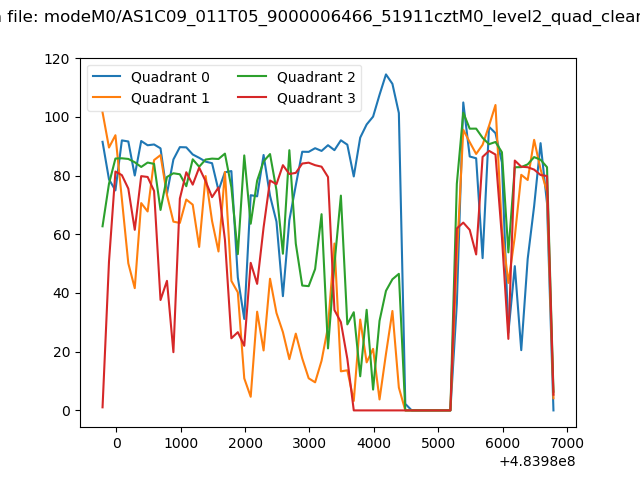 |
|
| Module-wise count rates for Quadrant A Data is divided into 100 sec bins |
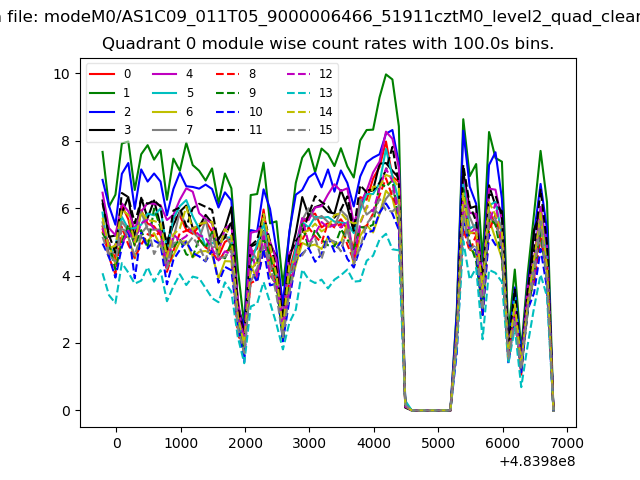 |
 |
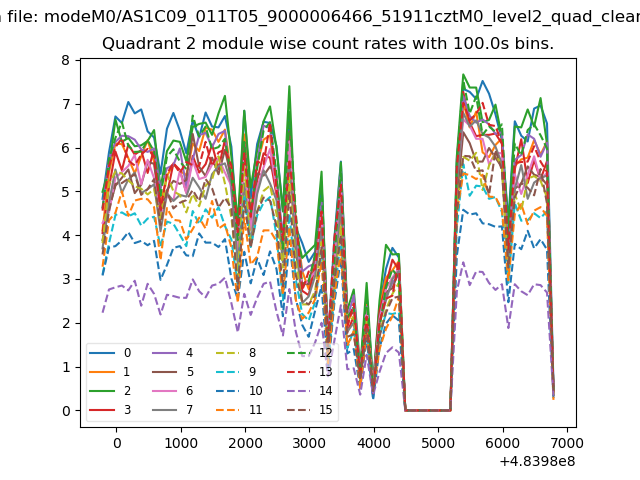
| Module-wise count rates for Quadrant B Data is divided into 100 sec bins |
 |
 |
| Module-wise count rates for Quadrant C Data is divided into 100 sec bins |
 |
 |
| Module-wise count rates for Quadrant D Data is divided into 100 sec bins |
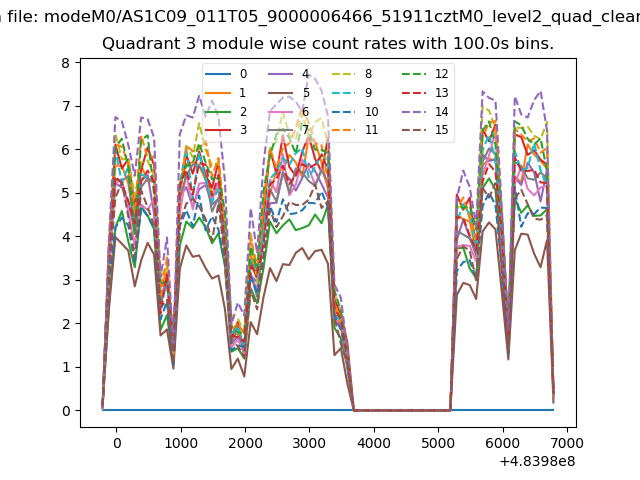 |
 |
| Parameter | Plot |
|---|---|
| CZT HV Monitor | 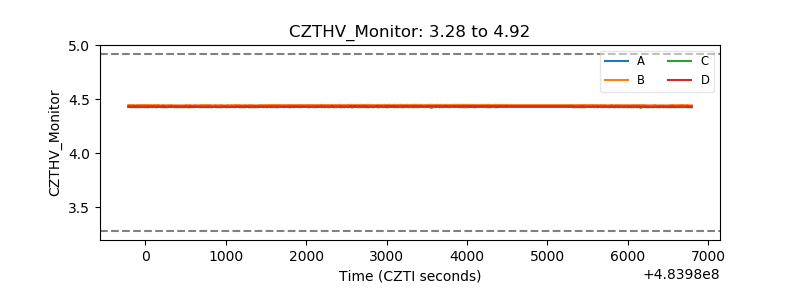 |
| D_VDD | 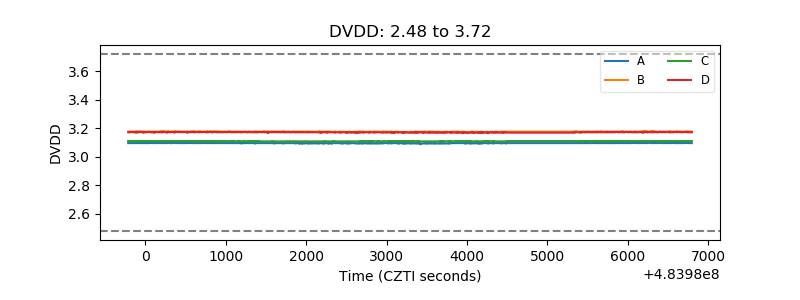 |
| Temperature 1 | 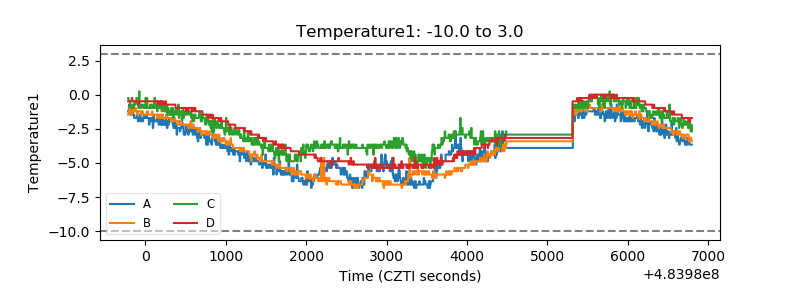 |
| Veto HV Monitor | 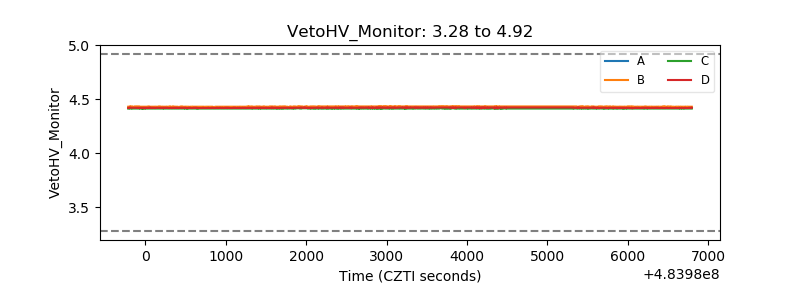 |
| Veto LLD | 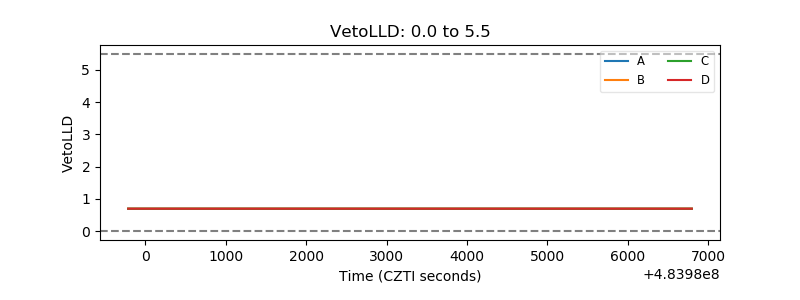 |
| Alpha Counter | 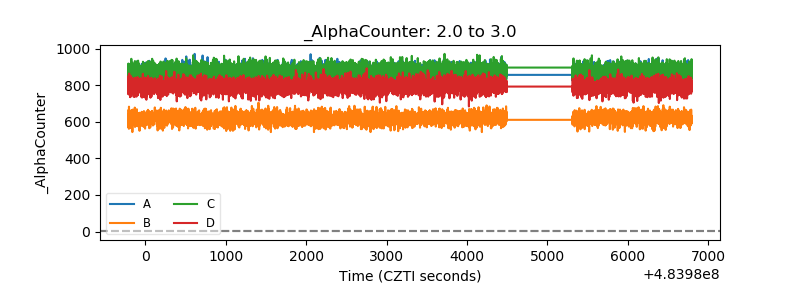 |
| _CPM_Rate | 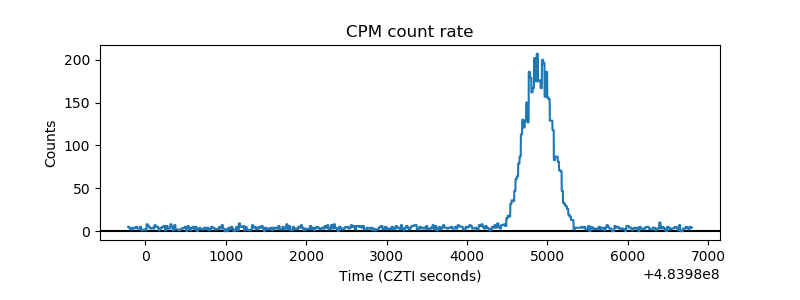 |
| CZT Counter | 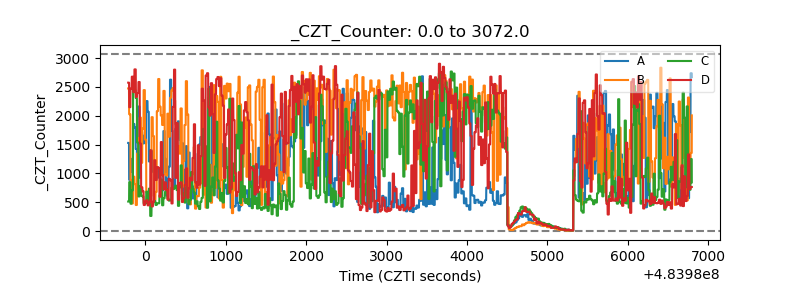 |
| +2.5 Volts monitor | 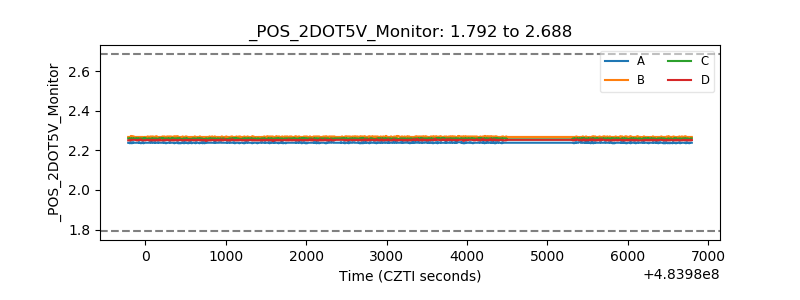 |
| +5 Volts monitor | 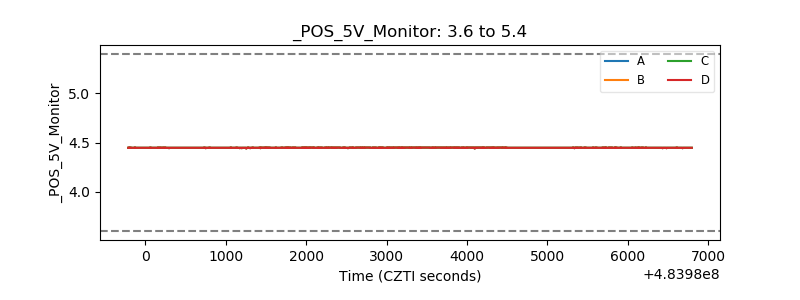 |
| _ROLL_ROT | 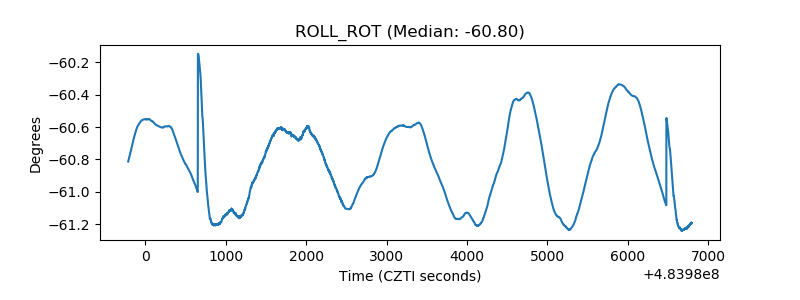 |
| _Roll_DEC | 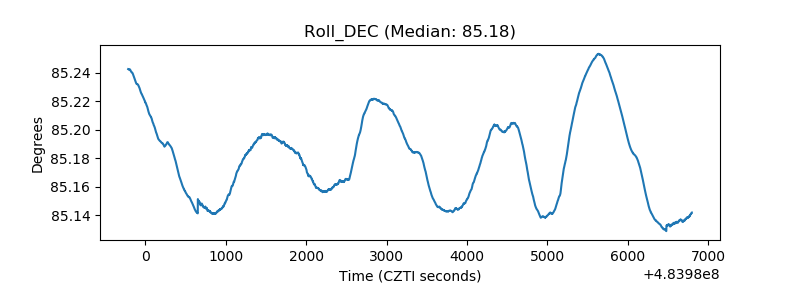 |
| _Roll_RA | 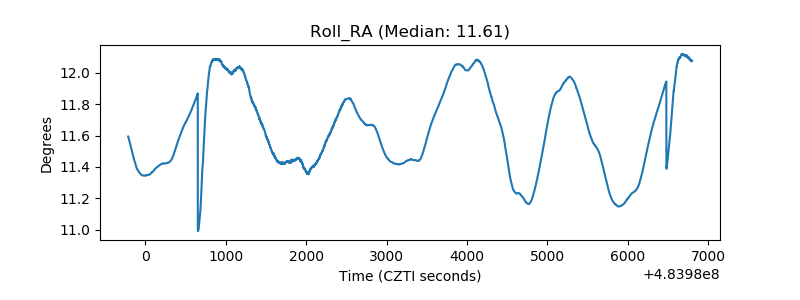 |
| Veto Counter | 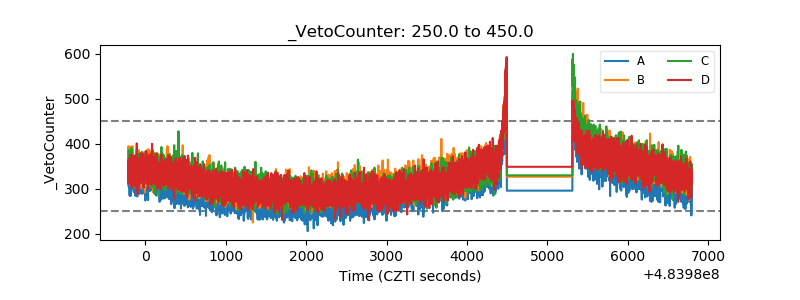 |