| Param | Original file | Final file |
|---|---|---|
| Filename | modeM0/AS1C09_011T05_9000006466_51912cztM0_level2.fits | modeM0/AS1C09_011T05_9000006466_51912cztM0_level2_quad_clean.evt |
| Size (bytes) | 946,952,640 | 73,857,600 |
| Size | 903.1 MB | 70.4 MB |
| Events in quadrant A | 8,570,277 | 490,834 |
| Events in quadrant B | 7,794,310 | 540,372 |
| Events in quadrant C | 10,081,896 | 387,480 |
| Events in quadrant D | 8,097,651 | 357,526 |
| Mode SS | |||
|---|---|---|---|
| Quadrant | BADHDUFLAG | Total packets | Discarded packets |
| A | 0 | 134 | 0 |
| B | 0 | 134 | 0 |
| C | 0 | 134 | 0 |
| D | 0 | 134 | 0 |
| Mode M0 | |||
|---|---|---|---|
| Quadrant | BADHDUFLAG | Total packets | Discarded packets |
| A | 0 | 30104 | 3 |
| B | 0 | 27795 | 1 |
| C | 0 | 34456 | 1 |
| D | 0 | 28591 | 1 |
| Mode M9 | |||
|---|---|---|---|
| Quadrant | BADHDUFLAG | Total packets | Discarded packets |
| A | 0 | 9 | 0 |
| B | 0 | 9 | 0 |
| C | 0 | 9 | 0 |
| D | 0 | 9 | 0 |
| Quadrant | Total seconds | Saturated seconds | Saturation percentage |
|---|---|---|---|
| A | 6588 | 1616 | 24.529447% |
| B | 6589 | 1621 | 24.601609% |
| C | 6589 | 2641 | 40.081955% |
| D | 6589 | 2548 | 38.670511% |
Noise dominated data is calculated using 1-second bins in cleaned event files. If a bin has >2000 counts, and if more than 50% of those come from <1% of pixels, then it is considered to be noise-dominated and hence unusable.
| Quadrant | # 1 sec bins | Bins with >0 counts | Bins with >2000 counts | High rate bins dominated by noise | Noise dominated (total time) | Noise dominated (detector-on time) | Marked lightcurve |
|---|---|---|---|---|---|---|---|
| A | 7524 | 6588 | 1304 | 1304 | 17.33% | 19.79% | 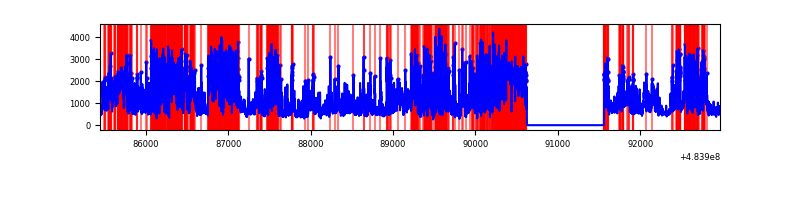 |
| B | 7525 | 6590 | 1271 | 1271 | 16.89% | 19.29% | 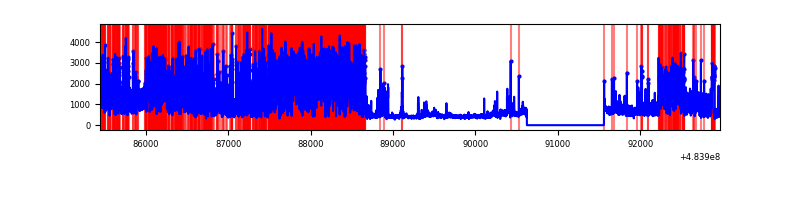 |
| C | 7524 | 6588 | 2368 | 2368 | 31.47% | 35.94% | 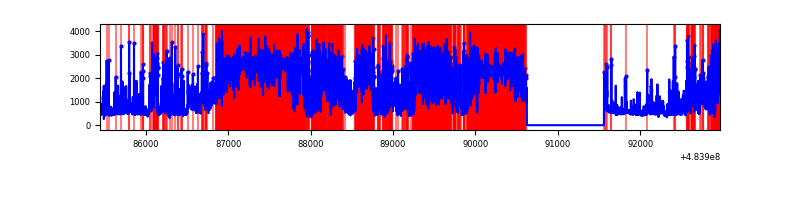 |
| D | 7525 | 6589 | 1428 | 1428 | 18.98% | 21.67% | 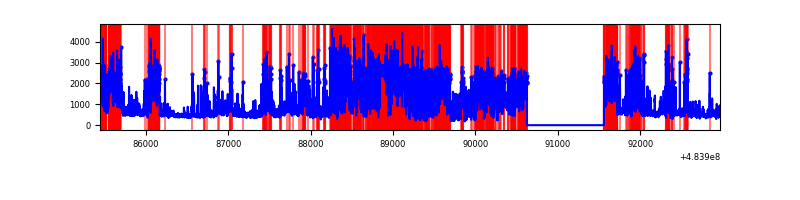 |
Top three noisy pixels from each quadrant. If the there are fewer than three noisy pixels in the level2.evt file, extra rows are filled as -1
| Pixel properties | Quadrant properties | ||||||
|---|---|---|---|---|---|---|---|
| Quadrant | DetID | PixID | Counts | Sigma | Mean | Median | Sigma |
| A | 7 | 64 | 2007761 | 13087.52 | 611 | 597 | 153.4 |
| A | 12 | 3 | 1951537 | 12720.92 | 611 | 597 | 153.4 |
| A | 3 | 95 | 1328350 | 8657.49 | 611 | 597 | 153.4 |
| B | 12 | 32 | 3519851 | 26628.81 | 626 | 606 | 132.2 |
| B | 5 | 32 | 647211 | 4892.62 | 626 | 606 | 132.2 |
| B | 5 | 172 | 233899 | 1765.24 | 626 | 606 | 132.2 |
| C | 15 | 158 | 4431740 | 27892.75 | 572 | 567 | 158.9 |
| C | 9 | 38 | 1884980 | 11861.75 | 572 | 567 | 158.9 |
| C | 15 | 178 | 272790 | 1713.55 | 572 | 567 | 158.9 |
| D | 12 | 17 | 3418744 | 24744.99 | 482 | 461 | 138.1 |
| D | 6 | 42 | 1041599 | 7536.81 | 482 | 461 | 138.1 |
| D | 15 | 94 | 616878 | 4462.25 | 482 | 461 | 138.1 |
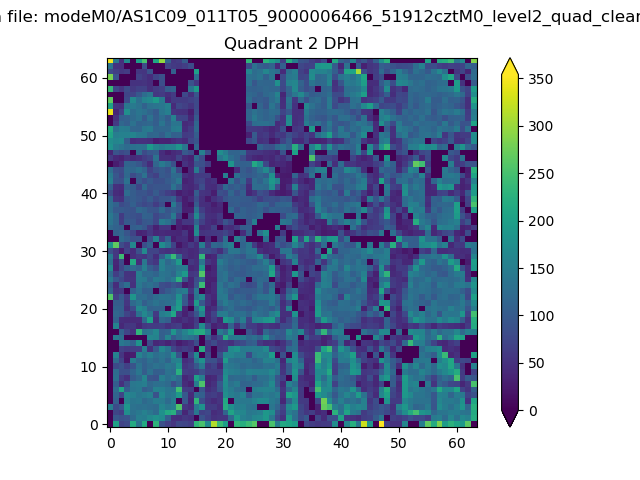
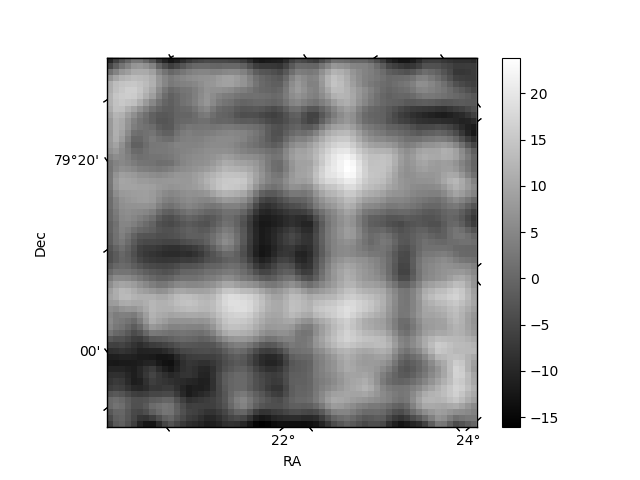
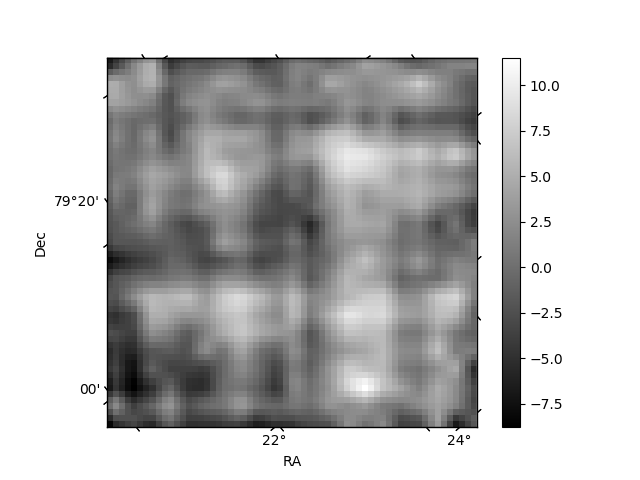
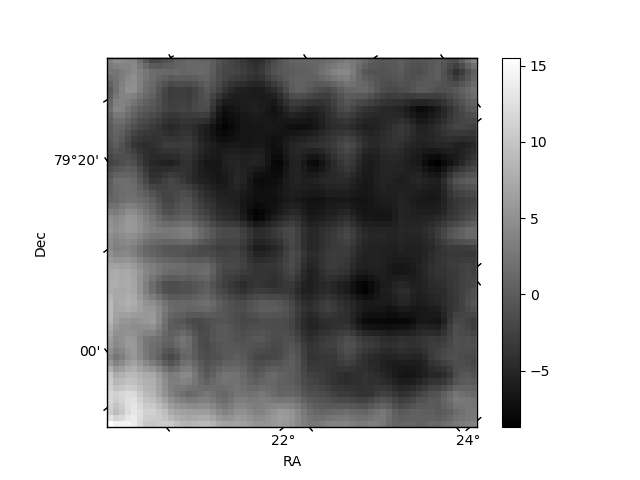
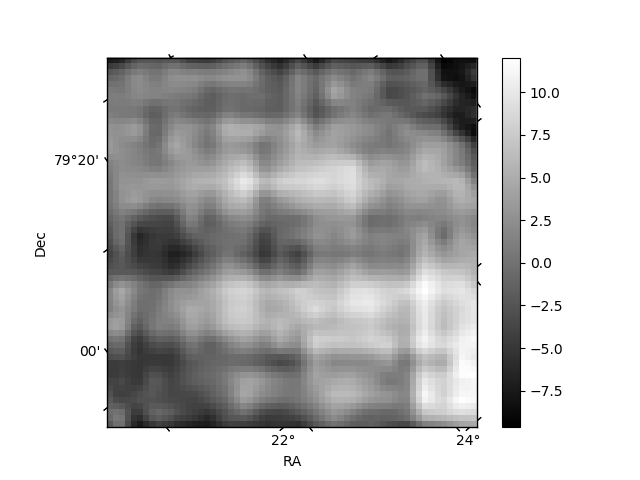
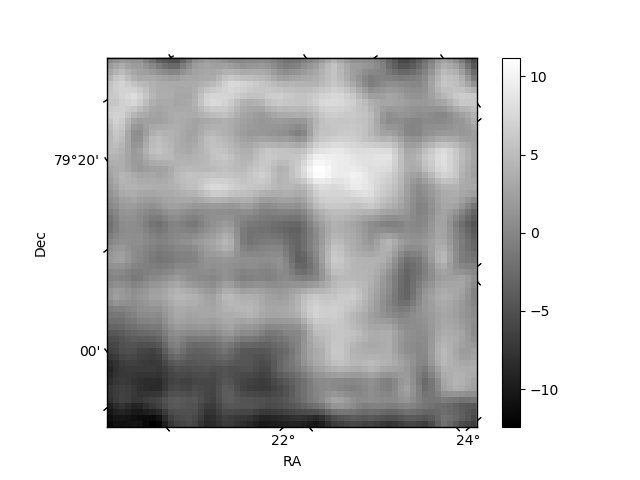
Histogram calculated using DETX and DETY for each event in the final _common_clean file
| Quadrant A | 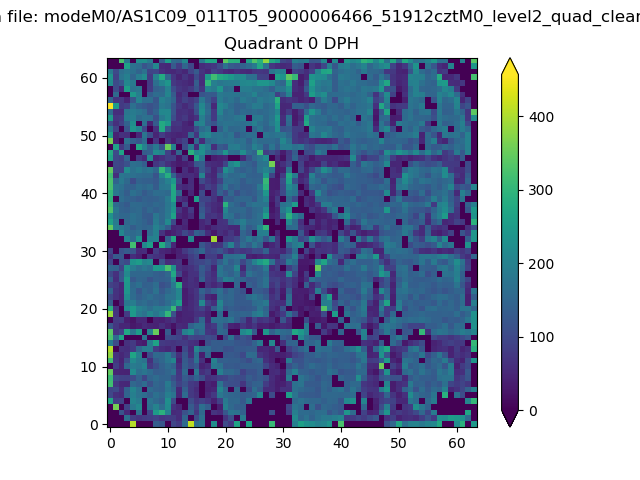 |
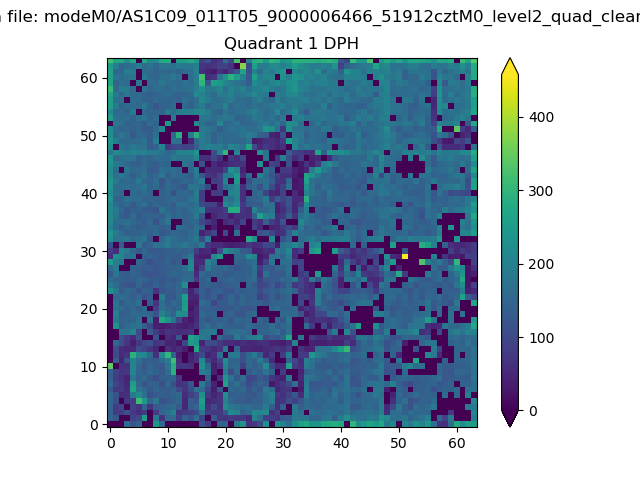 |
Quadrant B |
|---|---|---|---|
| Quadrant D | 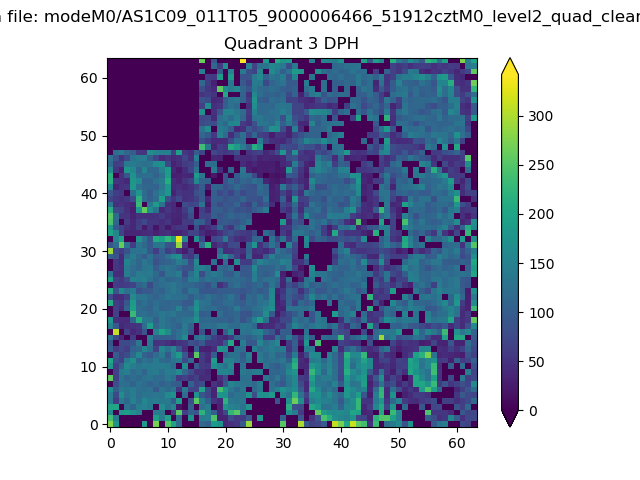 |
 |
Quadrant C |
| Plot type | Count rate plots | Images |
|---|---|---|
| Comparison with Poisson distribution Blue bars denote a histogram of data divided into 1 sec bins. Red curve is a Poisson curve with rate = median count rate of data. |
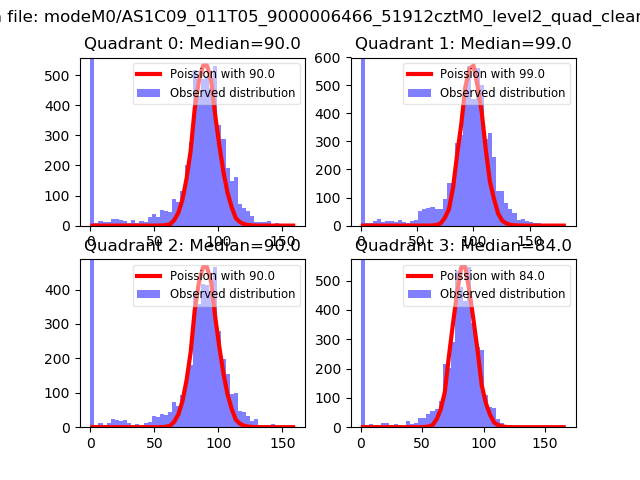 |
 |
| Quadrant-wise count rates Data is divided into 100 sec bins |
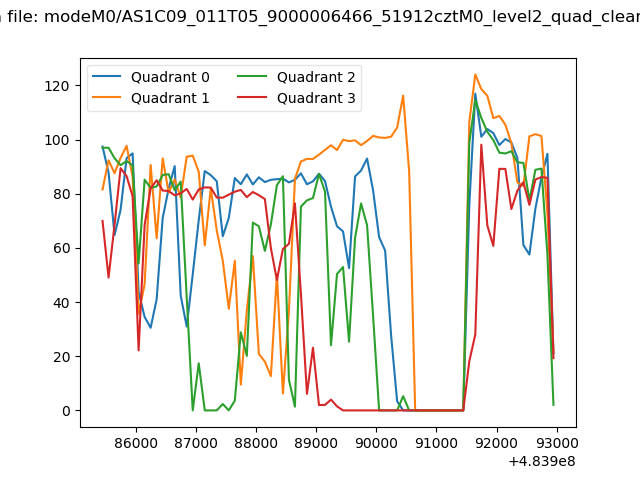 |
|
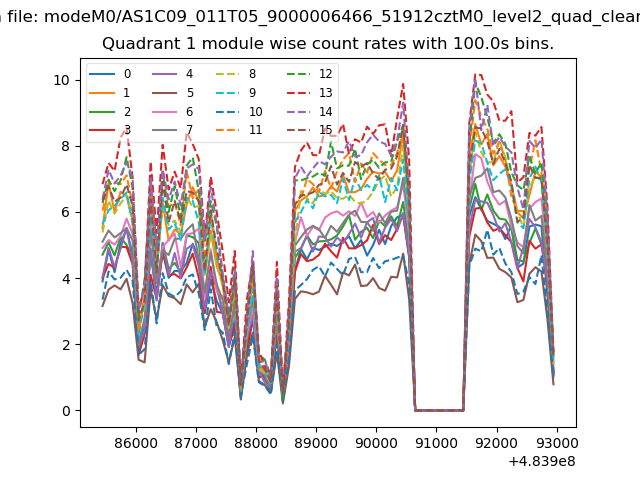
| Module-wise count rates for Quadrant A Data is divided into 100 sec bins |
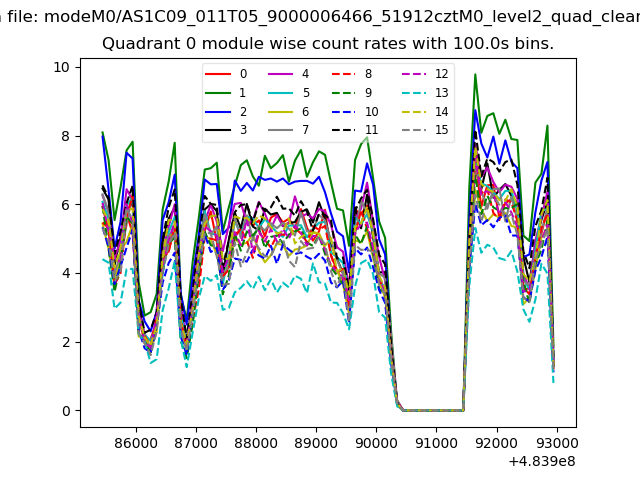 |
 |
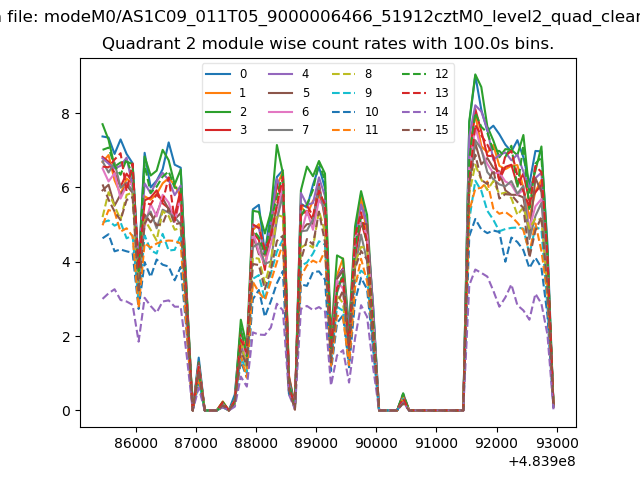
| Module-wise count rates for Quadrant B Data is divided into 100 sec bins |
 |
 |
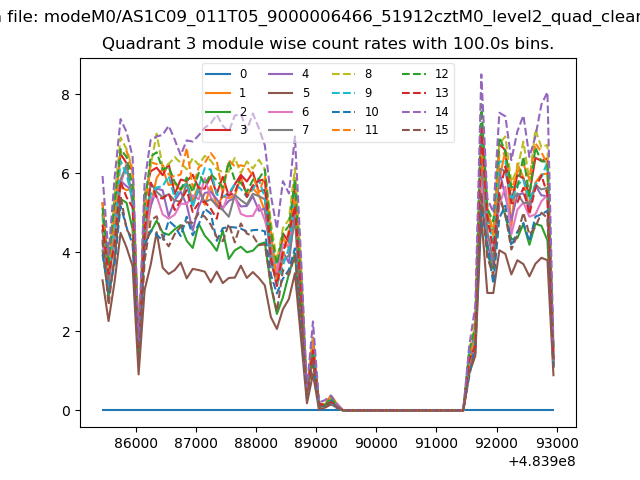
| Module-wise count rates for Quadrant C Data is divided into 100 sec bins |
 |
 |
| Module-wise count rates for Quadrant D Data is divided into 100 sec bins |
 |
 |
| Parameter | Plot |
|---|---|
| CZT HV Monitor | 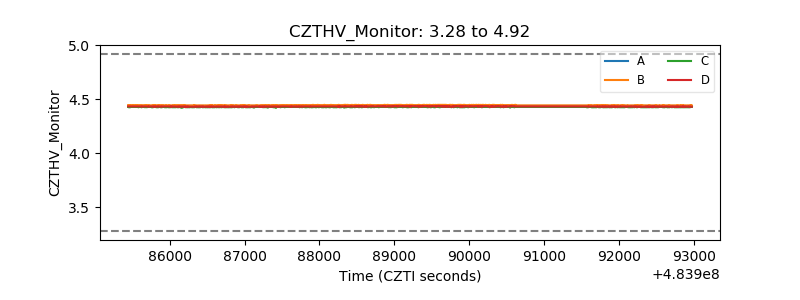 |
| D_VDD | 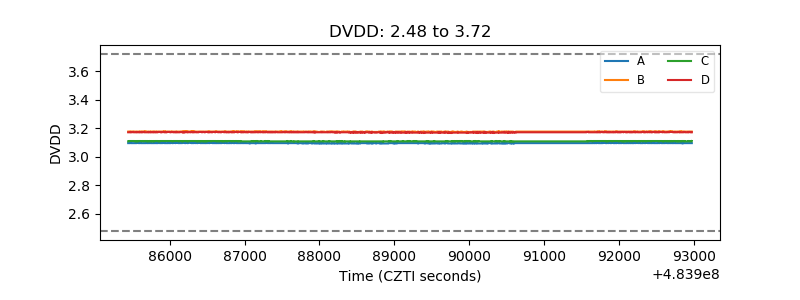 |
| Temperature 1 | 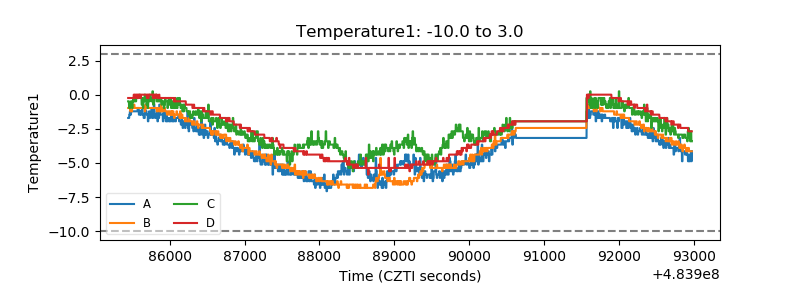 |
| Veto HV Monitor | 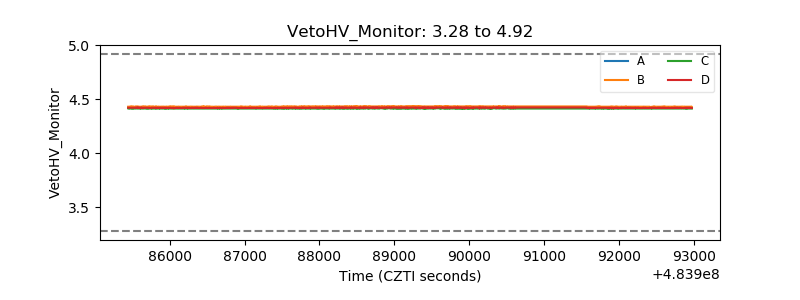 |
| Veto LLD | 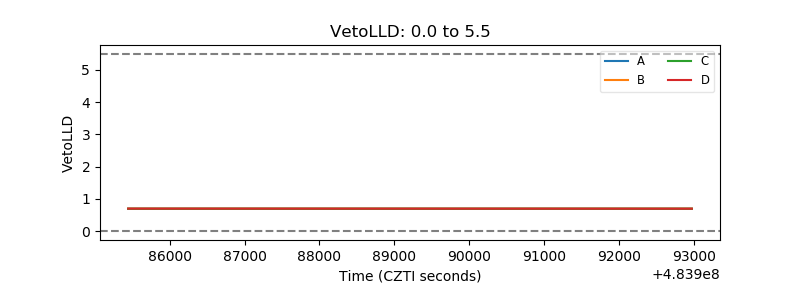 |
| Alpha Counter | 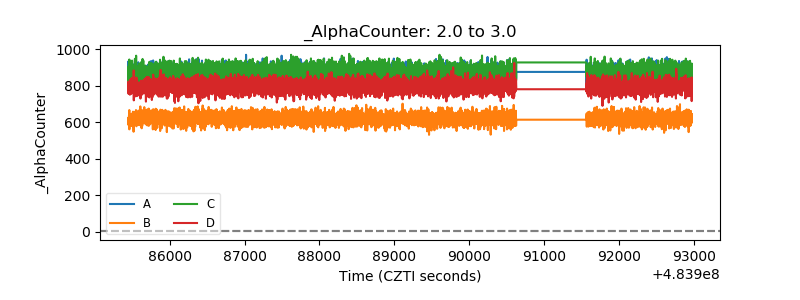 |
| _CPM_Rate | 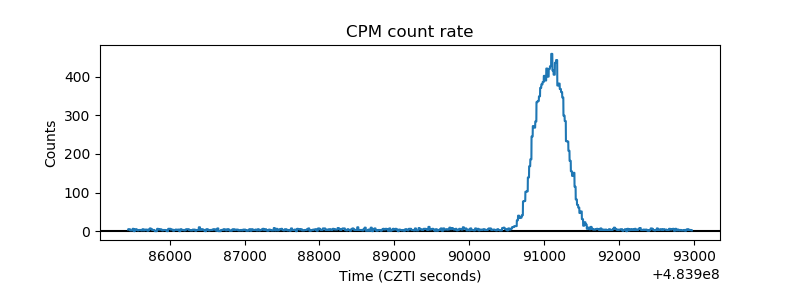 |
| CZT Counter | 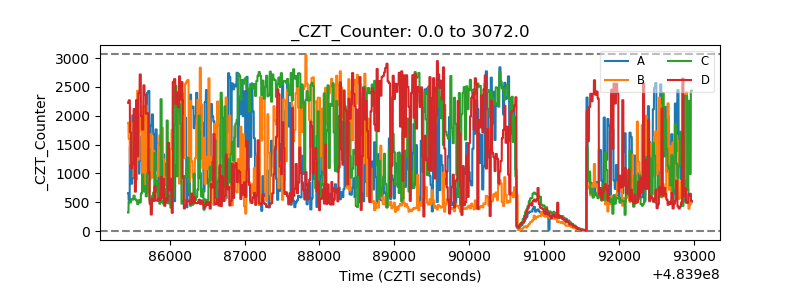 |
| +2.5 Volts monitor | 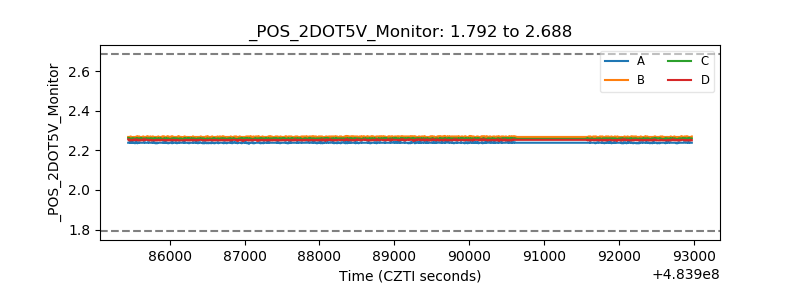 |
| +5 Volts monitor | 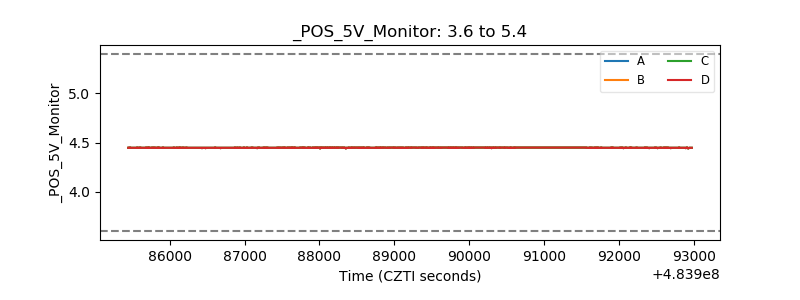 |
| _ROLL_ROT | 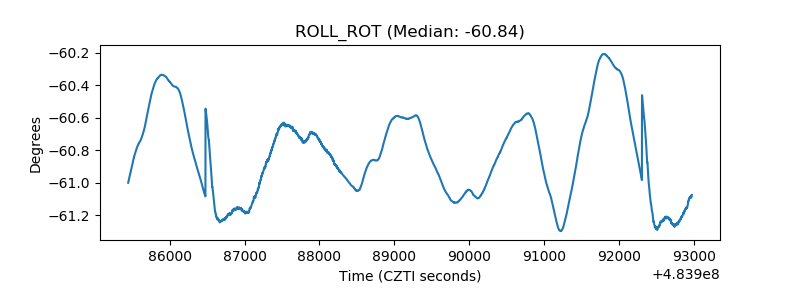 |
| _Roll_DEC | 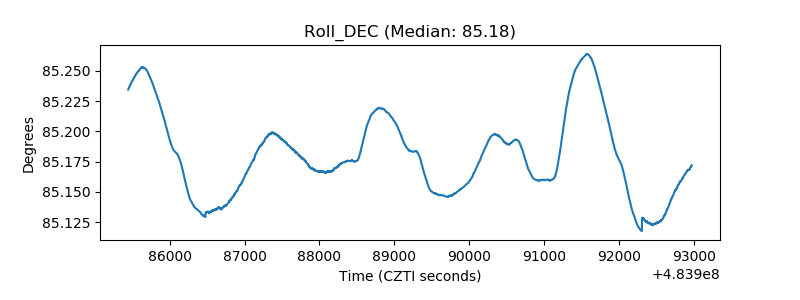 |
| _Roll_RA | 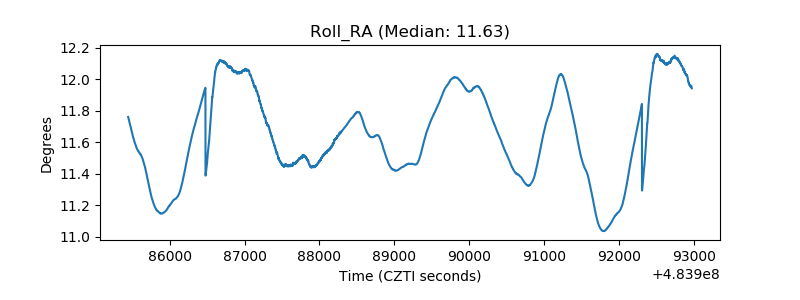 |
| Veto Counter | 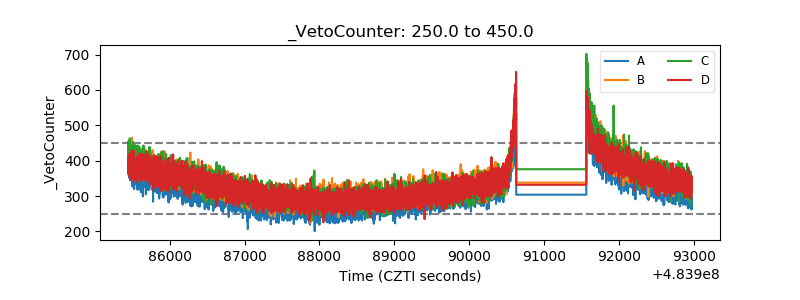 |