| Param | Original file | Final file |
|---|---|---|
| Filename | modeM0/AS1C09_011T05_9000006466_51914cztM0_level2.fits | modeM0/AS1C09_011T05_9000006466_51914cztM0_level2_quad_clean.evt |
| Size (bytes) | 662,820,480 | 82,975,680 |
| Size | 632.1 MB | 79.1 MB |
| Events in quadrant A | 5,435,809 | 560,888 |
| Events in quadrant B | 5,224,487 | 578,947 |
| Events in quadrant C | 5,704,380 | 531,784 |
| Events in quadrant D | 7,688,080 | 404,987 |
| Mode SS | |||
|---|---|---|---|
| Quadrant | BADHDUFLAG | Total packets | Discarded packets |
| A | 0 | 128 | 0 |
| B | 0 | 128 | 0 |
| C | 0 | 128 | 0 |
| D | 0 | 128 | 0 |
| Mode M0 | |||
|---|---|---|---|
| Quadrant | BADHDUFLAG | Total packets | Discarded packets |
| A | 0 | 20564 | 1 |
| B | 0 | 19862 | 1 |
| C | 0 | 21329 | 1 |
| D | 0 | 27053 | 2 |
| Mode M9 | |||
|---|---|---|---|
| Quadrant | BADHDUFLAG | Total packets | Discarded packets |
| A | 0 | 11 | 0 |
| B | 0 | 11 | 0 |
| C | 0 | 11 | 0 |
| D | 0 | 11 | 0 |
| Quadrant | Total seconds | Saturated seconds | Saturation percentage |
|---|---|---|---|
| A | 6235 | 409 | 6.559743% |
| B | 6235 | 701 | 11.242983% |
| C | 6236 | 662 | 10.615779% |
| D | 6235 | 1654 | 26.527666% |
Noise dominated data is calculated using 1-second bins in cleaned event files. If a bin has >2000 counts, and if more than 50% of those come from <1% of pixels, then it is considered to be noise-dominated and hence unusable.
| Quadrant | # 1 sec bins | Bins with >0 counts | Bins with >2000 counts | High rate bins dominated by noise | Noise dominated (total time) | Noise dominated (detector-on time) | Marked lightcurve |
|---|---|---|---|---|---|---|---|
| A | 7315 | 6236 | 334 | 334 | 4.57% | 5.36% | 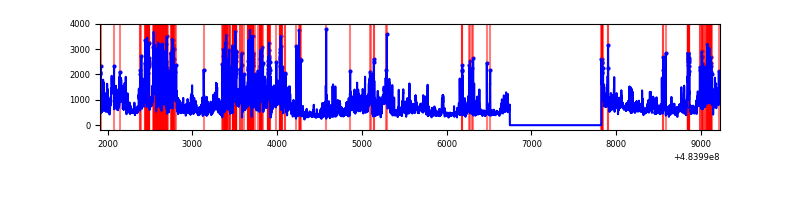 |
| B | 7315 | 6235 | 515 | 515 | 7.04% | 8.26% | 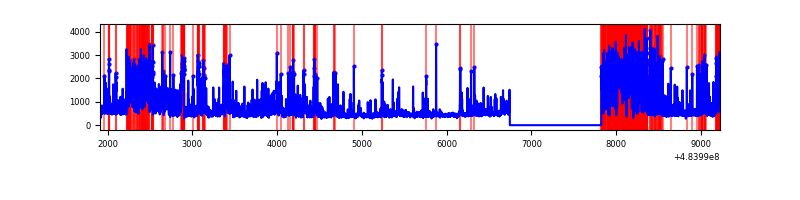 |
| C | 7316 | 6236 | 526 | 526 | 7.19% | 8.43% | 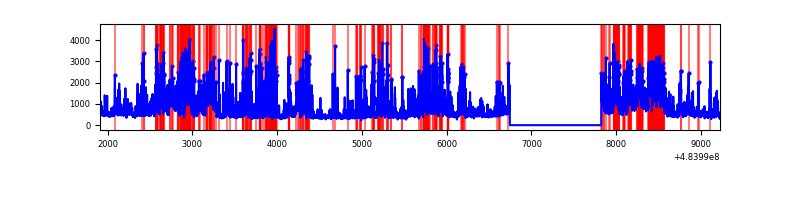 |
| D | 7314 | 6234 | 1531 | 1531 | 20.93% | 24.56% | 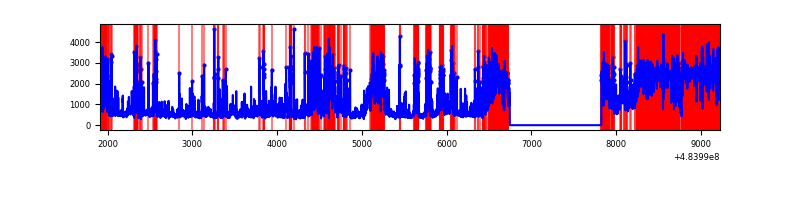 |
Top three noisy pixels from each quadrant. If the there are fewer than three noisy pixels in the level2.evt file, extra rows are filled as -1
| Pixel properties | Quadrant properties | ||||||
|---|---|---|---|---|---|---|---|
| Quadrant | DetID | PixID | Counts | Sigma | Mean | Median | Sigma |
| A | 12 | 3 | 959625 | 6036.57 | 633 | 618 | 158.9 |
| A | 7 | 64 | 818770 | 5149.94 | 633 | 618 | 158.9 |
| A | 3 | 95 | 191506 | 1201.56 | 633 | 618 | 158.9 |
| B | 5 | 32 | 1138505 | 8581.55 | 624 | 603 | 132.6 |
| B | 4 | 171 | 499577 | 3763.04 | 624 | 603 | 132.6 |
| B | 1 | 238 | 230042 | 1730.33 | 624 | 603 | 132.6 |
| C | 15 | 158 | 994173 | 5790.8 | 620 | 615 | 171.6 |
| C | 15 | 231 | 472461 | 2750.08 | 620 | 615 | 171.6 |
| C | 13 | 3 | 376831 | 2192.72 | 620 | 615 | 171.6 |
| D | 12 | 17 | 2017277 | 12952.91 | 543 | 519 | 155.7 |
| D | 15 | 94 | 1244740 | 7991.19 | 543 | 519 | 155.7 |
| D | 6 | 42 | 936579 | 6011.98 | 543 | 519 | 155.7 |
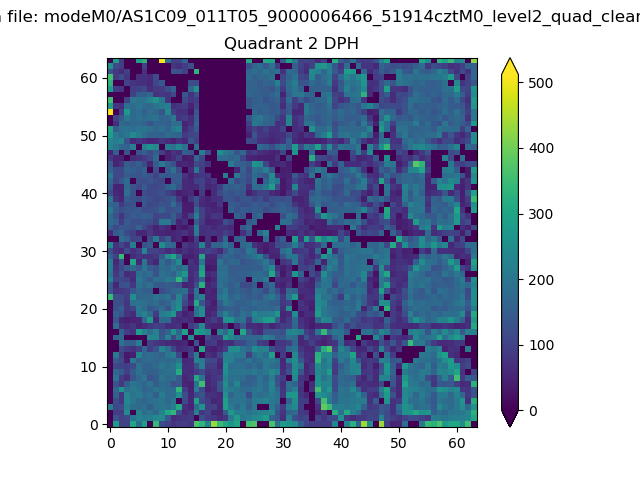
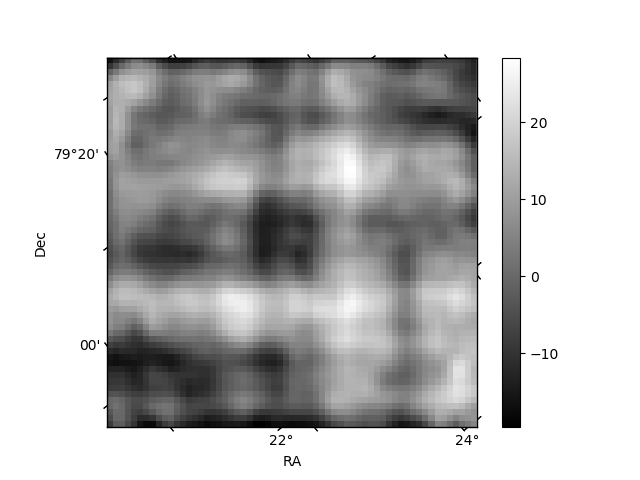
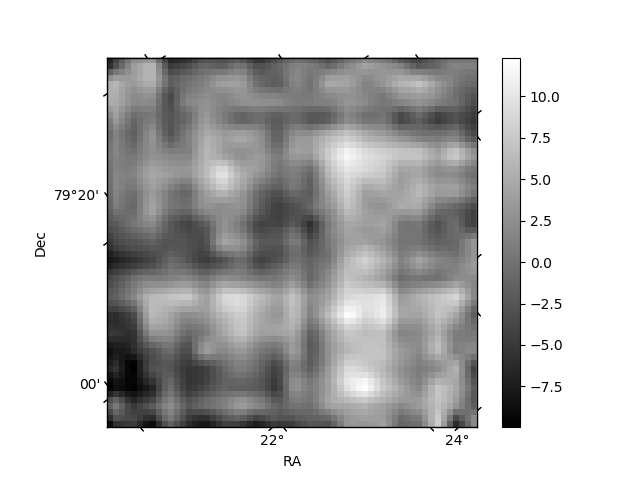
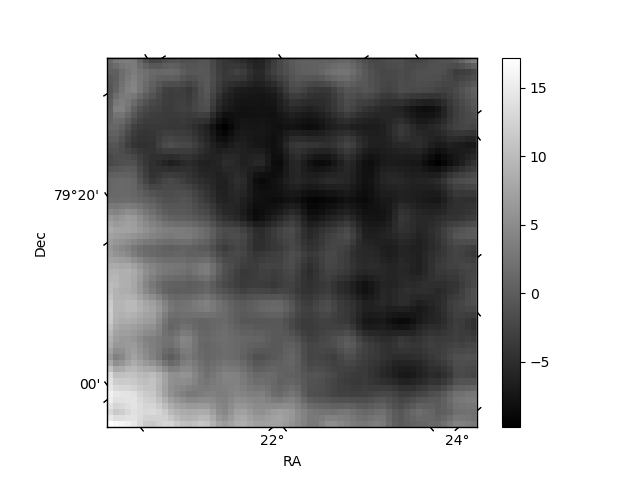
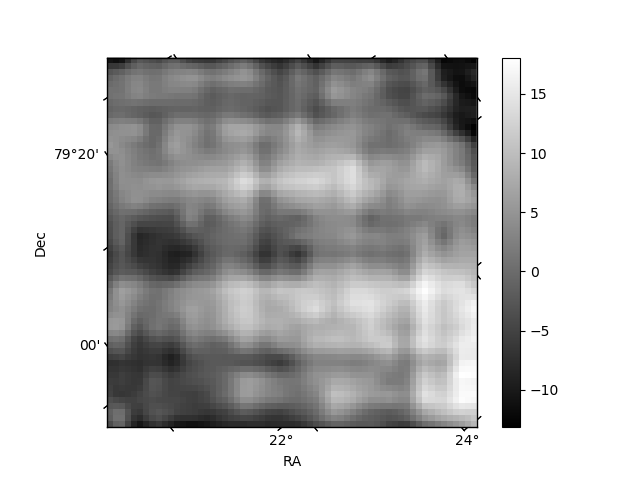
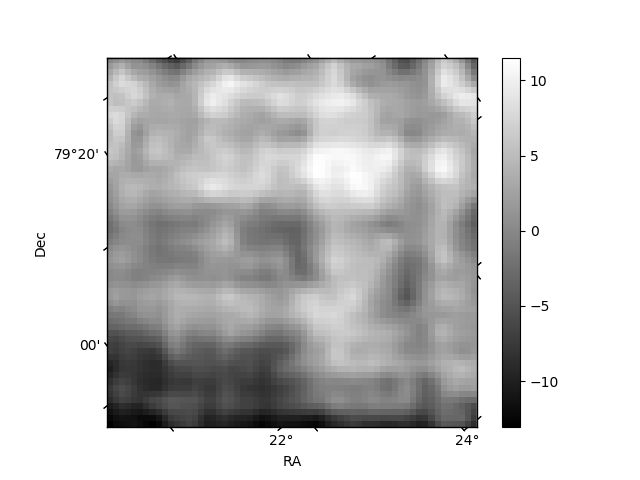
Histogram calculated using DETX and DETY for each event in the final _common_clean file
| Quadrant A | 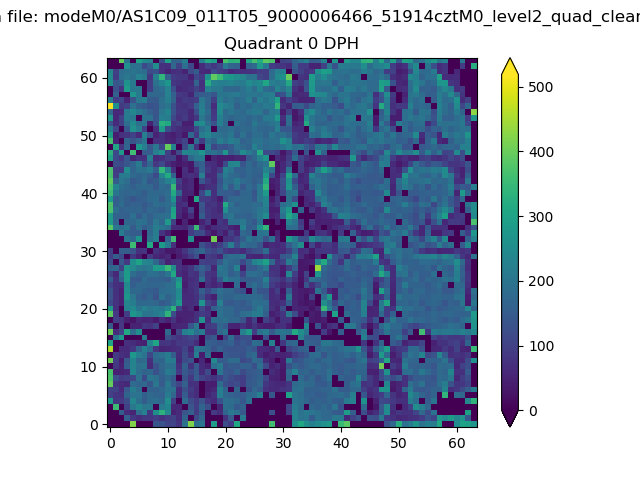 |
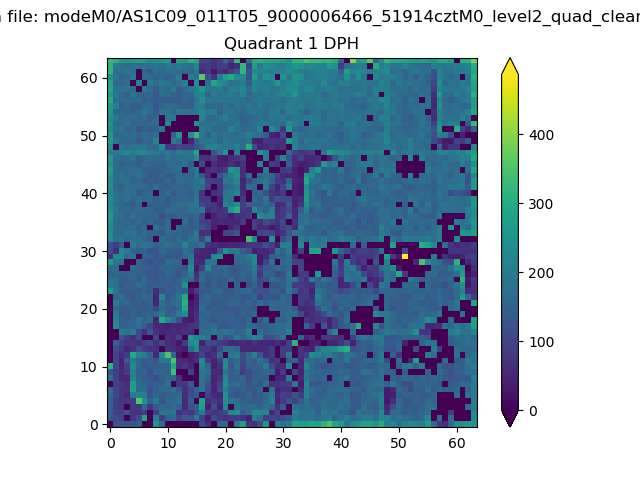 |
Quadrant B |
|---|---|---|---|
| Quadrant D | 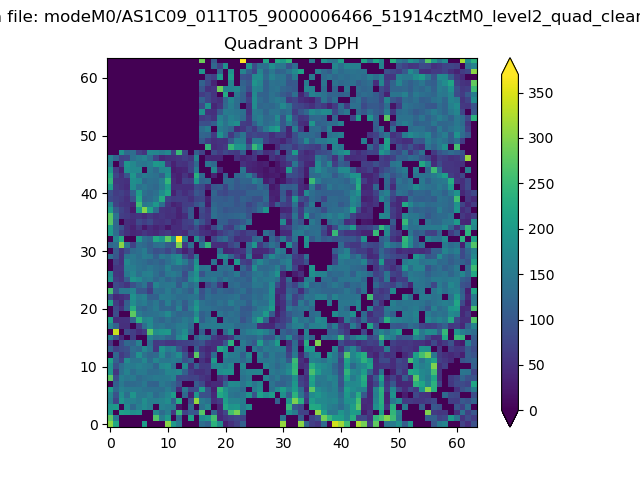 |
 |
Quadrant C |
| Plot type | Count rate plots | Images |
|---|---|---|
| Comparison with Poisson distribution Blue bars denote a histogram of data divided into 1 sec bins. Red curve is a Poisson curve with rate = median count rate of data. |
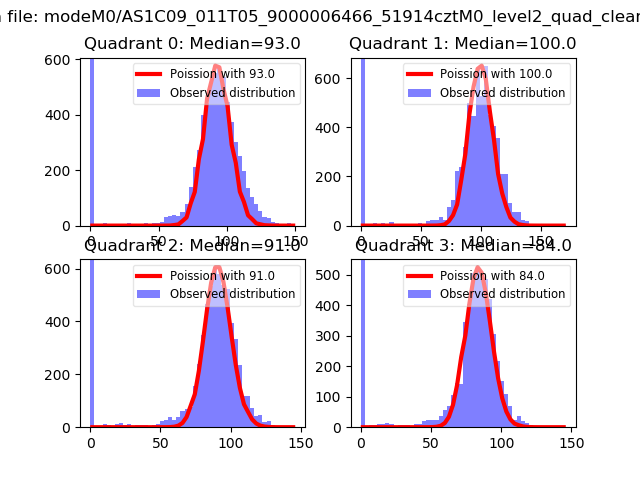 |
 |
| Quadrant-wise count rates Data is divided into 100 sec bins |
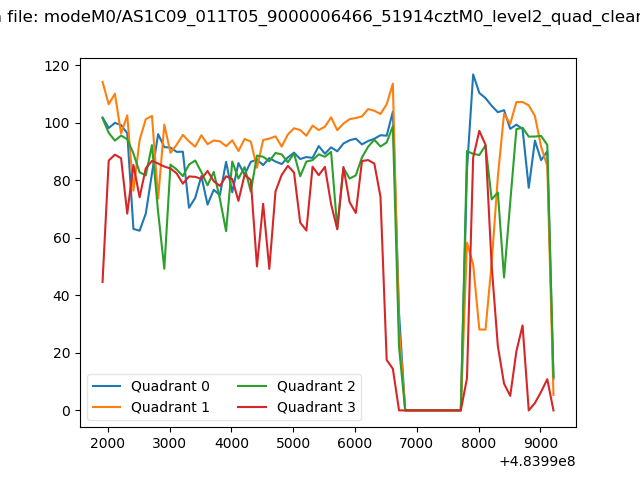 |
|
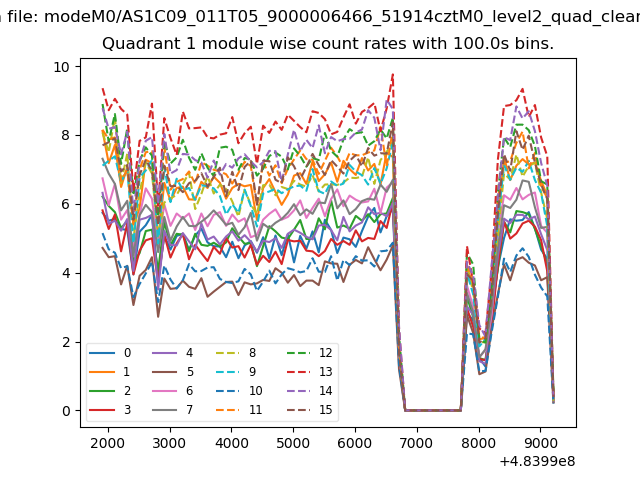
| Module-wise count rates for Quadrant A Data is divided into 100 sec bins |
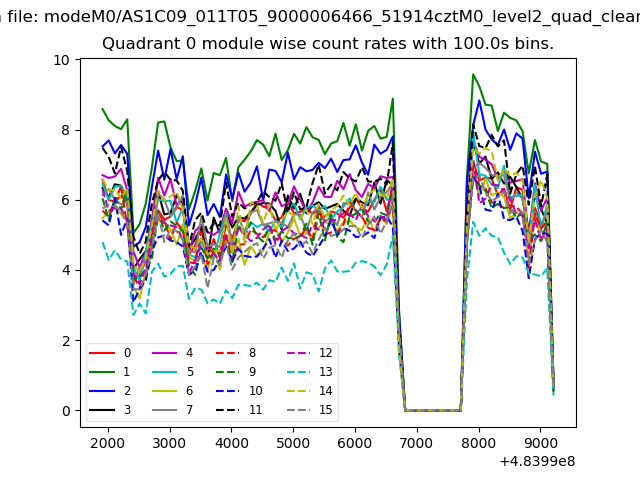 |
 |
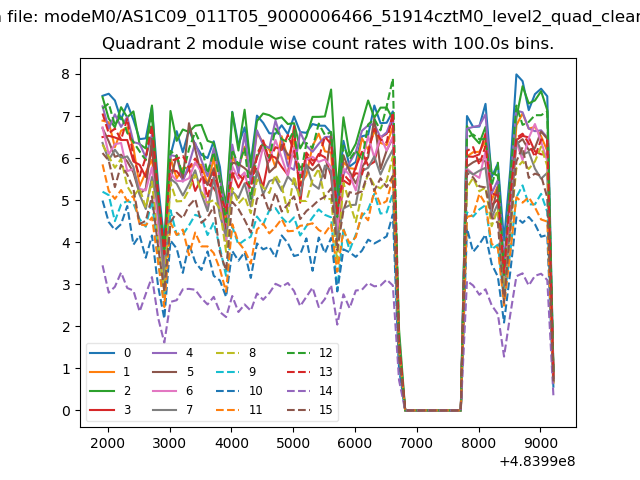
| Module-wise count rates for Quadrant B Data is divided into 100 sec bins |
 |
 |
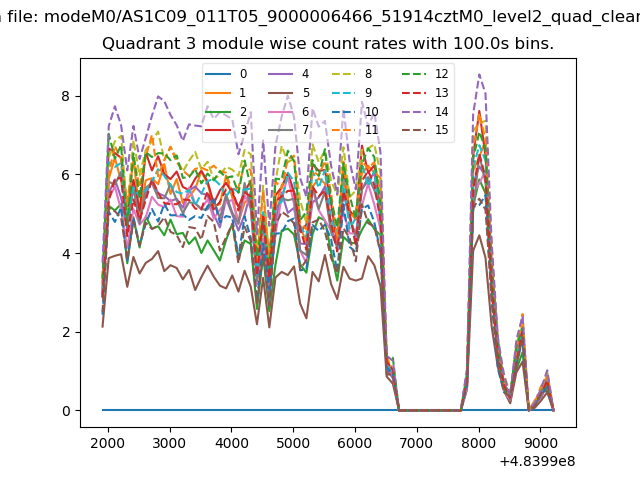
| Module-wise count rates for Quadrant C Data is divided into 100 sec bins |
 |
 |
| Module-wise count rates for Quadrant D Data is divided into 100 sec bins |
 |
 |
| Parameter | Plot |
|---|---|
| CZT HV Monitor | 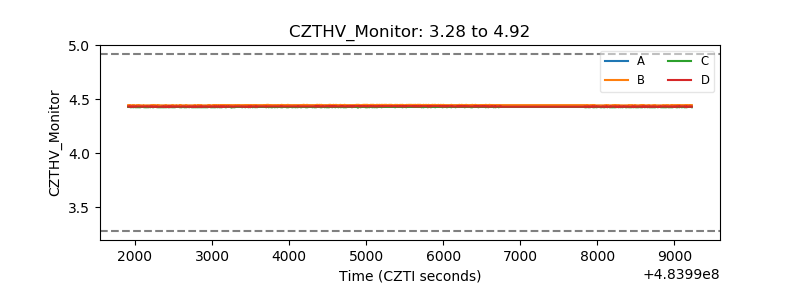 |
| D_VDD | 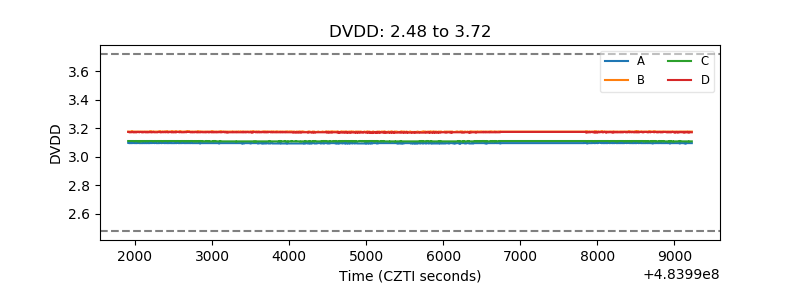 |
| Temperature 1 | 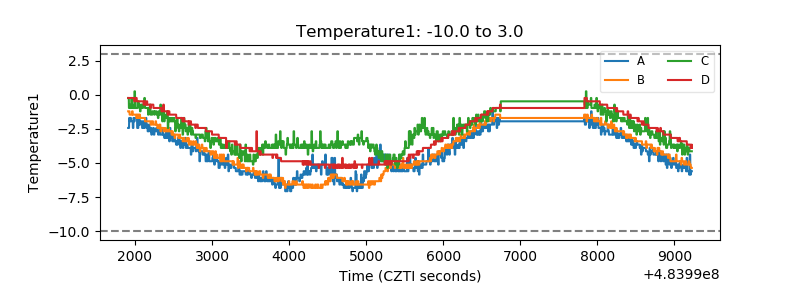 |
| Veto HV Monitor | 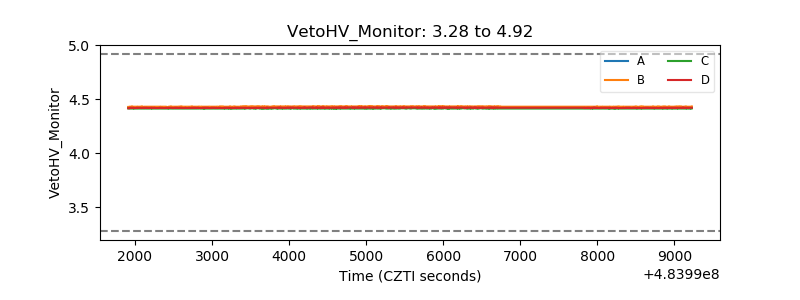 |
| Veto LLD | 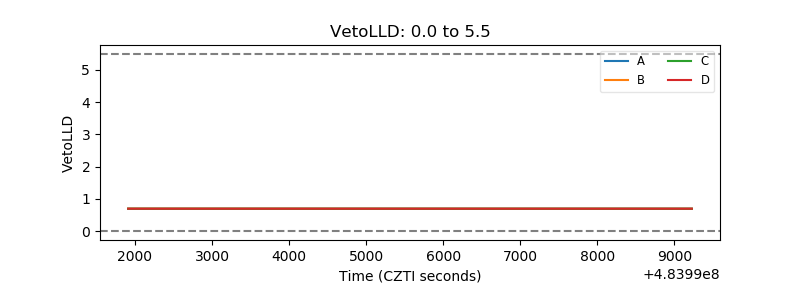 |
| Alpha Counter | 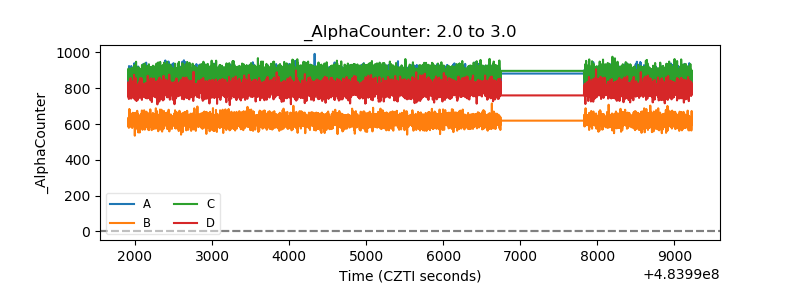 |
| _CPM_Rate | 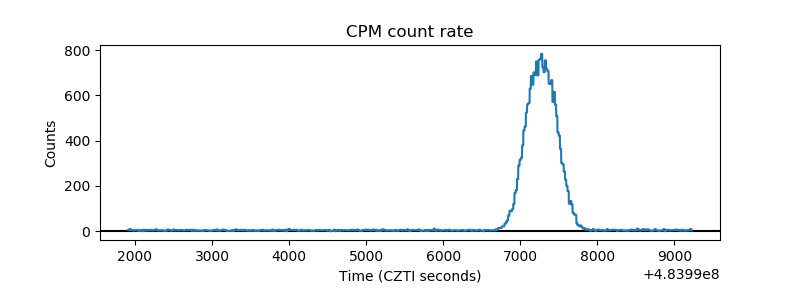 |
| CZT Counter | 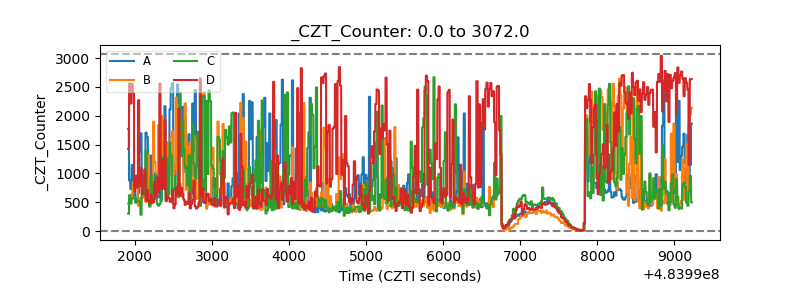 |
| +2.5 Volts monitor | 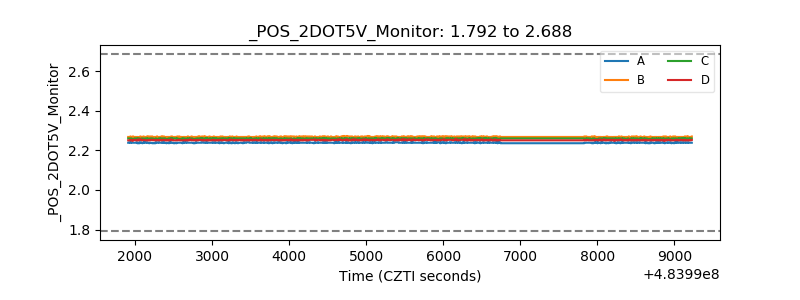 |
| +5 Volts monitor | 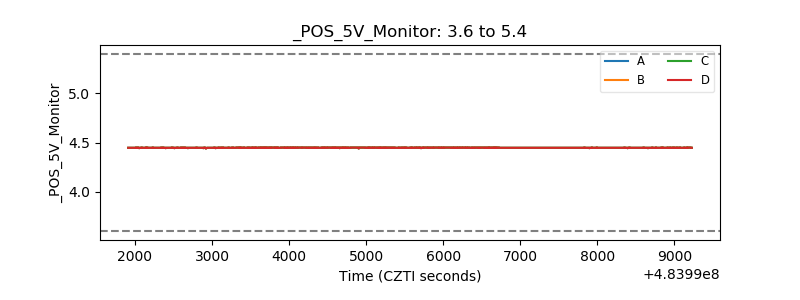 |
| _ROLL_ROT | 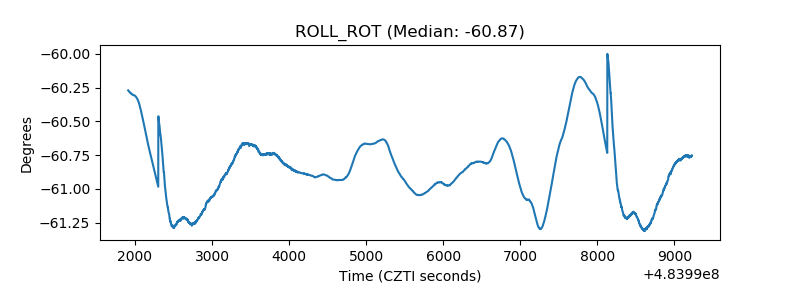 |
| _Roll_DEC | 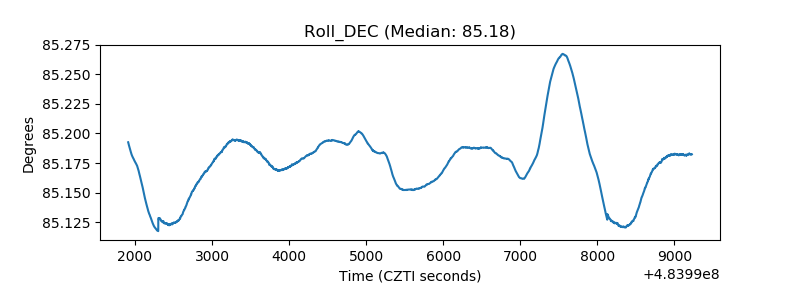 |
| _Roll_RA | 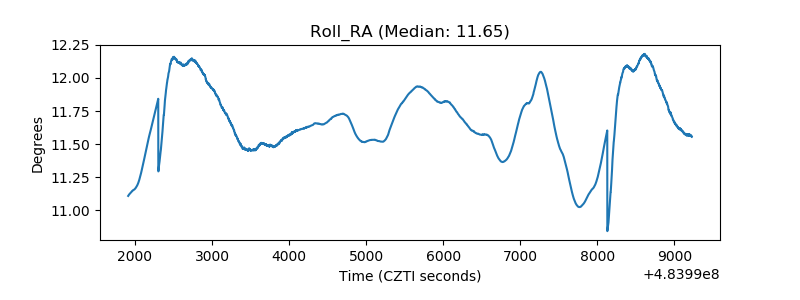 |
| Veto Counter | 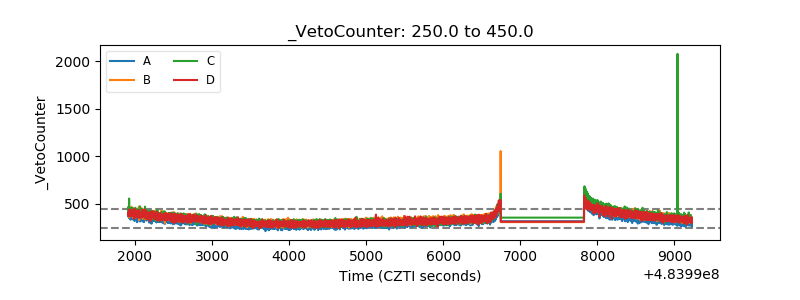 |