| Param | Original file | Final file |
|---|---|---|
| Filename | modeM0/AS1C09_011T05_9000006466_51915cztM0_level2.fits | modeM0/AS1C09_011T05_9000006466_51915cztM0_level2_quad_clean.evt |
| Size (bytes) | 832,812,480 | 76,037,760 |
| Size | 794.2 MB | 72.5 MB |
| Events in quadrant A | 5,495,903 | 589,648 |
| Events in quadrant B | 5,738,166 | 581,154 |
| Events in quadrant C | 5,660,646 | 567,566 |
| Events in quadrant D | 13,434,892 | 115,795 |
| Mode SS | |||
|---|---|---|---|
| Quadrant | BADHDUFLAG | Total packets | Discarded packets |
| A | 0 | 128 | 0 |
| B | 0 | 128 | 0 |
| C | 0 | 128 | 0 |
| D | 0 | 128 | 0 |
| Mode M0 | |||
|---|---|---|---|
| Quadrant | BADHDUFLAG | Total packets | Discarded packets |
| A | 0 | 20863 | 2 |
| B | 0 | 21616 | 2 |
| C | 0 | 21346 | 2 |
| D | 0 | 44276 | 2 |
| Mode M9 | |||
|---|---|---|---|
| Quadrant | BADHDUFLAG | Total packets | Discarded packets |
| A | 0 | 13 | 0 |
| B | 0 | 14 | 0 |
| C | 0 | 14 | 0 |
| D | 0 | 14 | 0 |
| Quadrant | Total seconds | Saturated seconds | Saturation percentage |
|---|---|---|---|
| A | 6428 | 420 | 6.533914% |
| B | 6428 | 1010 | 15.712508% |
| C | 6427 | 614 | 9.553446% |
| D | 6427 | 5279 | 82.137856% |
Noise dominated data is calculated using 1-second bins in cleaned event files. If a bin has >2000 counts, and if more than 50% of those come from <1% of pixels, then it is considered to be noise-dominated and hence unusable.
| Quadrant | # 1 sec bins | Bins with >0 counts | Bins with >2000 counts | High rate bins dominated by noise | Noise dominated (total time) | Noise dominated (detector-on time) | Marked lightcurve |
|---|---|---|---|---|---|---|---|
| A | 7563 | 6429 | 339 | 339 | 4.48% | 5.27% | 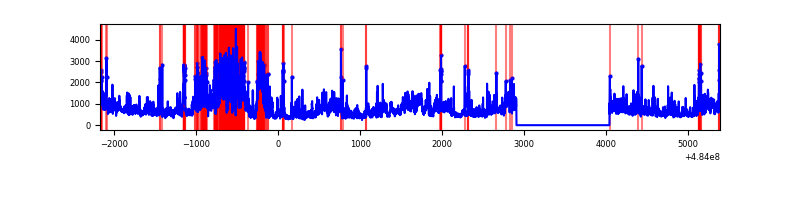 |
| B | 7563 | 6429 | 708 | 708 | 9.36% | 11.01% | 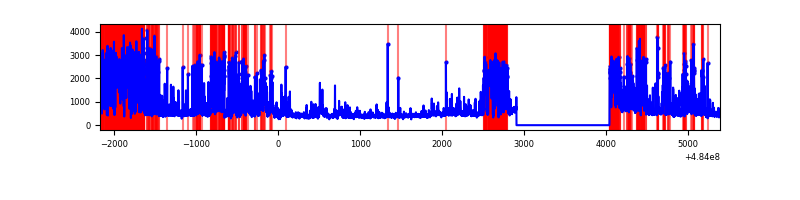 |
| C | 7562 | 6428 | 445 | 445 | 5.88% | 6.92% | 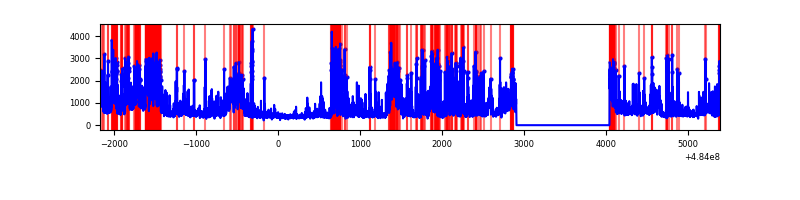 |
| D | 7561 | 6426 | 4121 | 4121 | 54.50% | 64.13% | 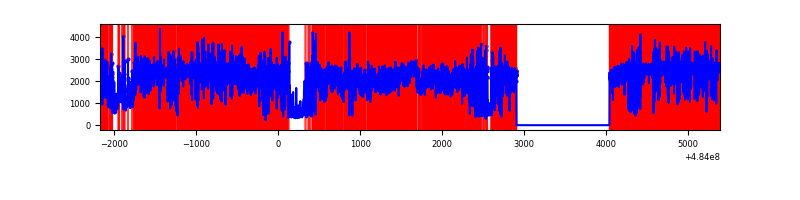 |
Top three noisy pixels from each quadrant. If the there are fewer than three noisy pixels in the level2.evt file, extra rows are filled as -1
| Pixel properties | Quadrant properties | ||||||
|---|---|---|---|---|---|---|---|
| Quadrant | DetID | PixID | Counts | Sigma | Mean | Median | Sigma |
| A | 12 | 3 | 1017812 | 6107.95 | 660 | 642 | 166.5 |
| A | 7 | 64 | 575618 | 3452.64 | 660 | 642 | 166.5 |
| A | 15 | 174 | 210415 | 1259.65 | 660 | 642 | 166.5 |
| B | 4 | 171 | 1115267 | 8228.08 | 639 | 617 | 135.5 |
| B | 5 | 32 | 906395 | 6686.24 | 639 | 617 | 135.5 |
| B | 4 | 206 | 564716 | 4164.04 | 639 | 617 | 135.5 |
| C | 15 | 158 | 1013661 | 5610.18 | 653 | 648 | 180.6 |
| C | 15 | 231 | 470173 | 2600.28 | 653 | 648 | 180.6 |
| C | 15 | 248 | 250391 | 1383.11 | 653 | 648 | 180.6 |
| D | 15 | 94 | 8963501 | 107501.35 | 266 | 252 | 83.4 |
| D | 12 | 17 | 2081109 | 24956.9 | 266 | 252 | 83.4 |
| D | 3 | 12 | 642658 | 7704.74 | 266 | 252 | 83.4 |
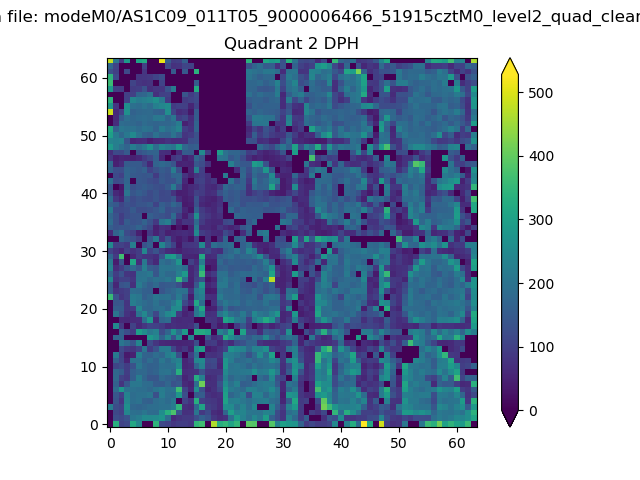
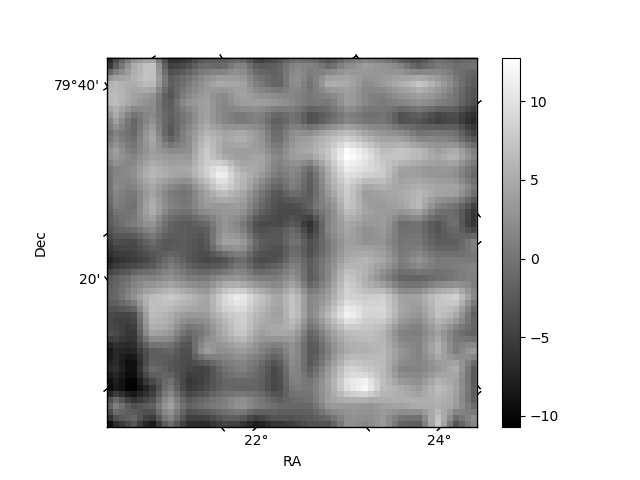
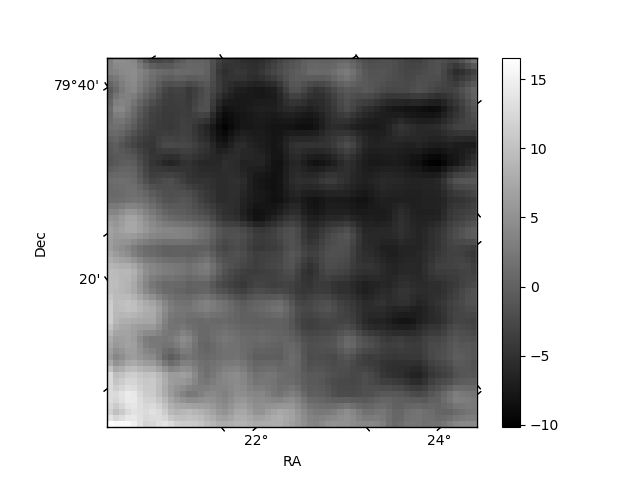
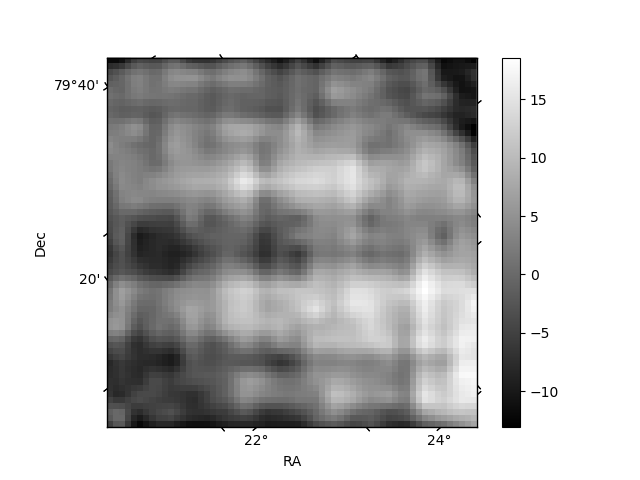
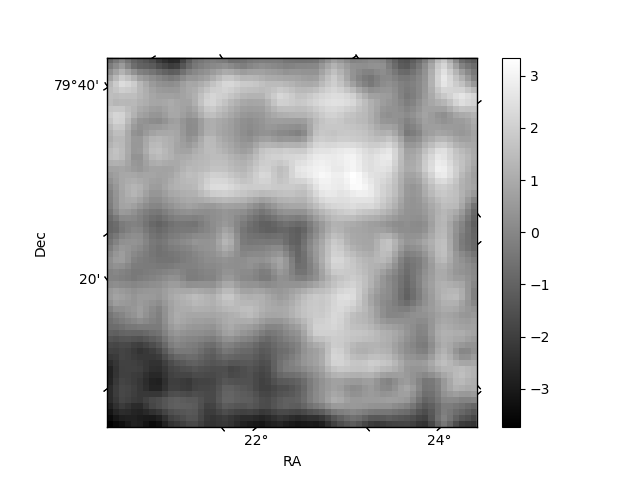
Histogram calculated using DETX and DETY for each event in the final _common_clean file
| Quadrant A | 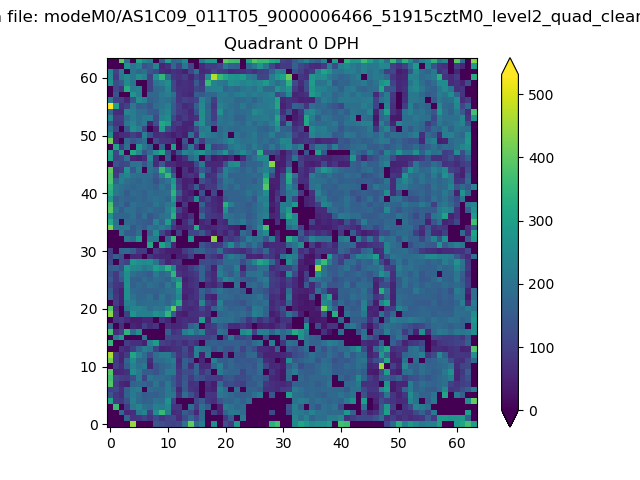 |
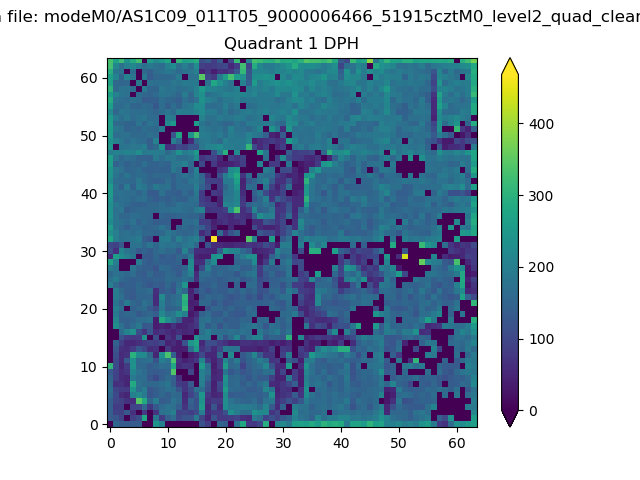 |
Quadrant B |
|---|---|---|---|
| Quadrant D | 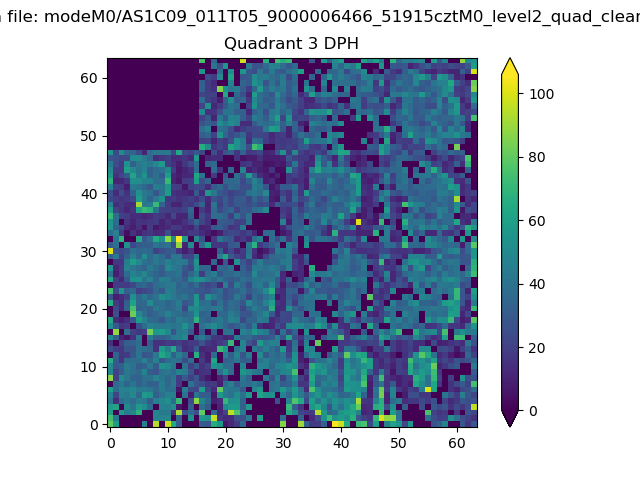 |
 |
Quadrant C |
| Plot type | Count rate plots | Images |
|---|---|---|
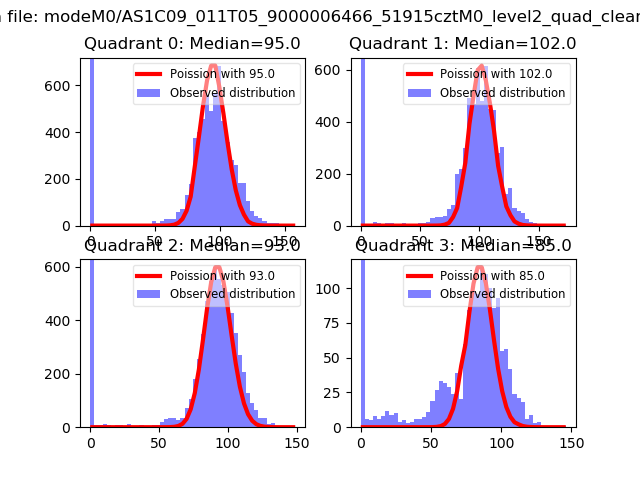
| Comparison with Poisson distribution Blue bars denote a histogram of data divided into 1 sec bins. Red curve is a Poisson curve with rate = median count rate of data. |
 |
 |
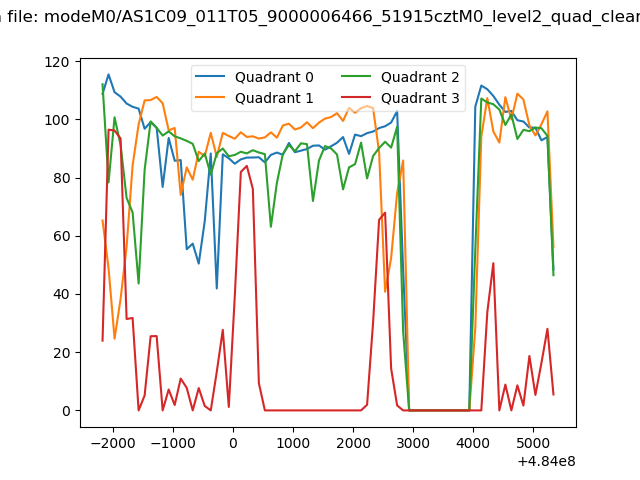
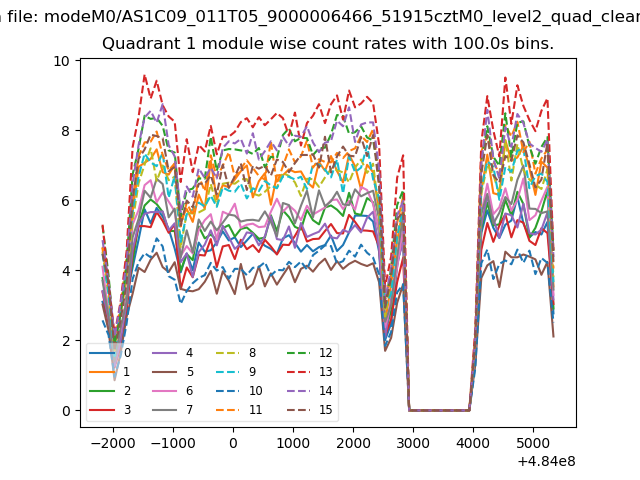
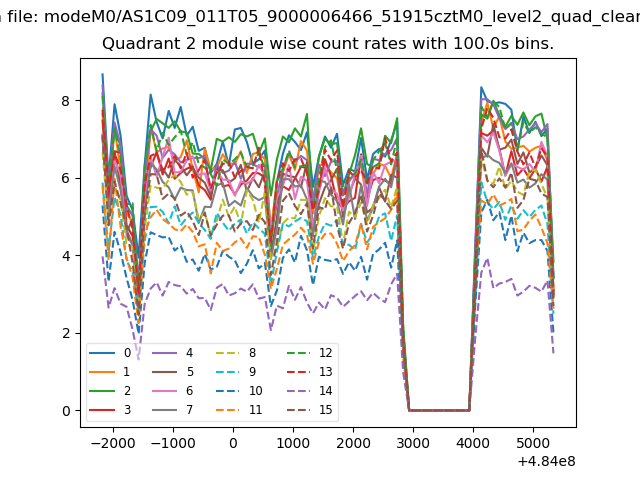
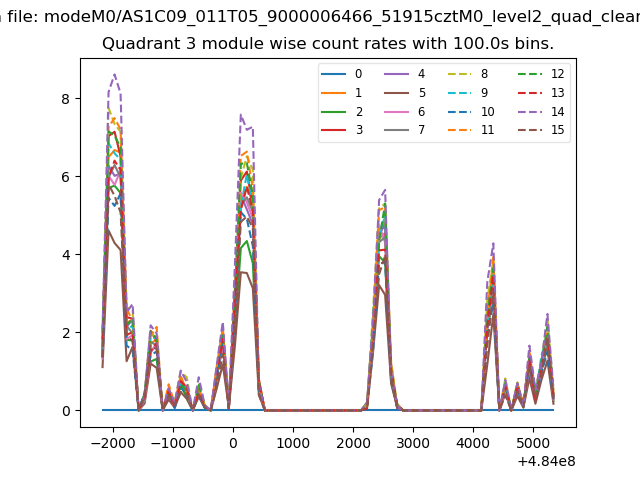
| Quadrant-wise count rates Data is divided into 100 sec bins |
 |
|
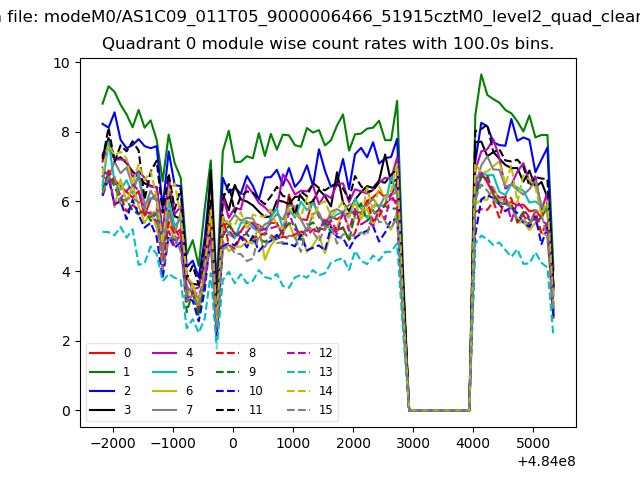
| Module-wise count rates for Quadrant A Data is divided into 100 sec bins |
 |
 |
| Module-wise count rates for Quadrant B Data is divided into 100 sec bins |
 |
 |
| Module-wise count rates for Quadrant C Data is divided into 100 sec bins |
 |
 |
| Module-wise count rates for Quadrant D Data is divided into 100 sec bins |
 |
 |
| Parameter | Plot |
|---|---|
| CZT HV Monitor | 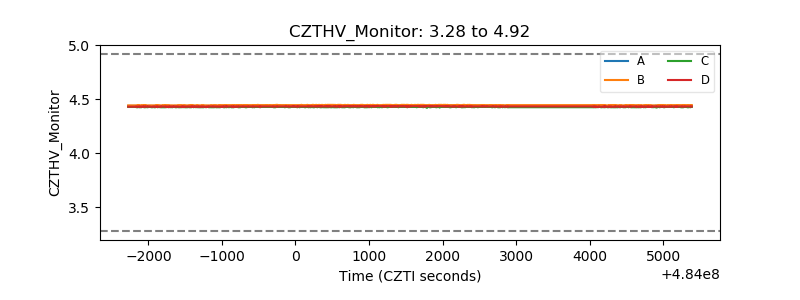 |
| D_VDD | 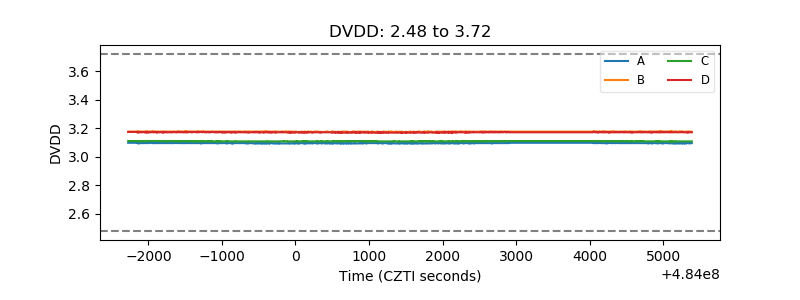 |
| Temperature 1 | 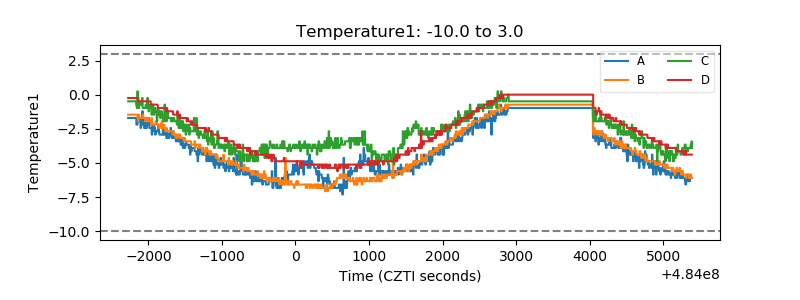 |
| Veto HV Monitor | 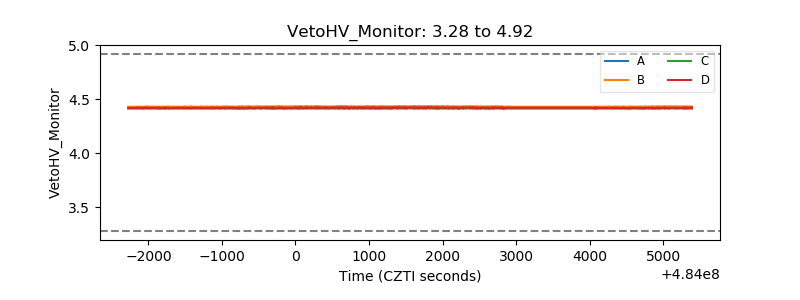 |
| Veto LLD | 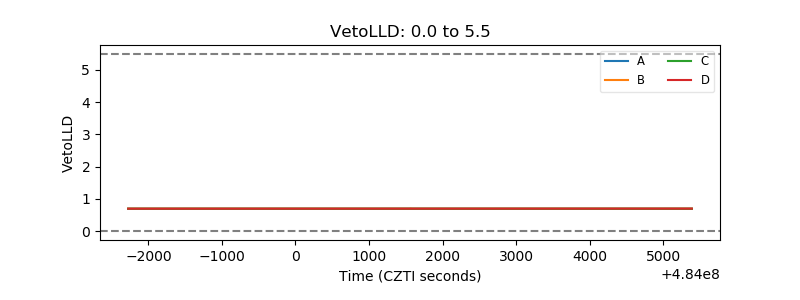 |
| Alpha Counter | 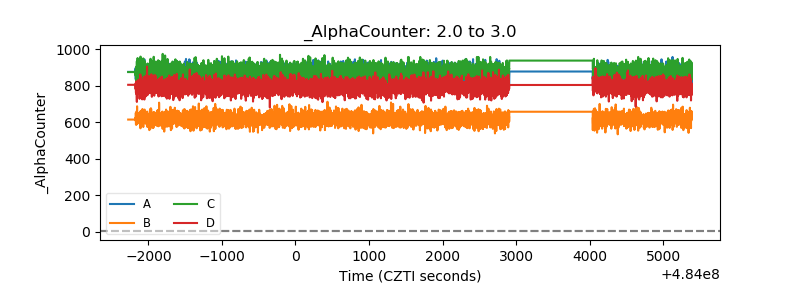 |
| _CPM_Rate | 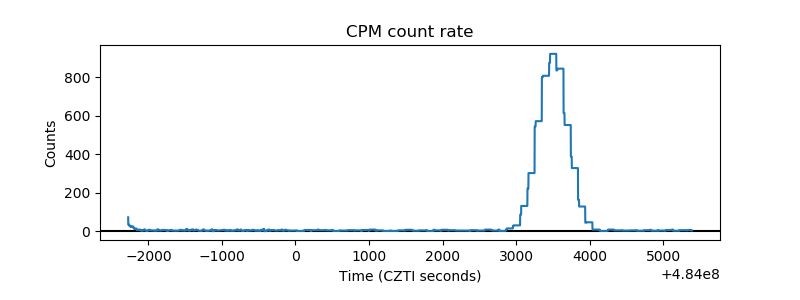 |
| CZT Counter | 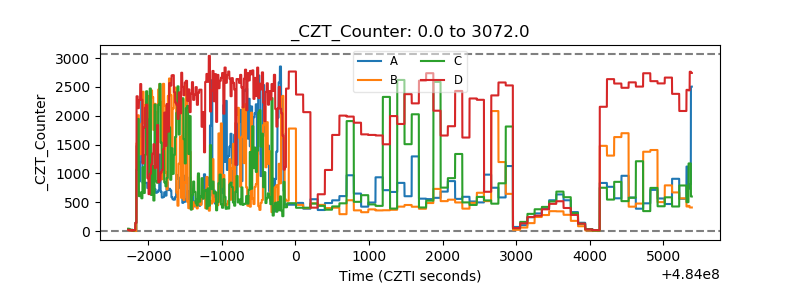 |
| +2.5 Volts monitor |  |
| +5 Volts monitor | 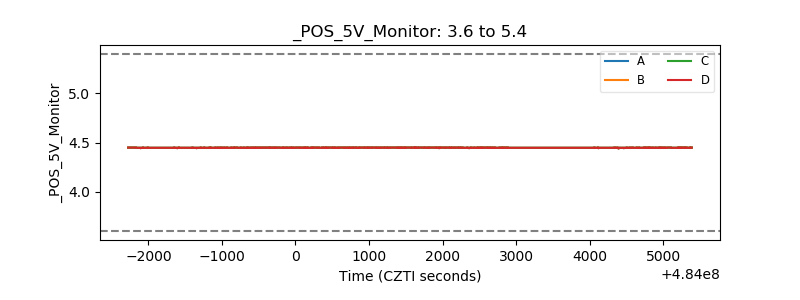 |
| _ROLL_ROT | 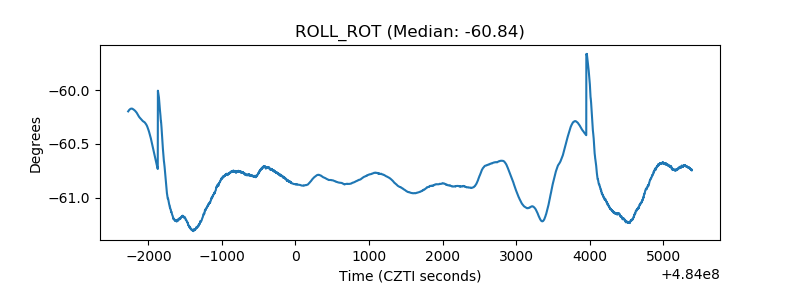 |
| _Roll_DEC | 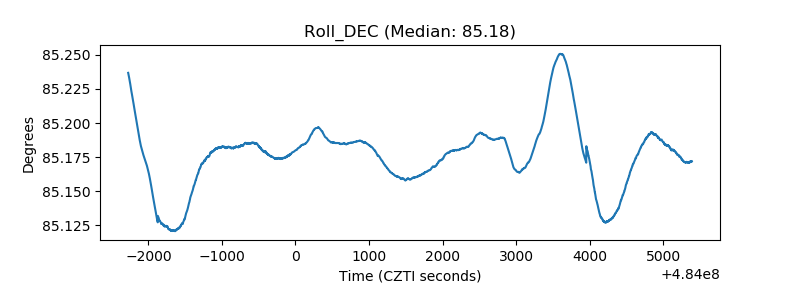 |
| _Roll_RA | 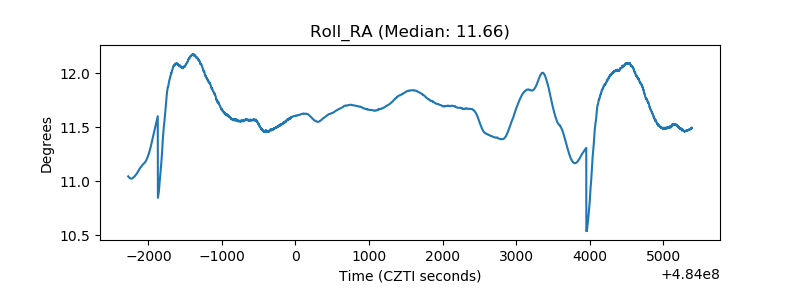 |
| Veto Counter | 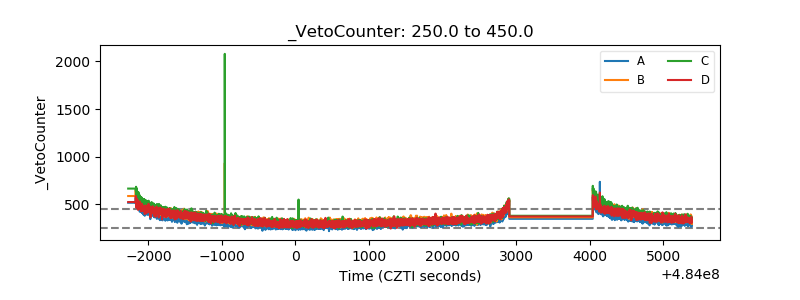 |