| Param | Original file | Final file |
|---|---|---|
| Filename | modeM0/AS1C09_011T05_9000006466_51916cztM0_level2.fits | modeM0/AS1C09_011T05_9000006466_51916cztM0_level2_quad_clean.evt |
| Size (bytes) | 742,916,160 | 83,822,400 |
| Size | 708.5 MB | 79.9 MB |
| Events in quadrant A | 4,514,005 | 599,201 |
| Events in quadrant B | 5,695,407 | 601,196 |
| Events in quadrant C | 5,666,870 | 561,000 |
| Events in quadrant D | 11,123,727 | 325,616 |
| Mode SS | |||
|---|---|---|---|
| Quadrant | BADHDUFLAG | Total packets | Discarded packets |
| A | 0 | 130 | 0 |
| B | 0 | 130 | 0 |
| C | 0 | 130 | 0 |
| D | 0 | 130 | 0 |
| Mode M0 | |||
|---|---|---|---|
| Quadrant | BADHDUFLAG | Total packets | Discarded packets |
| A | 0 | 18027 | 2 |
| B | 0 | 21524 | 2 |
| C | 0 | 21309 | 2 |
| D | 0 | 37472 | 2 |
| Mode M9 | |||
|---|---|---|---|
| Quadrant | BADHDUFLAG | Total packets | Discarded packets |
| A | 0 | 14 | 0 |
| B | 0 | 15 | 0 |
| C | 0 | 15 | 0 |
| D | 0 | 15 | 0 |
| Quadrant | Total seconds | Saturated seconds | Saturation percentage |
|---|---|---|---|
| A | 6464 | 278 | 4.300743% |
| B | 6464 | 914 | 14.139851% |
| C | 6464 | 638 | 9.870050% |
| D | 6464 | 3030 | 46.875000% |
Noise dominated data is calculated using 1-second bins in cleaned event files. If a bin has >2000 counts, and if more than 50% of those come from <1% of pixels, then it is considered to be noise-dominated and hence unusable.
| Quadrant | # 1 sec bins | Bins with >0 counts | Bins with >2000 counts | High rate bins dominated by noise | Noise dominated (total time) | Noise dominated (detector-on time) | Marked lightcurve |
|---|---|---|---|---|---|---|---|
| A | 7629 | 6466 | 167 | 167 | 2.19% | 2.58% | 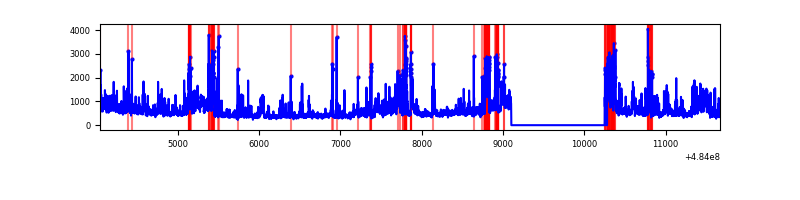 |
| B | 7629 | 6466 | 592 | 592 | 7.76% | 9.16% | 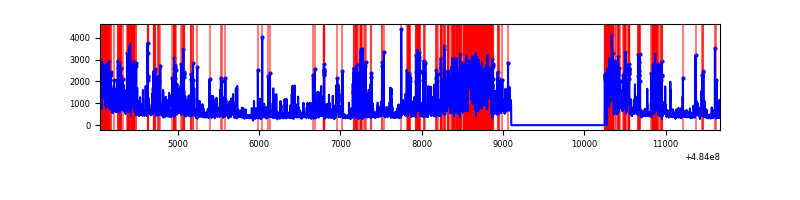 |
| C | 7629 | 6465 | 515 | 515 | 6.75% | 7.97% | 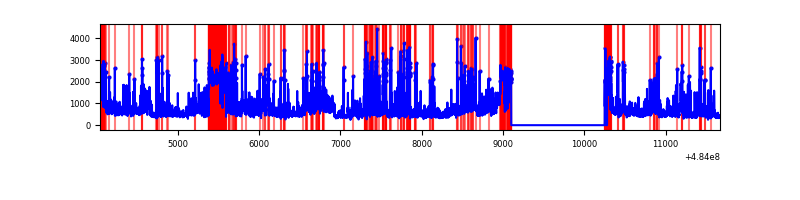 |
| D | 7629 | 6466 | 2843 | 2843 | 37.27% | 43.97% | 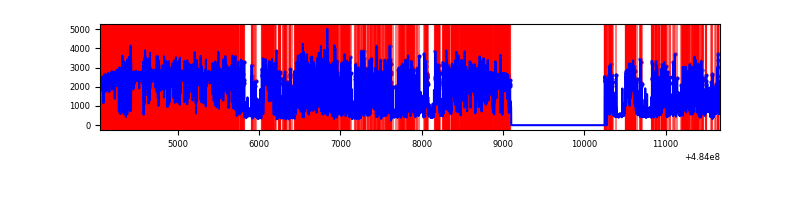 |
Top three noisy pixels from each quadrant. If the there are fewer than three noisy pixels in the level2.evt file, extra rows are filled as -1
| Pixel properties | Quadrant properties | ||||||
|---|---|---|---|---|---|---|---|
| Quadrant | DetID | PixID | Counts | Sigma | Mean | Median | Sigma |
| A | 7 | 64 | 565751 | 3395.33 | 664 | 649 | 166.4 |
| A | 12 | 3 | 415845 | 2494.64 | 664 | 649 | 166.4 |
| A | 15 | 174 | 130523 | 780.33 | 664 | 649 | 166.4 |
| B | 4 | 206 | 1237882 | 9092.15 | 643 | 622 | 136.1 |
| B | 4 | 171 | 760932 | 5587.23 | 643 | 622 | 136.1 |
| B | 12 | 32 | 530743 | 3895.66 | 643 | 622 | 136.1 |
| C | 10 | 22 | 790798 | 4469.33 | 638 | 633 | 176.8 |
| C | 15 | 158 | 337940 | 1907.88 | 638 | 633 | 176.8 |
| C | 15 | 248 | 331311 | 1870.38 | 638 | 633 | 176.8 |
| D | 12 | 17 | 4744744 | 31201.77 | 481 | 462 | 152.1 |
| D | 15 | 94 | 2033904 | 13373.36 | 481 | 462 | 152.1 |
| D | 2 | 172 | 1195858 | 7861.77 | 481 | 462 | 152.1 |
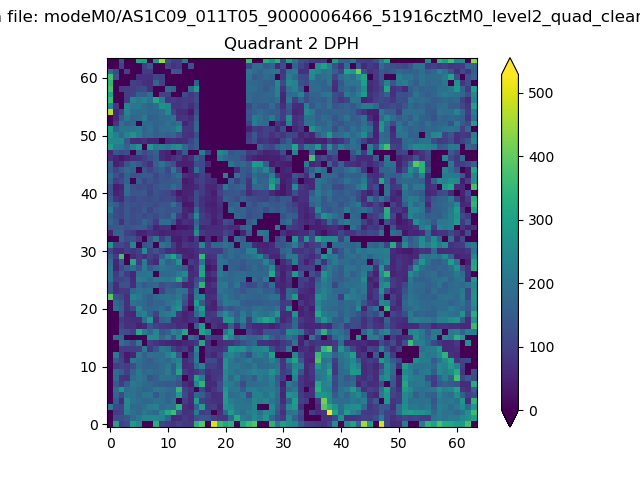
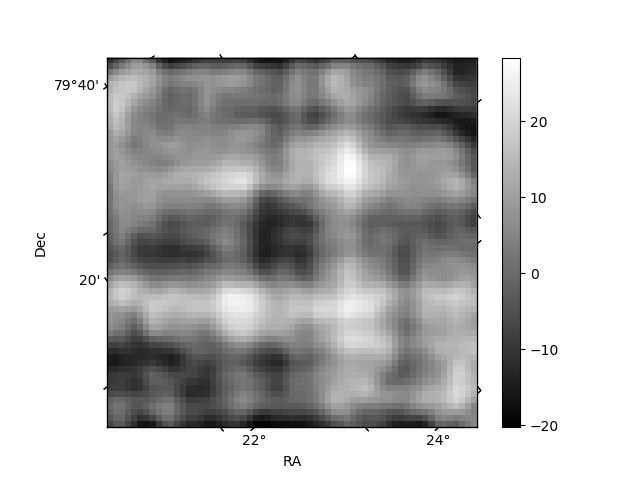
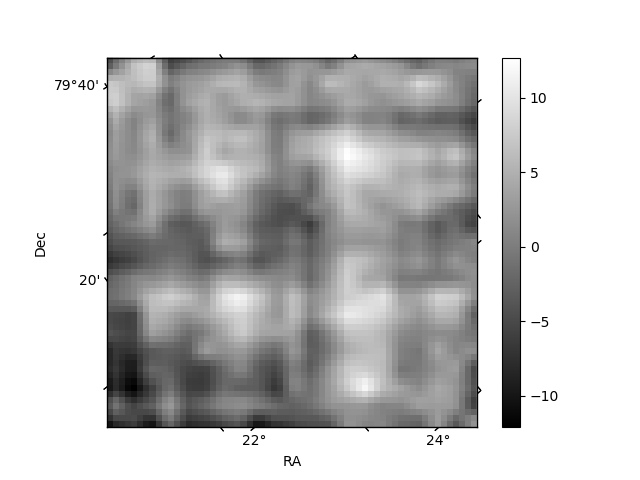
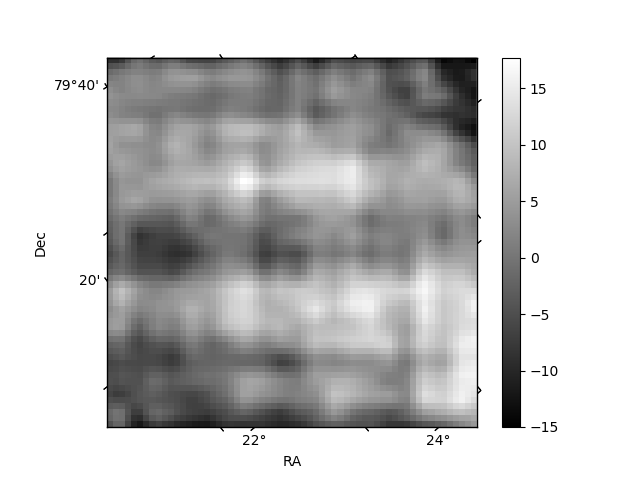
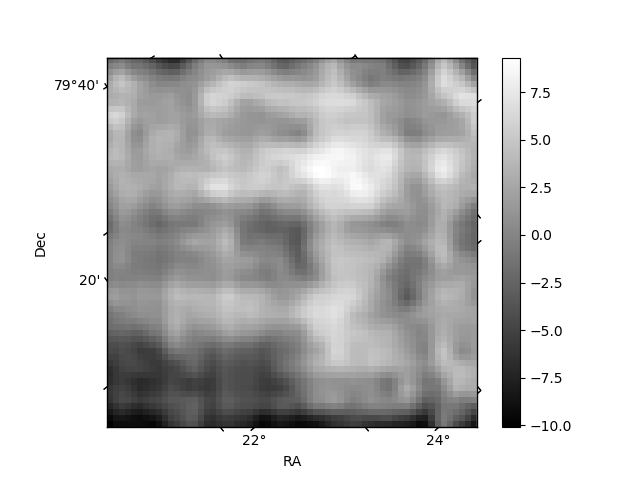
Histogram calculated using DETX and DETY for each event in the final _common_clean file
| Quadrant A | 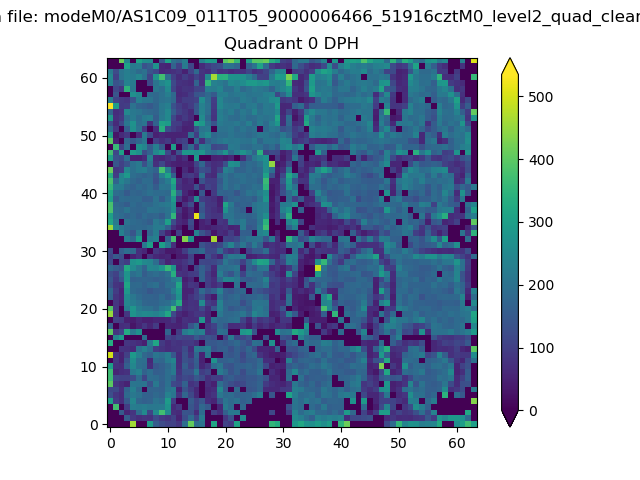 |
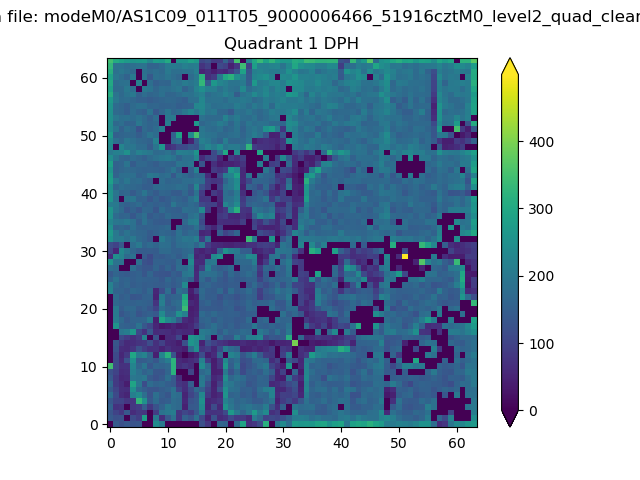 |
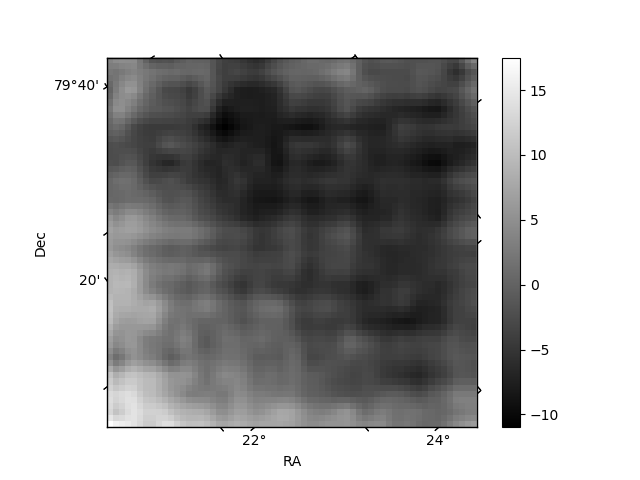
Quadrant B |
|---|---|---|---|
| Quadrant D | 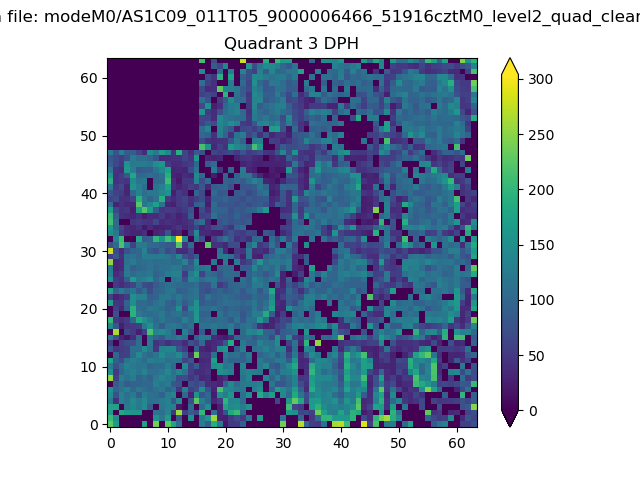 |
 |
Quadrant C |
| Plot type | Count rate plots | Images |
|---|---|---|
| Comparison with Poisson distribution Blue bars denote a histogram of data divided into 1 sec bins. Red curve is a Poisson curve with rate = median count rate of data. |
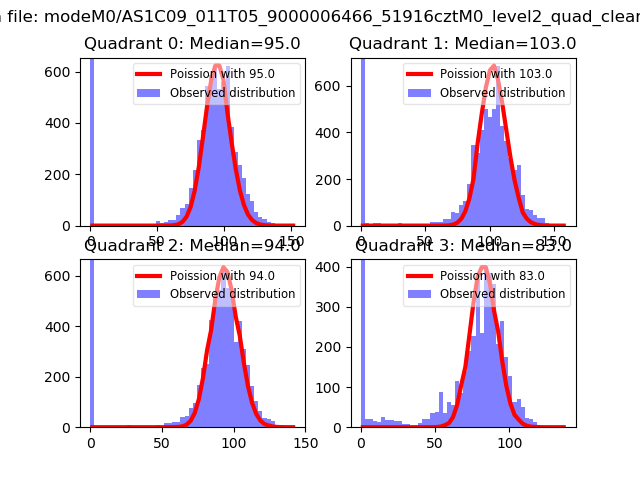 |
 |
| Quadrant-wise count rates Data is divided into 100 sec bins |
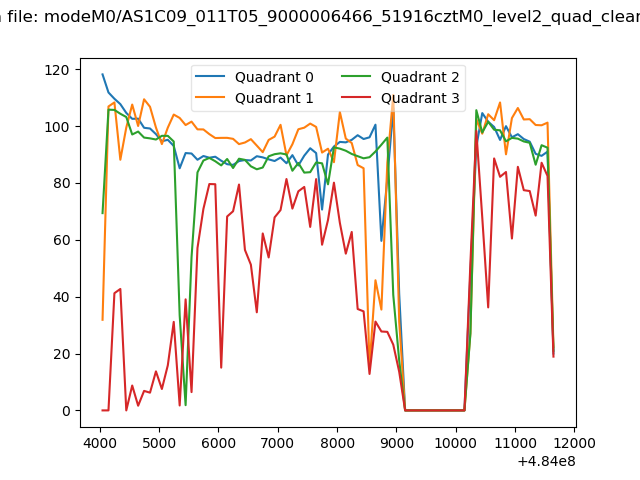 |
|
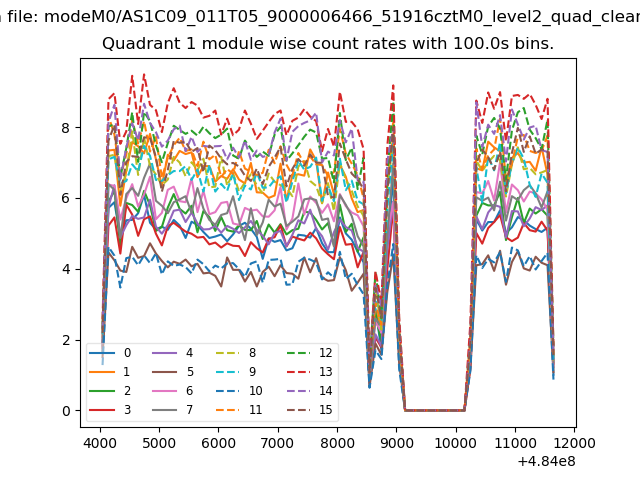
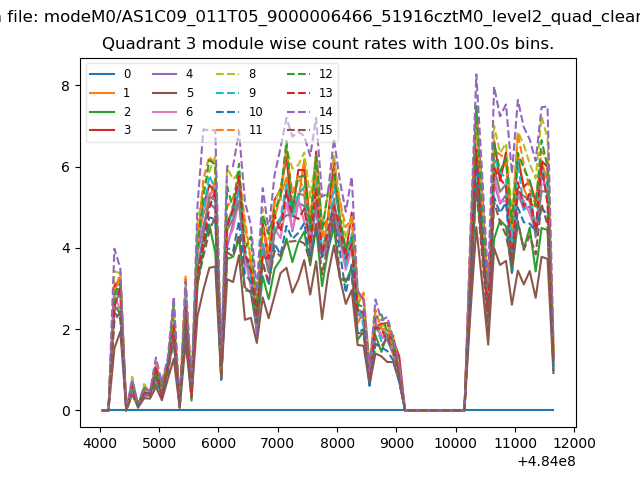
| Module-wise count rates for Quadrant A Data is divided into 100 sec bins |
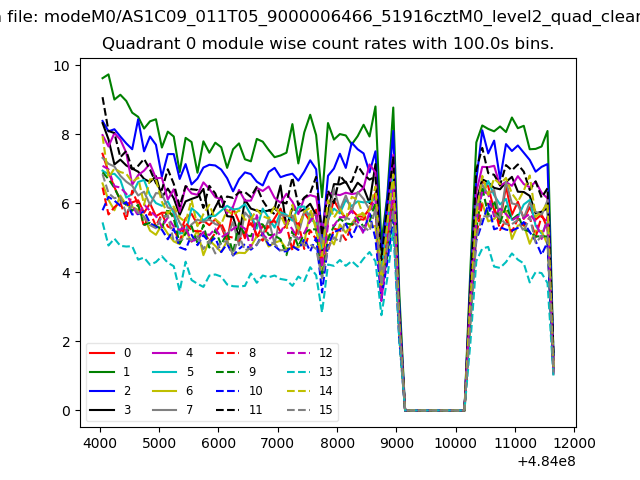 |
 |
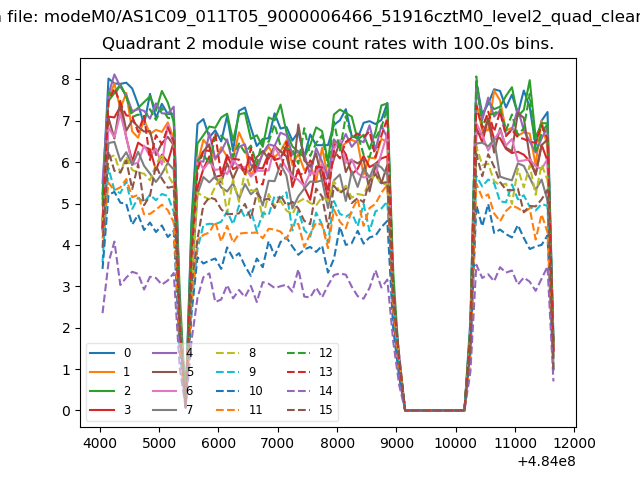
| Module-wise count rates for Quadrant B Data is divided into 100 sec bins |
 |
 |
| Module-wise count rates for Quadrant C Data is divided into 100 sec bins |
 |
 |
| Module-wise count rates for Quadrant D Data is divided into 100 sec bins |
 |
 |
| Parameter | Plot |
|---|---|
| CZT HV Monitor | 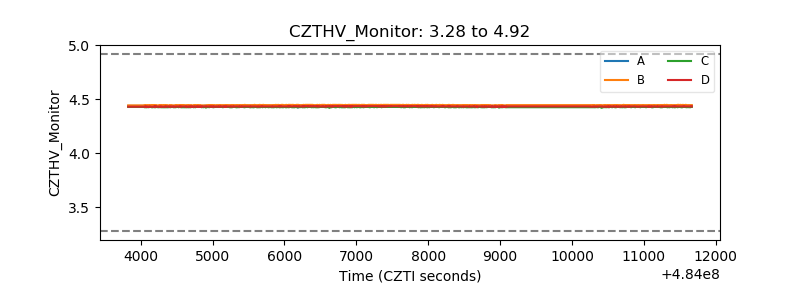 |
| D_VDD | 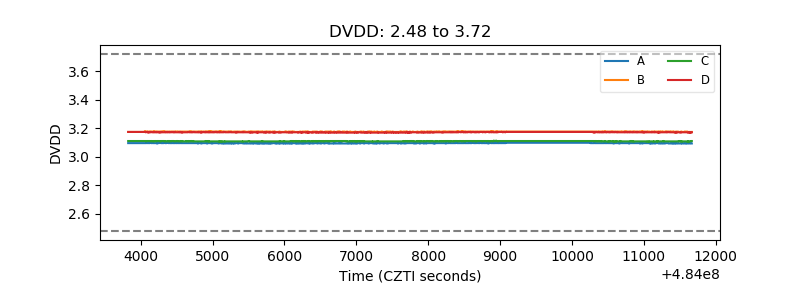 |
| Temperature 1 | 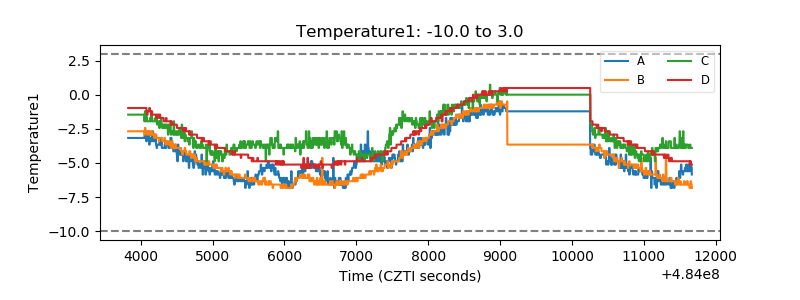 |
| Veto HV Monitor | 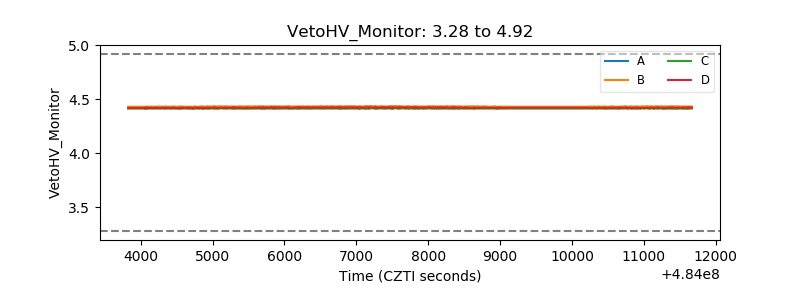 |
| Veto LLD | 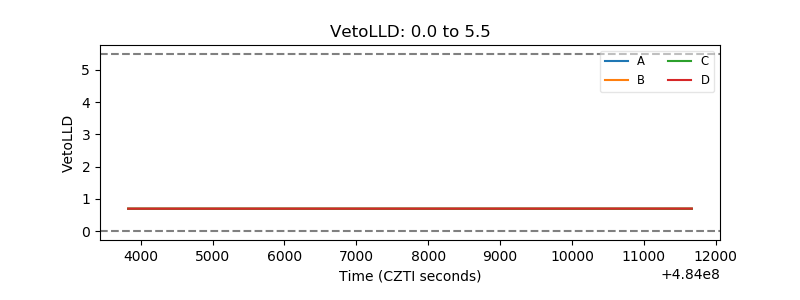 |
| Alpha Counter | 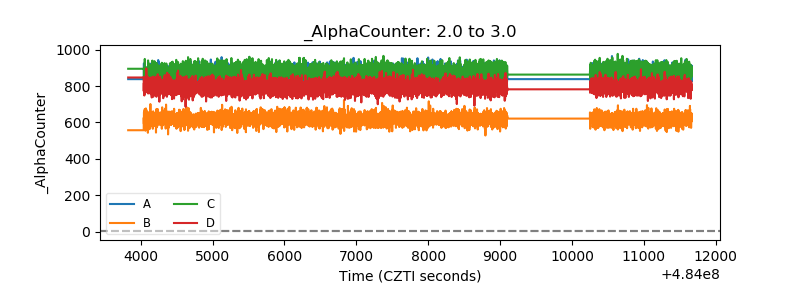 |
| _CPM_Rate | 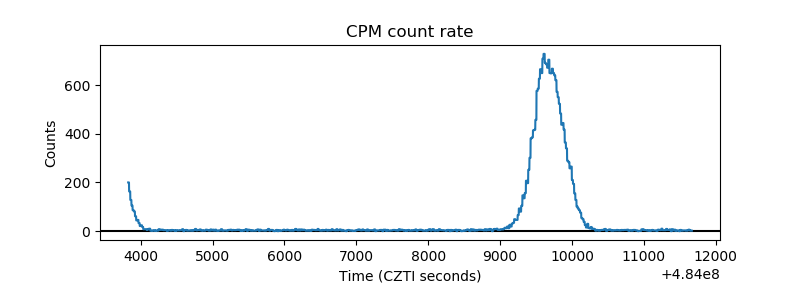 |
| CZT Counter | 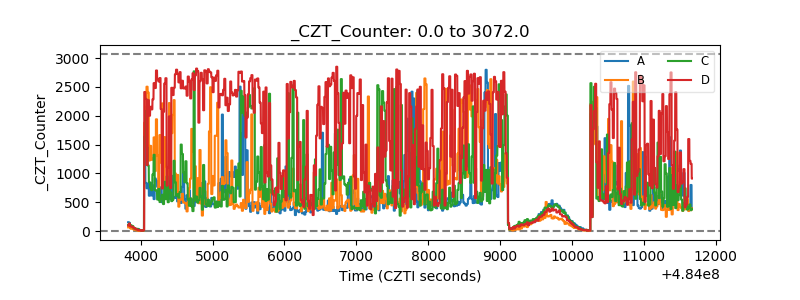 |
| +2.5 Volts monitor | 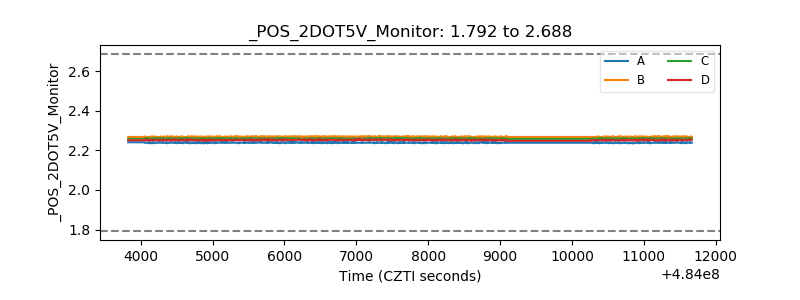 |
| +5 Volts monitor | 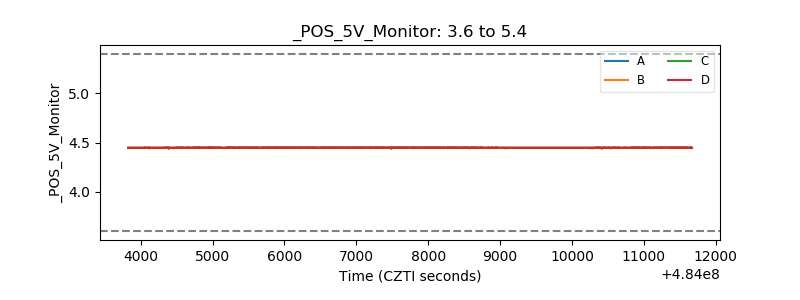 |
| _ROLL_ROT | 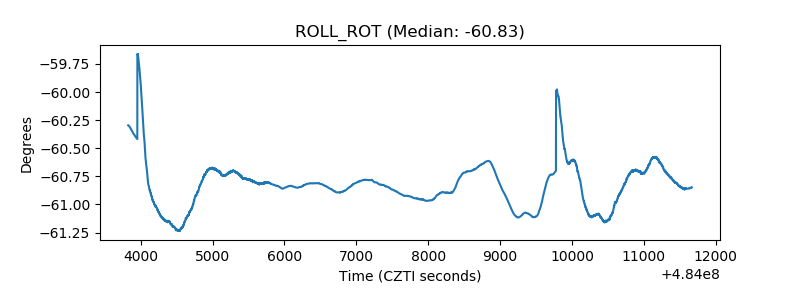 |
| _Roll_DEC | 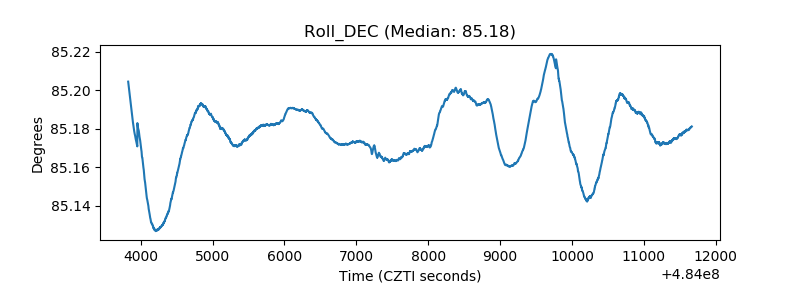 |
| _Roll_RA | 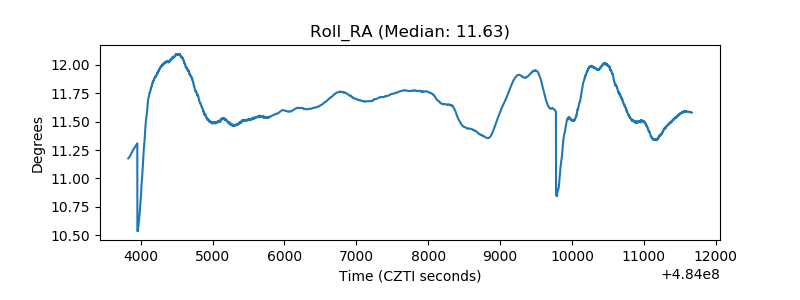 |
| Veto Counter | 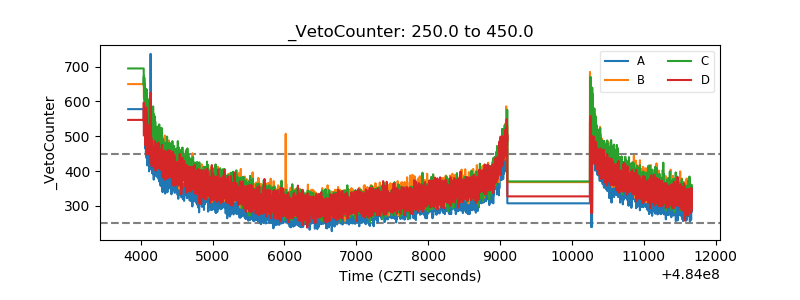 |