| Param | Original file | Final file |
|---|---|---|
| Filename | modeM0/AS1C09_011T05_9000006466_51917cztM0_level2.fits | modeM0/AS1C09_011T05_9000006466_51917cztM0_level2_quad_clean.evt |
| Size (bytes) | 731,203,200 | 91,344,960 |
| Size | 697.3 MB | 87.1 MB |
| Events in quadrant A | 7,235,003 | 587,099 |
| Events in quadrant B | 5,792,155 | 640,108 |
| Events in quadrant C | 4,582,897 | 614,760 |
| Events in quadrant D | 8,927,163 | 446,134 |
| Mode SS | |||
|---|---|---|---|
| Quadrant | BADHDUFLAG | Total packets | Discarded packets |
| A | 0 | 142 | 0 |
| B | 0 | 142 | 0 |
| C | 0 | 142 | 0 |
| D | 0 | 142 | 0 |
| Mode M0 | |||
|---|---|---|---|
| Quadrant | BADHDUFLAG | Total packets | Discarded packets |
| A | 0 | 26317 | 2 |
| B | 0 | 22066 | 2 |
| C | 0 | 18607 | 2 |
| D | 0 | 31310 | 2 |
| Mode M9 | |||
|---|---|---|---|
| Quadrant | BADHDUFLAG | Total packets | Discarded packets |
| A | 0 | 23 | 0 |
| B | 0 | 23 | 0 |
| C | 0 | 23 | 0 |
| D | 0 | 23 | 0 |
| Quadrant | Total seconds | Saturated seconds | Saturation percentage |
|---|---|---|---|
| A | 6846 | 768 | 11.218230% |
| B | 6847 | 798 | 11.654739% |
| C | 6847 | 305 | 4.454506% |
| D | 6847 | 1866 | 27.252811% |
Noise dominated data is calculated using 1-second bins in cleaned event files. If a bin has >2000 counts, and if more than 50% of those come from <1% of pixels, then it is considered to be noise-dominated and hence unusable.
| Quadrant | # 1 sec bins | Bins with >0 counts | Bins with >2000 counts | High rate bins dominated by noise | Noise dominated (total time) | Noise dominated (detector-on time) | Marked lightcurve |
|---|---|---|---|---|---|---|---|
| A | 9106 | 6849 | 584 | 584 | 6.41% | 8.53% | 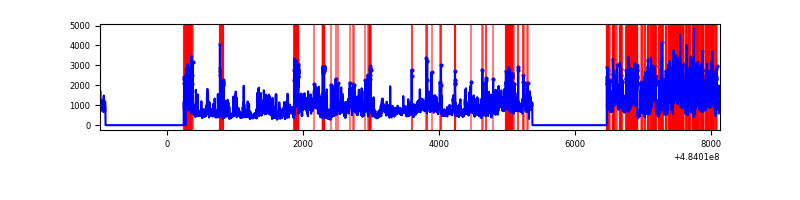 |
| B | 9107 | 6849 | 528 | 528 | 5.80% | 7.71% | 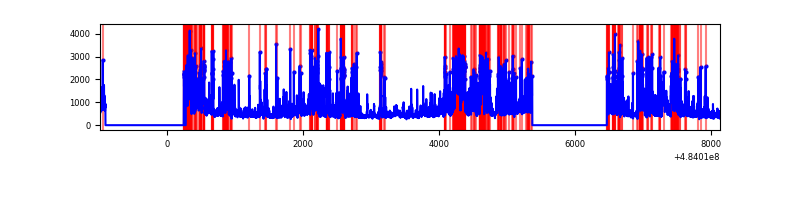 |
| C | 9107 | 6849 | 205 | 205 | 2.25% | 2.99% | 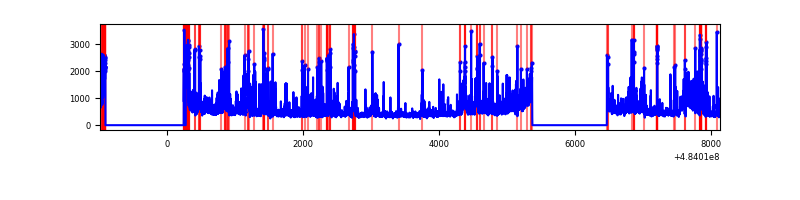 |
| D | 9107 | 6849 | 1491 | 1491 | 16.37% | 21.77% | 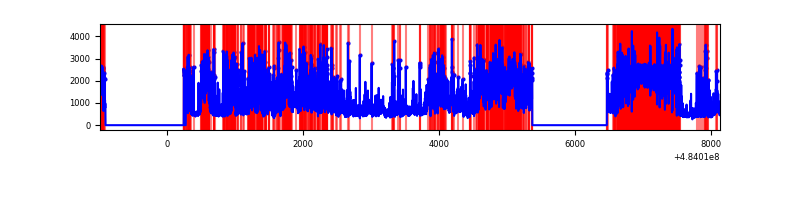 |
Top three noisy pixels from each quadrant. If the there are fewer than three noisy pixels in the level2.evt file, extra rows are filled as -1
| Pixel properties | Quadrant properties | ||||||
|---|---|---|---|---|---|---|---|
| Quadrant | DetID | PixID | Counts | Sigma | Mean | Median | Sigma |
| A | 12 | 3 | 1773974 | 10427.13 | 682 | 667 | 170.1 |
| A | 7 | 64 | 709252 | 4166.51 | 682 | 667 | 170.1 |
| A | 4 | 249 | 532440 | 3126.85 | 682 | 667 | 170.1 |
| B | 4 | 206 | 1831536 | 12615.4 | 685 | 661 | 145.1 |
| B | 12 | 32 | 295568 | 2032.02 | 685 | 661 | 145.1 |
| B | 4 | 171 | 266496 | 1831.7 | 685 | 661 | 145.1 |
| C | 15 | 248 | 245475 | 1285.43 | 686 | 680 | 190.4 |
| C | 15 | 158 | 228908 | 1198.44 | 686 | 680 | 190.4 |
| C | 13 | 3 | 170998 | 894.35 | 686 | 680 | 190.4 |
| D | 15 | 94 | 1903621 | 11088.3 | 579 | 555 | 171.6 |
| D | 12 | 17 | 1627518 | 9479.58 | 579 | 555 | 171.6 |
| D | 2 | 172 | 1336863 | 7786.06 | 579 | 555 | 171.6 |
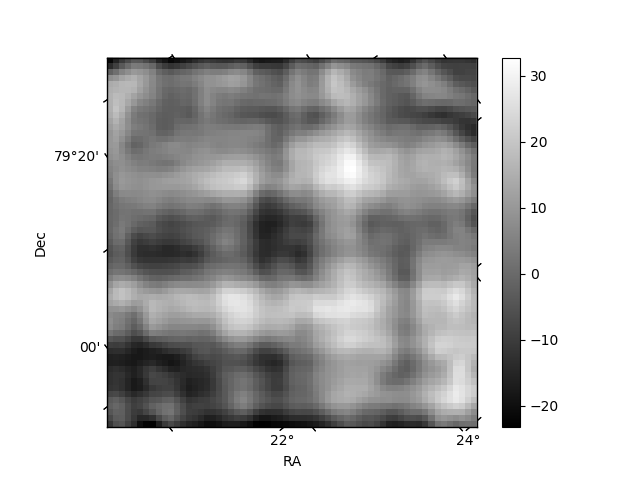
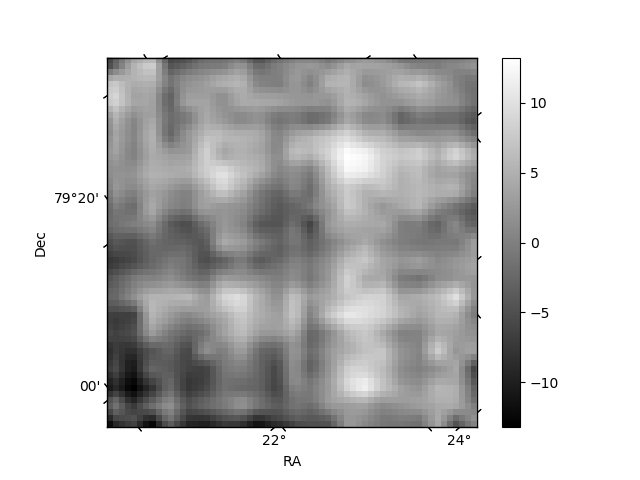
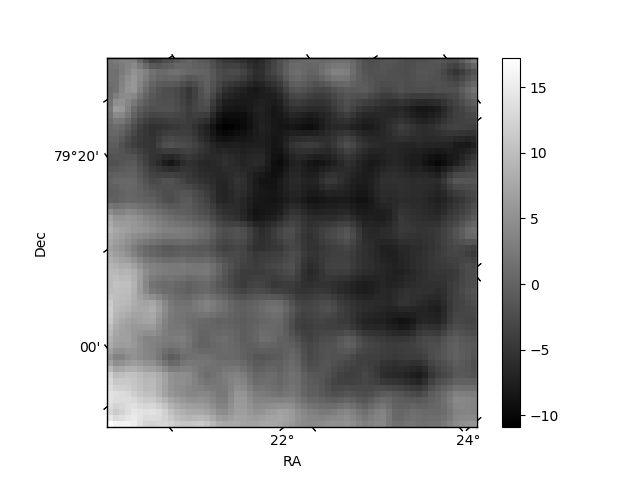
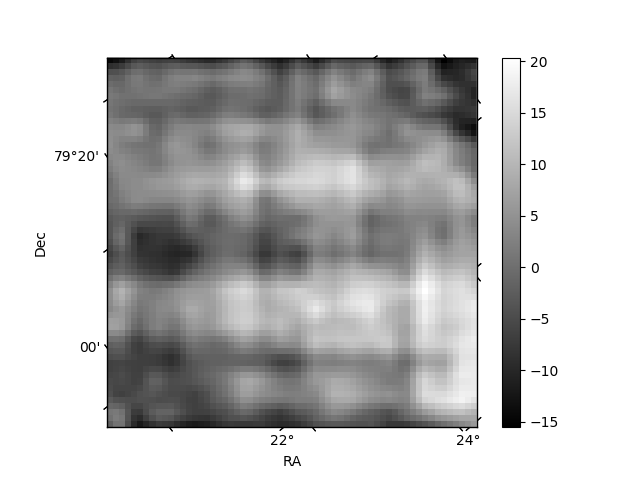
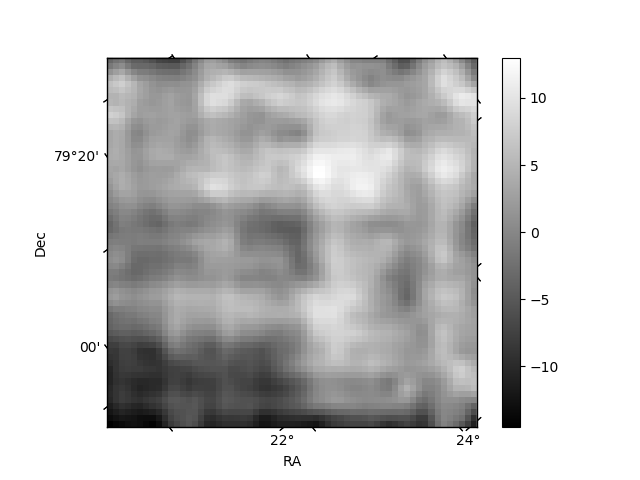
Histogram calculated using DETX and DETY for each event in the final _common_clean file
| Quadrant A | 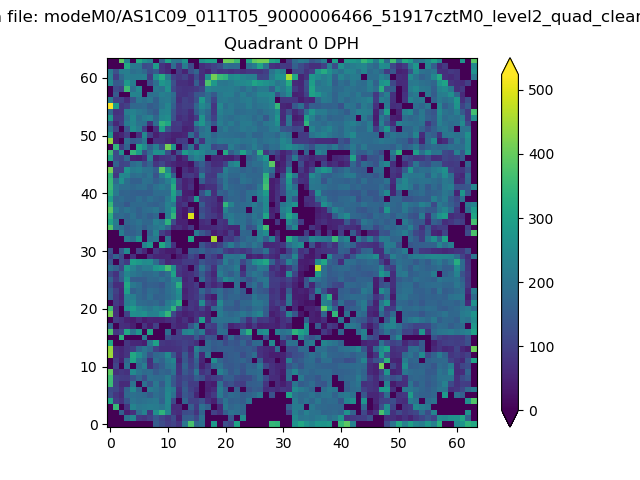 |
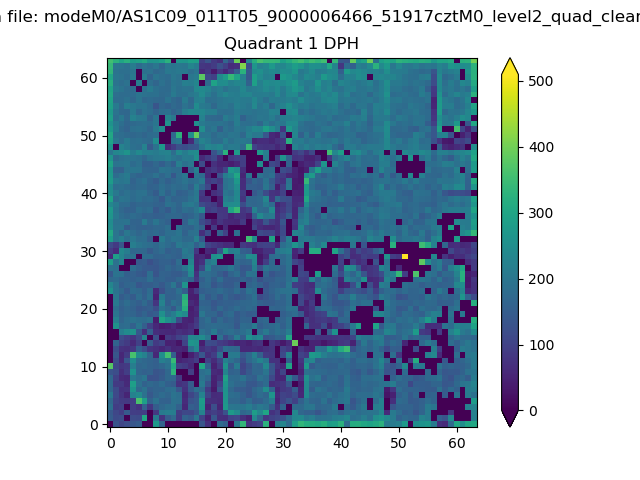 |
Quadrant B |
|---|---|---|---|
| Quadrant D | 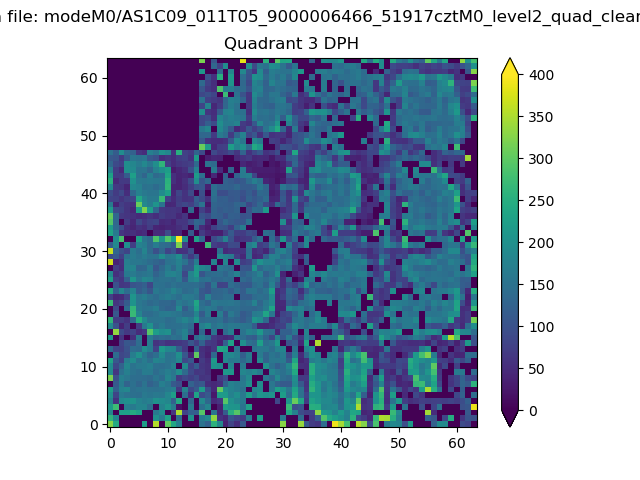 |
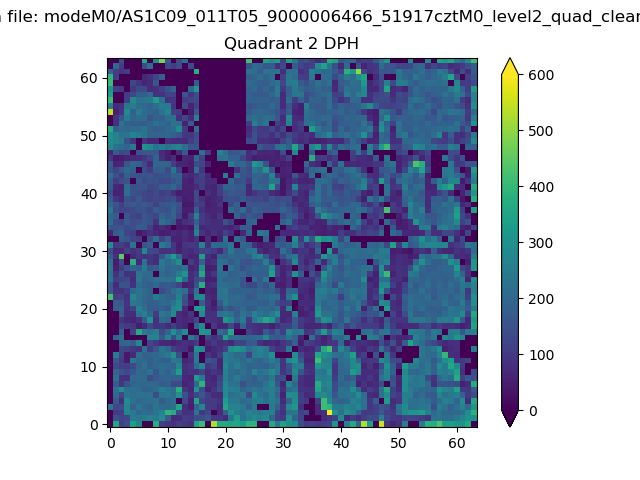 |
Quadrant C |
| Plot type | Count rate plots | Images |
|---|---|---|
| Comparison with Poisson distribution Blue bars denote a histogram of data divided into 1 sec bins. Red curve is a Poisson curve with rate = median count rate of data. |
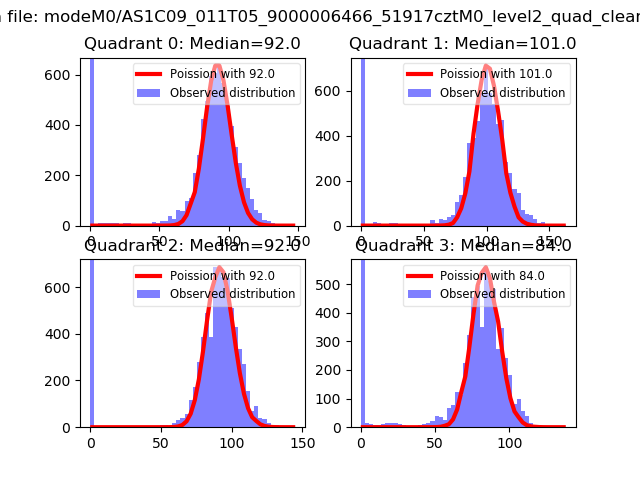 |
 |
| Quadrant-wise count rates Data is divided into 100 sec bins |
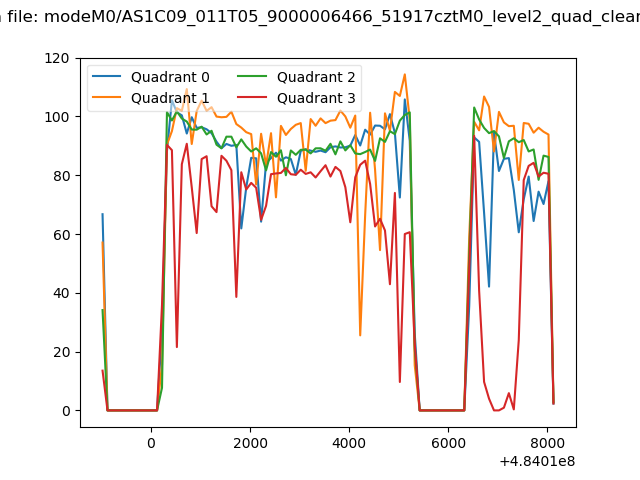 |
|
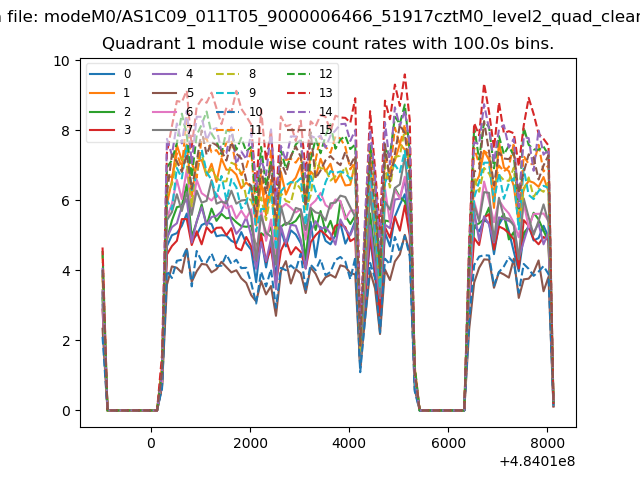
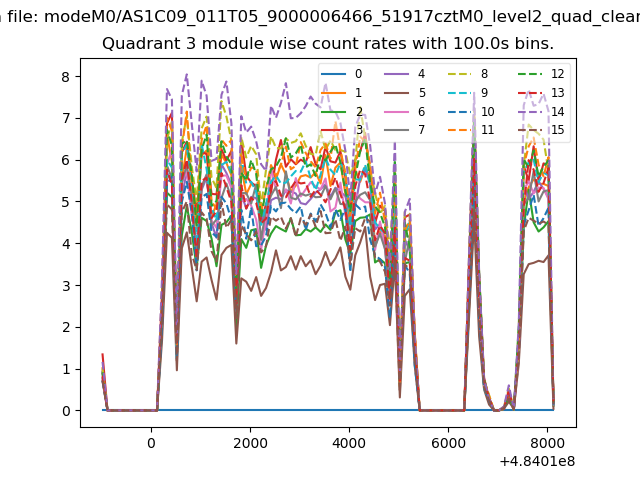
| Module-wise count rates for Quadrant A Data is divided into 100 sec bins |
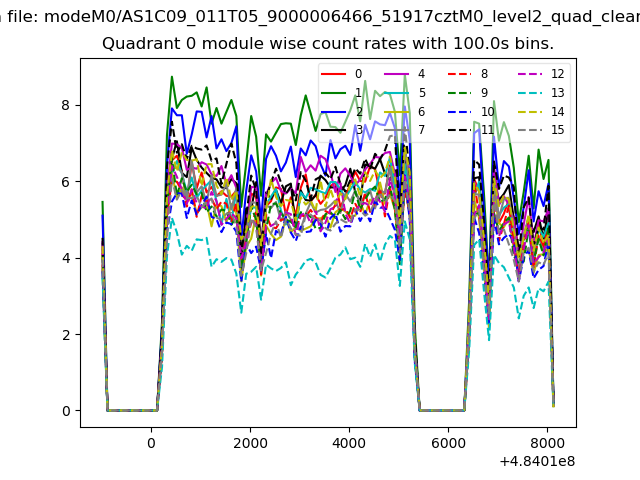 |
 |
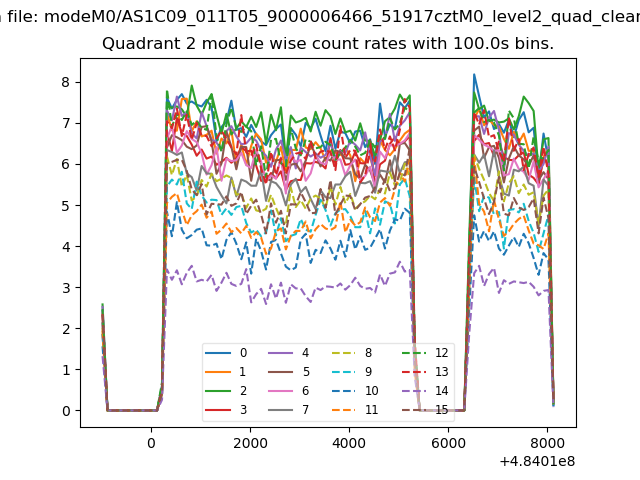
| Module-wise count rates for Quadrant B Data is divided into 100 sec bins |
 |
 |
| Module-wise count rates for Quadrant C Data is divided into 100 sec bins |
 |
 |
| Module-wise count rates for Quadrant D Data is divided into 100 sec bins |
 |
 |
| Parameter | Plot |
|---|---|
| CZT HV Monitor | 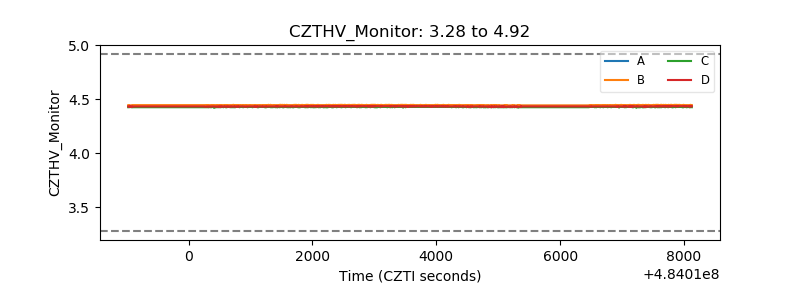 |
| D_VDD | 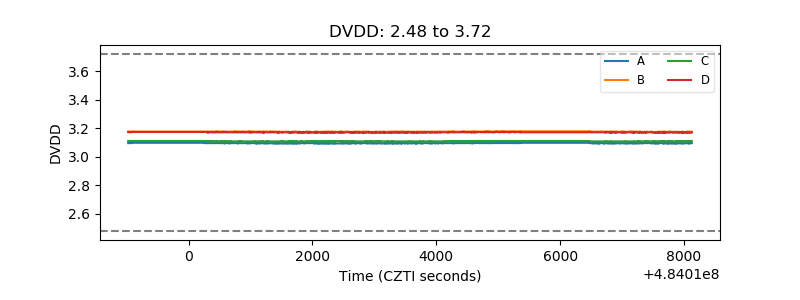 |
| Temperature 1 | 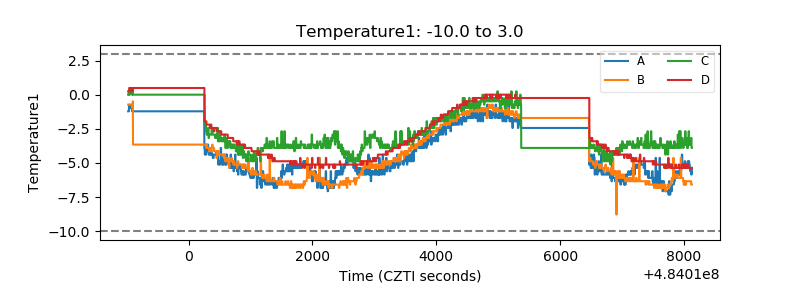 |
| Veto HV Monitor | 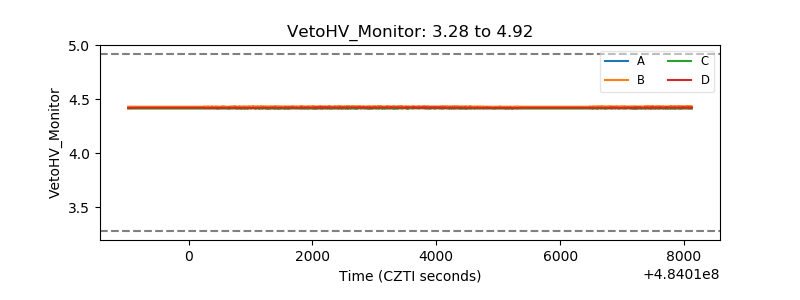 |
| Veto LLD | 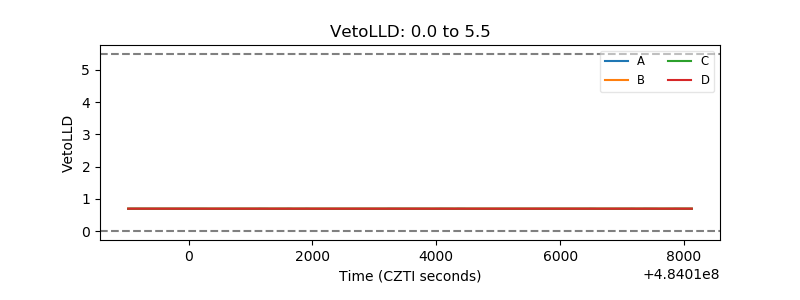 |
| Alpha Counter | 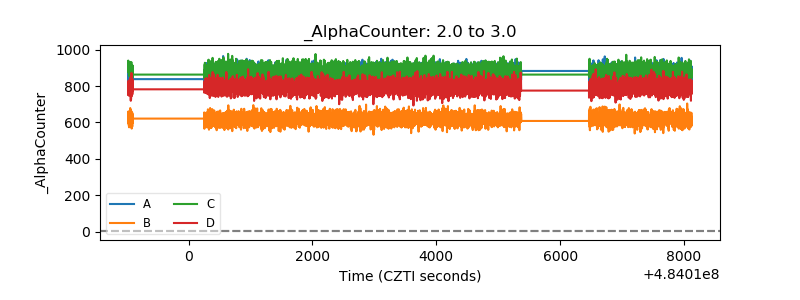 |
| _CPM_Rate | 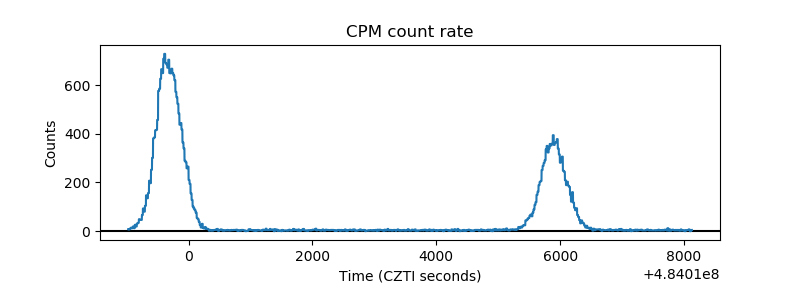 |
| CZT Counter | 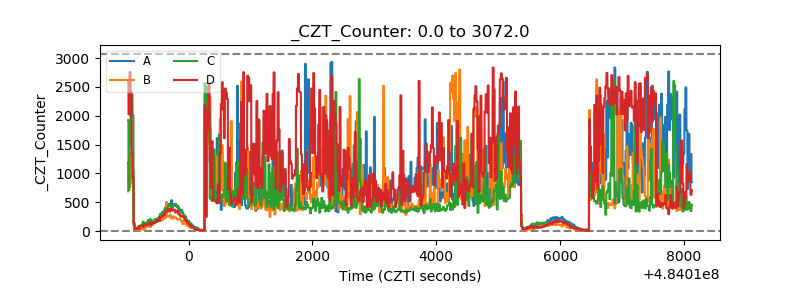 |
| +2.5 Volts monitor | 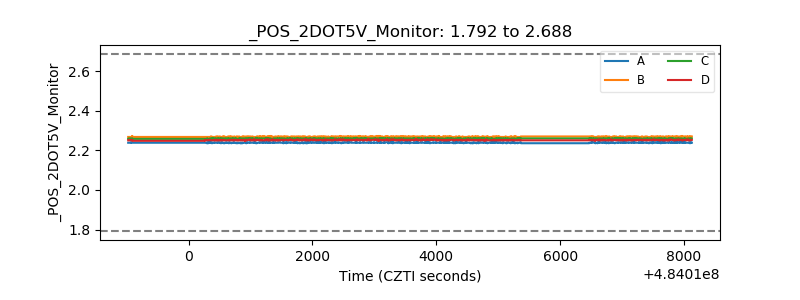 |
| +5 Volts monitor |  |
| _ROLL_ROT | 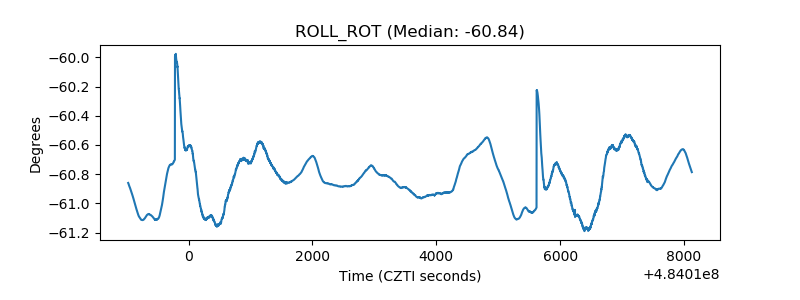 |
| _Roll_DEC | 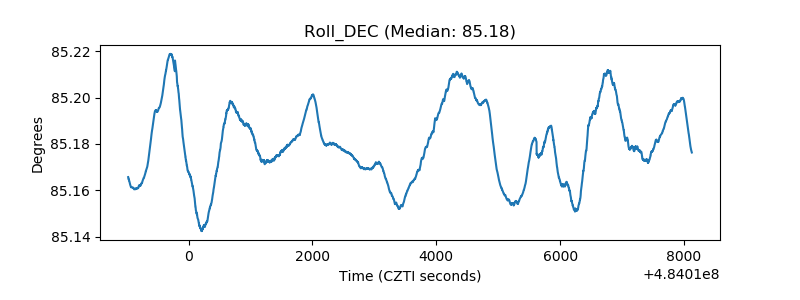 |
| _Roll_RA | 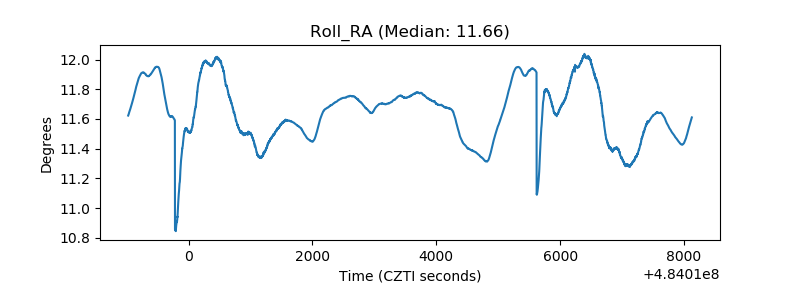 |
| Veto Counter | 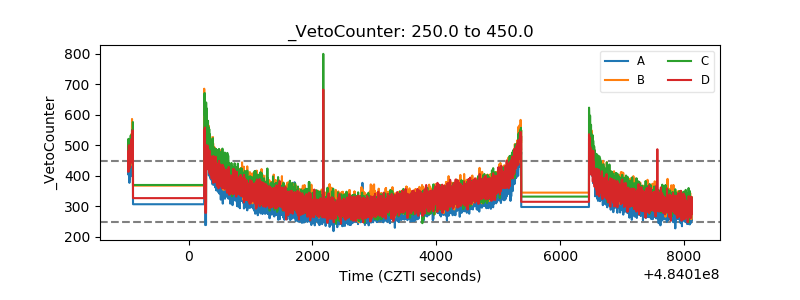 |