| Param | Original file | Final file |
|---|---|---|
| Filename | modeM0/AS1C09_011T05_9000006466_51918cztM0_level2.fits | modeM0/AS1C09_011T05_9000006466_51918cztM0_level2_quad_clean.evt |
| Size (bytes) | 839,810,880 | 70,620,480 |
| Size | 800.9 MB | 67.3 MB |
| Events in quadrant A | 9,126,955 | 398,682 |
| Events in quadrant B | 7,239,952 | 450,896 |
| Events in quadrant C | 5,619,178 | 505,068 |
| Events in quadrant D | 8,623,917 | 352,521 |
| Mode SS | |||
|---|---|---|---|
| Quadrant | BADHDUFLAG | Total packets | Discarded packets |
| A | 0 | 124 | 0 |
| B | 0 | 124 | 0 |
| C | 0 | 124 | 0 |
| D | 0 | 124 | 0 |
| Mode M0 | |||
|---|---|---|---|
| Quadrant | BADHDUFLAG | Total packets | Discarded packets |
| A | 0 | 31397 | 1 |
| B | 0 | 25919 | 3 |
| C | 0 | 21110 | 1 |
| D | 0 | 29963 | 1 |
| Mode M9 | |||
|---|---|---|---|
| Quadrant | BADHDUFLAG | Total packets | Discarded packets |
| A | 0 | 10 | 0 |
| B | 0 | 10 | 0 |
| C | 0 | 10 | 0 |
| D | 0 | 10 | 0 |
| Quadrant | Total seconds | Saturated seconds | Saturation percentage |
|---|---|---|---|
| A | 6173 | 1990 | 32.237162% |
| B | 6172 | 1828 | 29.617628% |
| C | 6173 | 767 | 12.425077% |
| D | 6173 | 2130 | 34.505103% |
Noise dominated data is calculated using 1-second bins in cleaned event files. If a bin has >2000 counts, and if more than 50% of those come from <1% of pixels, then it is considered to be noise-dominated and hence unusable.
| Quadrant | # 1 sec bins | Bins with >0 counts | Bins with >2000 counts | High rate bins dominated by noise | Noise dominated (total time) | Noise dominated (detector-on time) | Marked lightcurve |
|---|---|---|---|---|---|---|---|
| A | 7083 | 6173 | 1872 | 1872 | 26.43% | 30.33% | 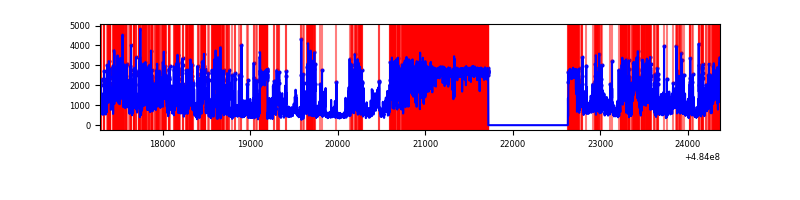 |
| B | 7082 | 6173 | 1346 | 1346 | 19.01% | 21.80% | 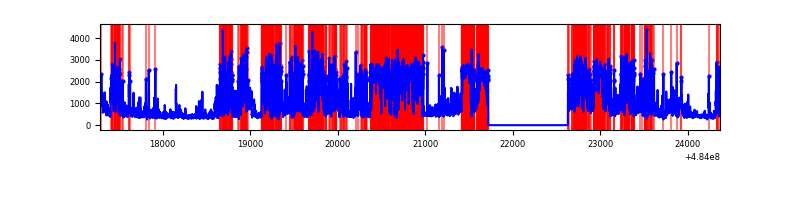 |
| C | 7083 | 6174 | 595 | 595 | 8.40% | 9.64% | 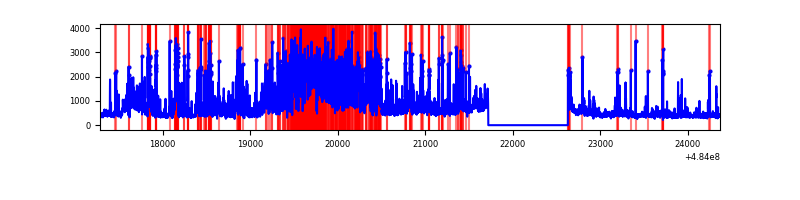 |
| D | 7083 | 6174 | 1792 | 1792 | 25.30% | 29.02% | 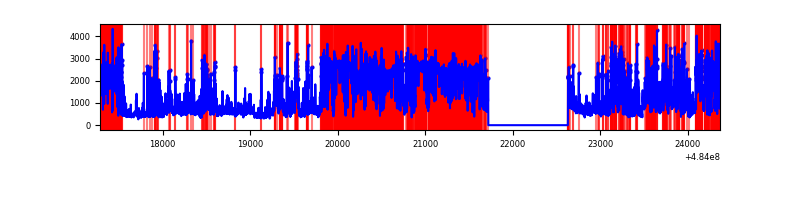 |
Top three noisy pixels from each quadrant. If the there are fewer than three noisy pixels in the level2.evt file, extra rows are filled as -1
| Pixel properties | Quadrant properties | ||||||
|---|---|---|---|---|---|---|---|
| Quadrant | DetID | PixID | Counts | Sigma | Mean | Median | Sigma |
| A | 8 | 248 | 2843196 | 22302.94 | 505 | 492 | 127.5 |
| A | 7 | 64 | 1954759 | 15332.55 | 505 | 492 | 127.5 |
| A | 12 | 3 | 1061562 | 8324.81 | 505 | 492 | 127.5 |
| B | 4 | 206 | 4233658 | 37643.62 | 525 | 508 | 112.5 |
| B | 12 | 32 | 281706 | 2500.58 | 525 | 508 | 112.5 |
| B | 4 | 171 | 170863 | 1514.9 | 525 | 508 | 112.5 |
| C | 15 | 158 | 2190554 | 13731.68 | 578 | 575 | 159.5 |
| C | 4 | 5 | 237102 | 1483.08 | 578 | 575 | 159.5 |
| C | 13 | 3 | 131020 | 817.92 | 578 | 575 | 159.5 |
| D | 15 | 94 | 3616558 | 27121.79 | 464 | 442 | 133.3 |
| D | 3 | 12 | 742449 | 5565.24 | 464 | 442 | 133.3 |
| D | 12 | 17 | 645703 | 4839.62 | 464 | 442 | 133.3 |
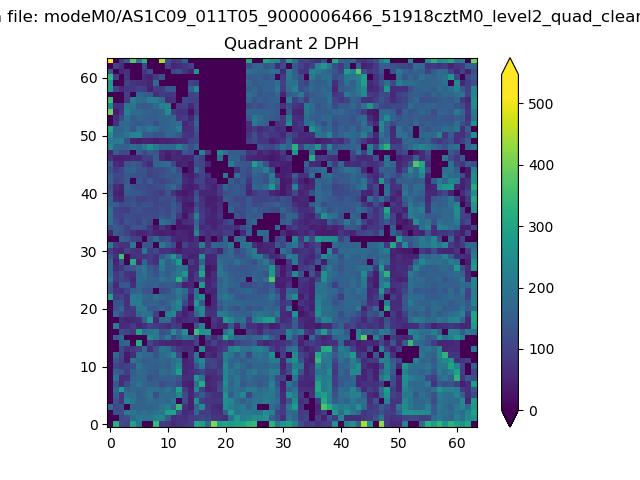
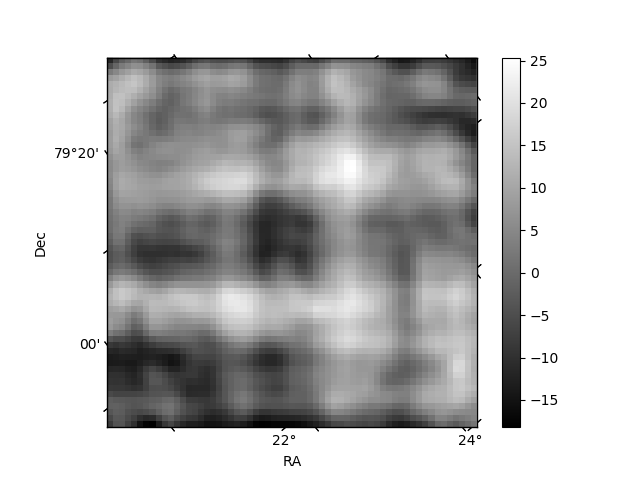
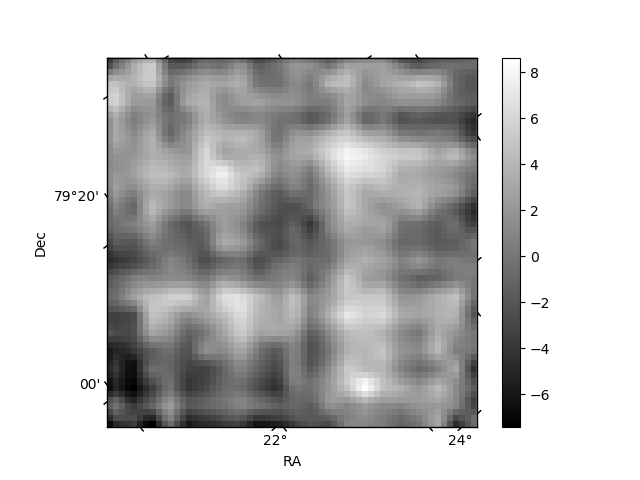
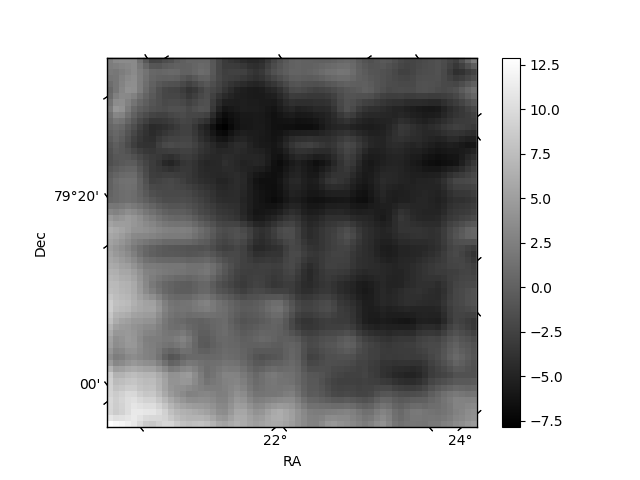
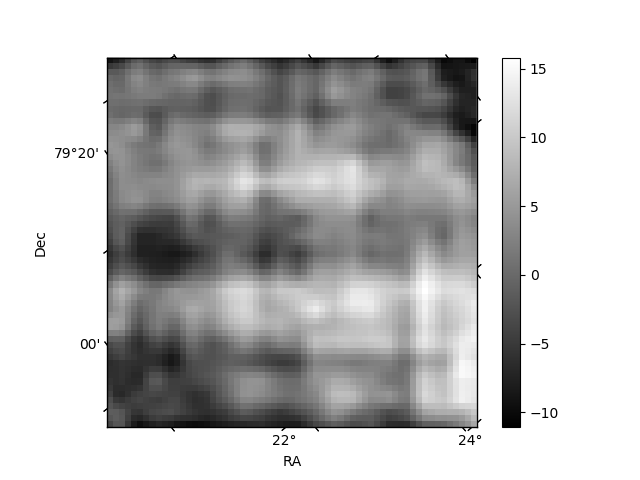
Histogram calculated using DETX and DETY for each event in the final _common_clean file
| Quadrant A | 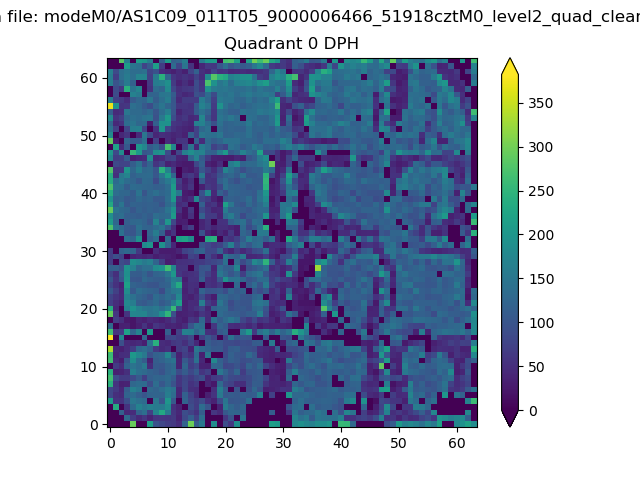 |
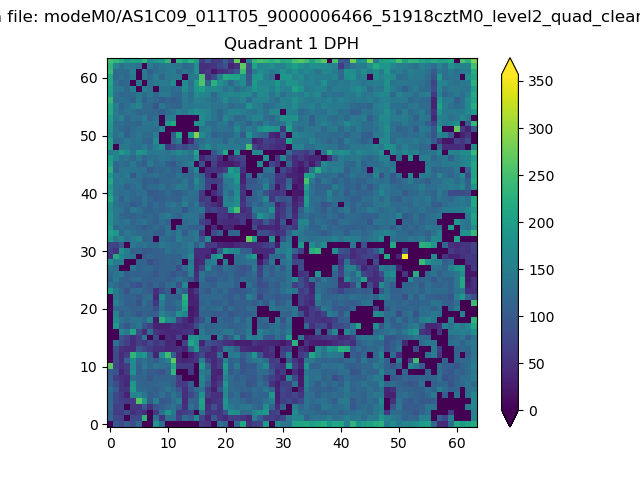 |
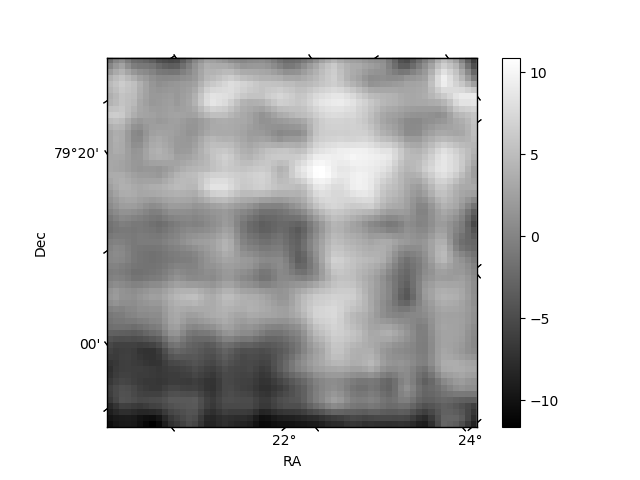
Quadrant B |
|---|---|---|---|
| Quadrant D | 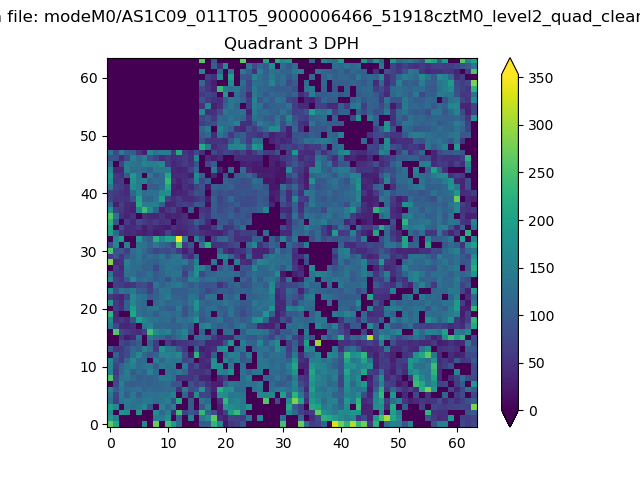 |
 |
Quadrant C |
| Plot type | Count rate plots | Images |
|---|---|---|
| Comparison with Poisson distribution Blue bars denote a histogram of data divided into 1 sec bins. Red curve is a Poisson curve with rate = median count rate of data. |
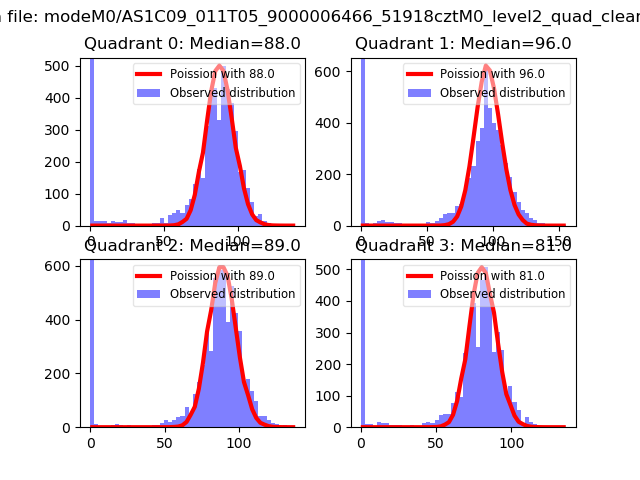 |
 |
| Quadrant-wise count rates Data is divided into 100 sec bins |
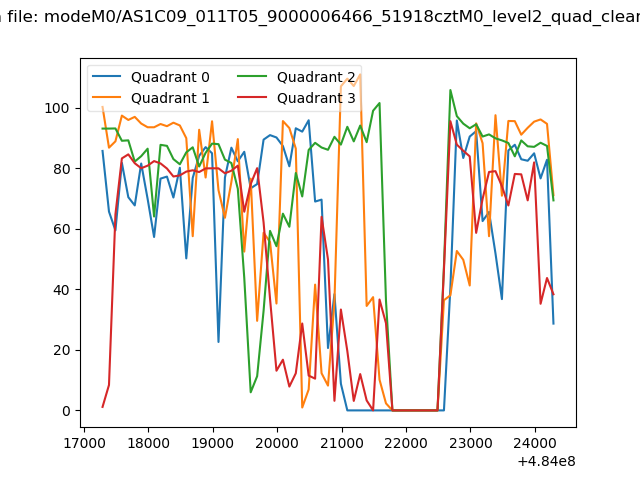 |
|
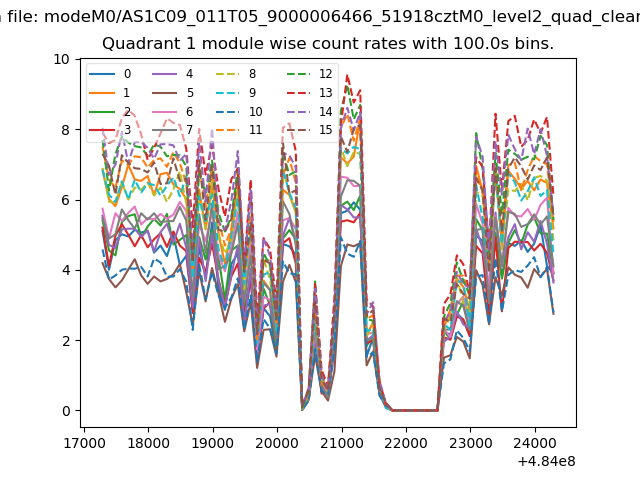
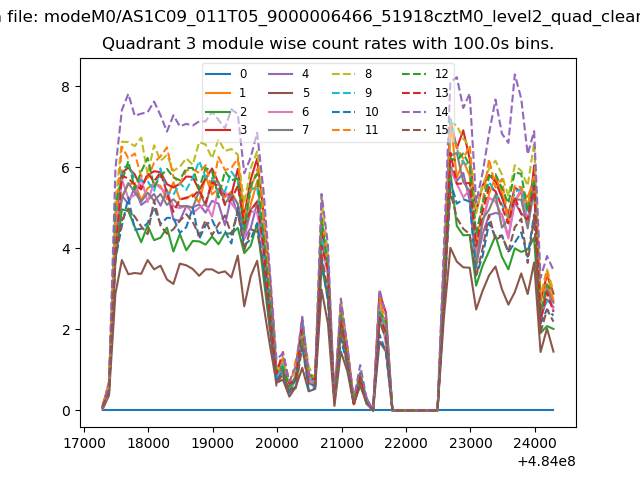
| Module-wise count rates for Quadrant A Data is divided into 100 sec bins |
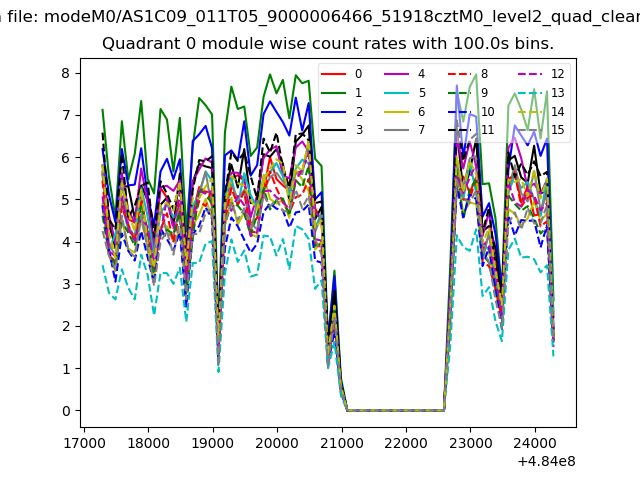 |
 |
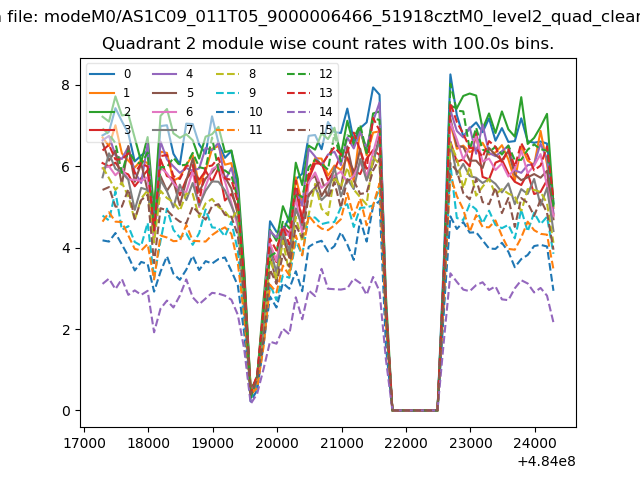
| Module-wise count rates for Quadrant B Data is divided into 100 sec bins |
 |
 |
| Module-wise count rates for Quadrant C Data is divided into 100 sec bins |
 |
 |
| Module-wise count rates for Quadrant D Data is divided into 100 sec bins |
 |
 |
| Parameter | Plot |
|---|---|
| CZT HV Monitor | 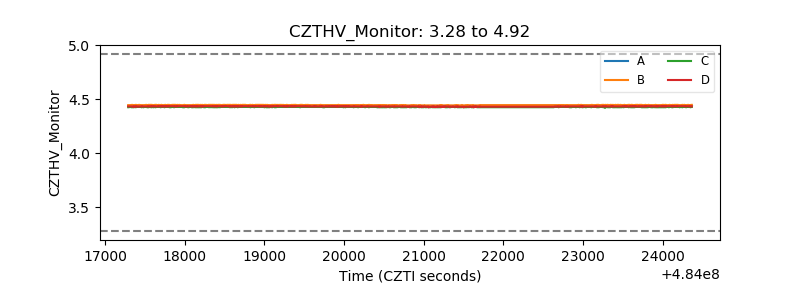 |
| D_VDD | 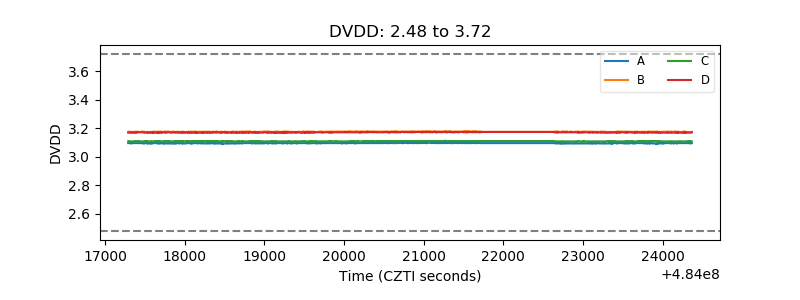 |
| Temperature 1 | 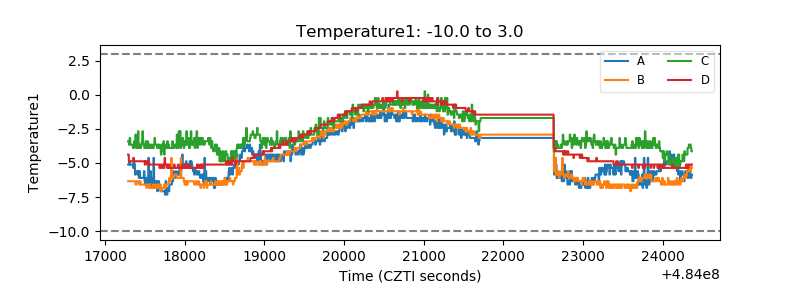 |
| Veto HV Monitor | 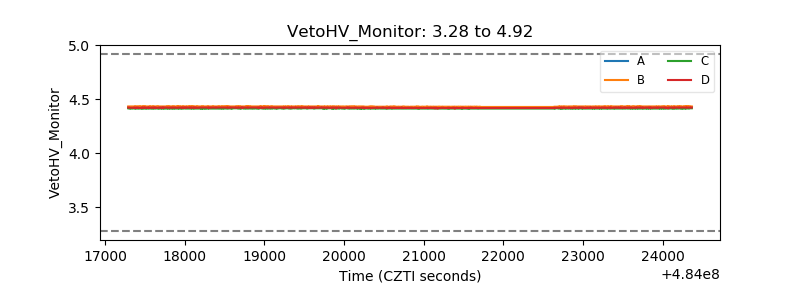 |
| Veto LLD | 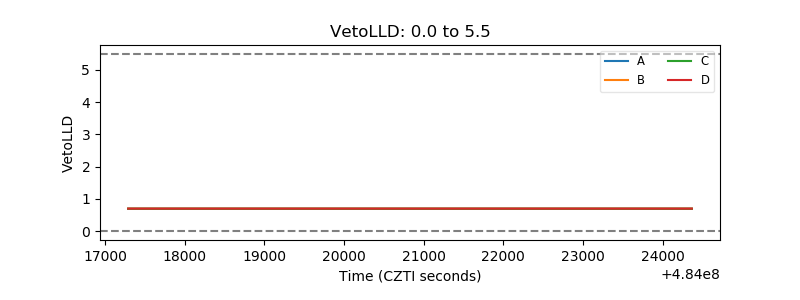 |
| Alpha Counter | 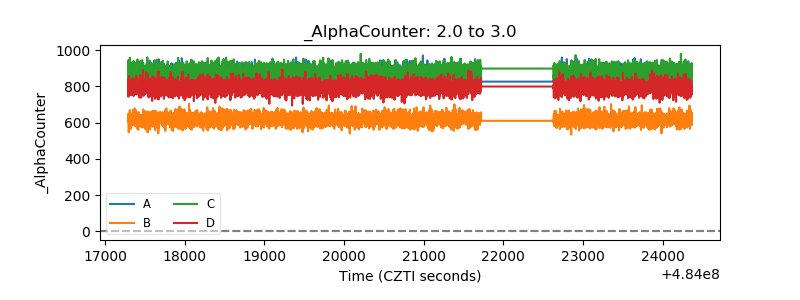 |
| _CPM_Rate | 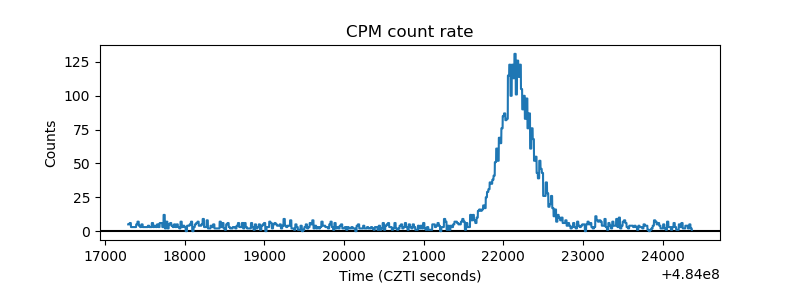 |
| CZT Counter | 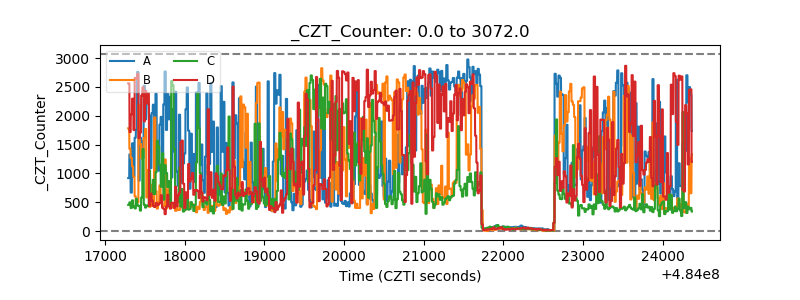 |
| +2.5 Volts monitor | 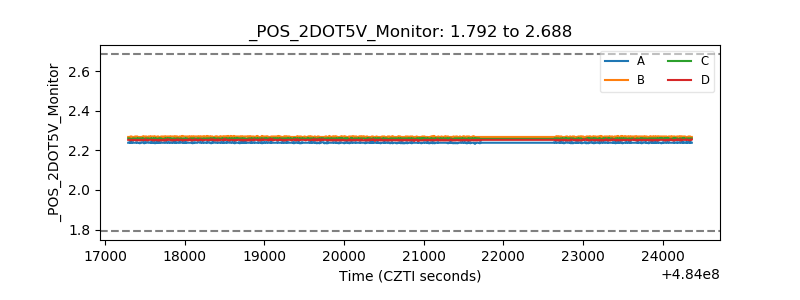 |
| +5 Volts monitor | 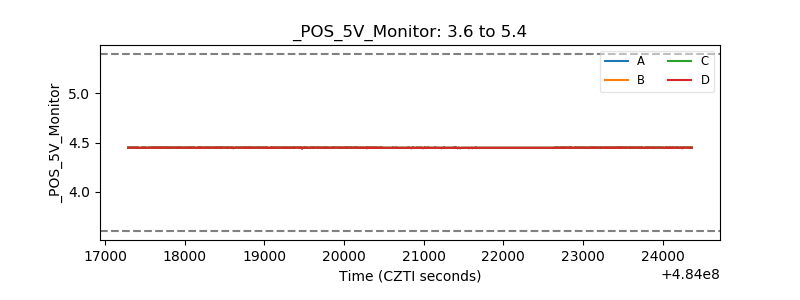 |
| _ROLL_ROT | 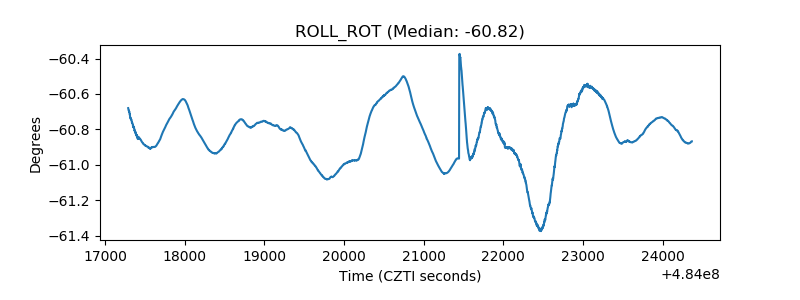 |
| _Roll_DEC | 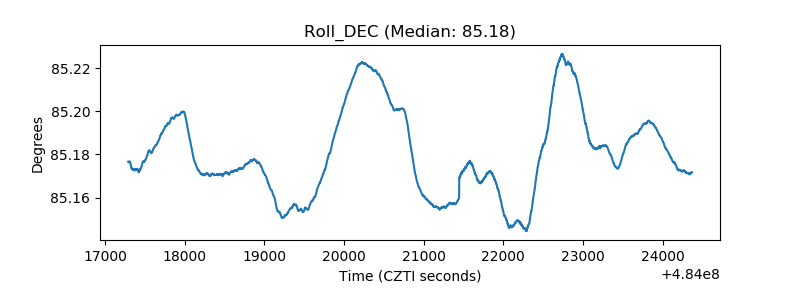 |
| _Roll_RA | 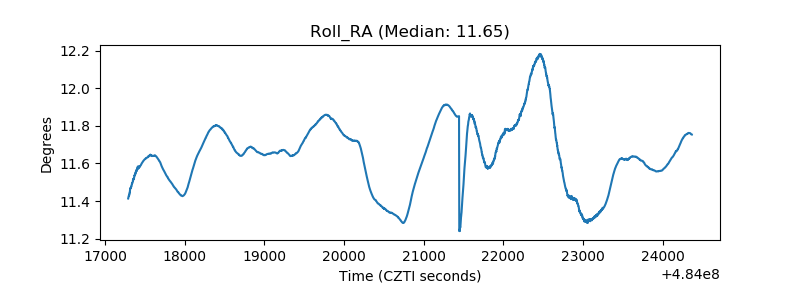 |
| Veto Counter | 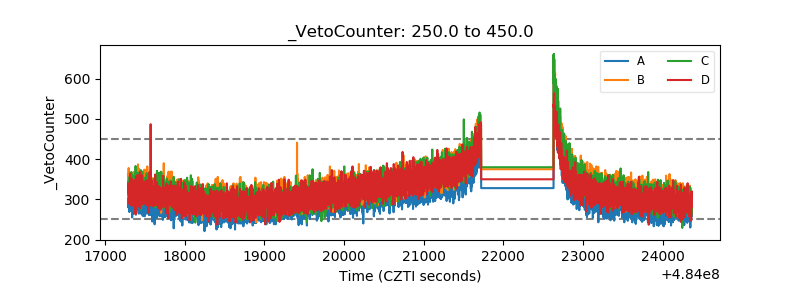 |