| Param | Original file | Final file |
|---|---|---|
| Filename | modeM0/AS1C09_011T05_9000006466_51919cztM0_level2.fits | modeM0/AS1C09_011T05_9000006466_51919cztM0_level2_quad_clean.evt |
| Size (bytes) | 1,070,622,720 | 70,274,880 |
| Size | 1021.0 MB | 67.0 MB |
| Events in quadrant A | 11,193,647 | 381,433 |
| Events in quadrant B | 9,526,819 | 449,781 |
| Events in quadrant C | 6,090,465 | 519,651 |
| Events in quadrant D | 12,296,241 | 302,702 |
| Mode SS | |||
|---|---|---|---|
| Quadrant | BADHDUFLAG | Total packets | Discarded packets |
| A | 0 | 138 | 0 |
| B | 0 | 138 | 0 |
| C | 0 | 138 | 0 |
| D | 0 | 138 | 0 |
| Mode M0 | |||
|---|---|---|---|
| Quadrant | BADHDUFLAG | Total packets | Discarded packets |
| A | 0 | 37888 | 1 |
| B | 0 | 33116 | 1 |
| C | 0 | 23172 | 1 |
| D | 0 | 41267 | 1 |
| Mode M9 | |||
|---|---|---|---|
| Quadrant | BADHDUFLAG | Total packets | Discarded packets |
| A | 0 | 5 | 0 |
| B | 0 | 5 | 0 |
| C | 0 | 5 | 0 |
| D | 0 | 5 | 0 |
| Quadrant | Total seconds | Saturated seconds | Saturation percentage |
|---|---|---|---|
| A | 6795 | 2798 | 41.177336% |
| B | 6795 | 2570 | 37.821928% |
| C | 6795 | 1076 | 15.835173% |
| D | 6796 | 3398 | 50.000000% |
Noise dominated data is calculated using 1-second bins in cleaned event files. If a bin has >2000 counts, and if more than 50% of those come from <1% of pixels, then it is considered to be noise-dominated and hence unusable.
| Quadrant | # 1 sec bins | Bins with >0 counts | Bins with >2000 counts | High rate bins dominated by noise | Noise dominated (total time) | Noise dominated (detector-on time) | Marked lightcurve |
|---|---|---|---|---|---|---|---|
| A | 7300 | 6795 | 2615 | 2615 | 35.82% | 38.48% | 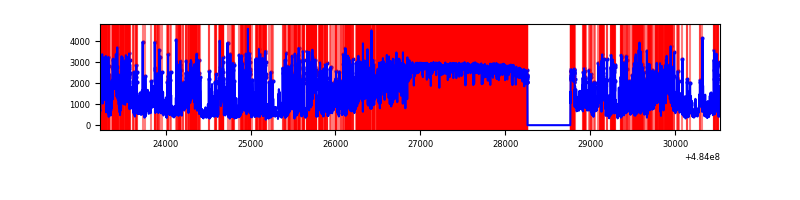 |
| B | 7300 | 6796 | 1909 | 1909 | 26.15% | 28.09% | 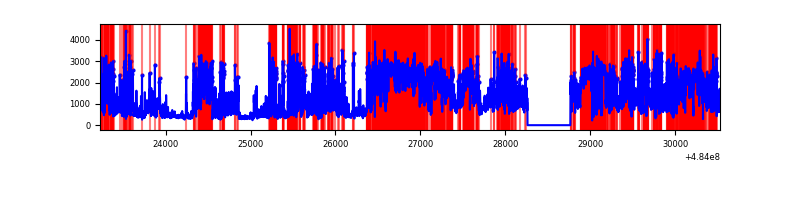 |
| C | 7300 | 6795 | 933 | 933 | 12.78% | 13.73% | 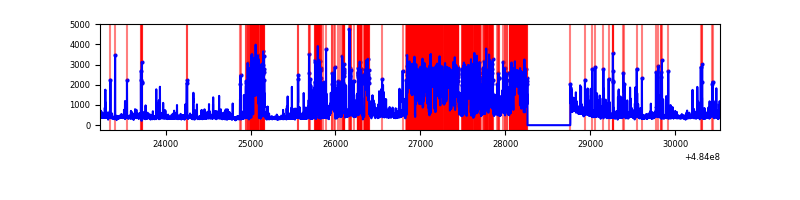 |
| D | 7301 | 6796 | 3221 | 3221 | 44.12% | 47.40% | 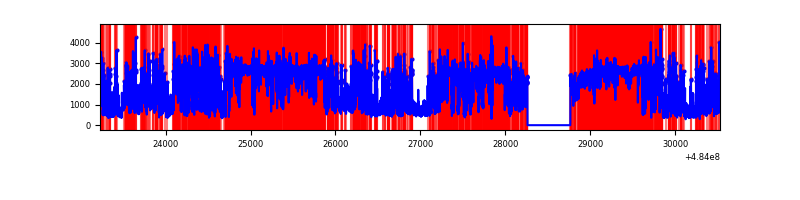 |
Top three noisy pixels from each quadrant. If the there are fewer than three noisy pixels in the level2.evt file, extra rows are filled as -1
| Pixel properties | Quadrant properties | ||||||
|---|---|---|---|---|---|---|---|
| Quadrant | DetID | PixID | Counts | Sigma | Mean | Median | Sigma |
| A | 8 | 248 | 3963796 | 30249.55 | 518 | 505 | 131.0 |
| A | 7 | 64 | 2991387 | 22827.71 | 518 | 505 | 131.0 |
| A | 12 | 3 | 812198 | 6195.19 | 518 | 505 | 131.0 |
| B | 4 | 206 | 6613260 | 53922.72 | 570 | 552 | 122.6 |
| B | 1 | 238 | 161045 | 1308.73 | 570 | 552 | 122.6 |
| B | 8 | 234 | 121273 | 984.41 | 570 | 552 | 122.6 |
| C | 15 | 158 | 1968510 | 11244.3 | 628 | 624 | 175.0 |
| C | 15 | 224 | 444373 | 2535.54 | 628 | 624 | 175.0 |
| C | 4 | 5 | 427322 | 2438.11 | 628 | 624 | 175.0 |
| D | 15 | 94 | 7331003 | 54101.48 | 471 | 452 | 135.5 |
| D | 3 | 12 | 683704 | 5042.59 | 471 | 452 | 135.5 |
| D | 12 | 17 | 586096 | 4322.21 | 471 | 452 | 135.5 |
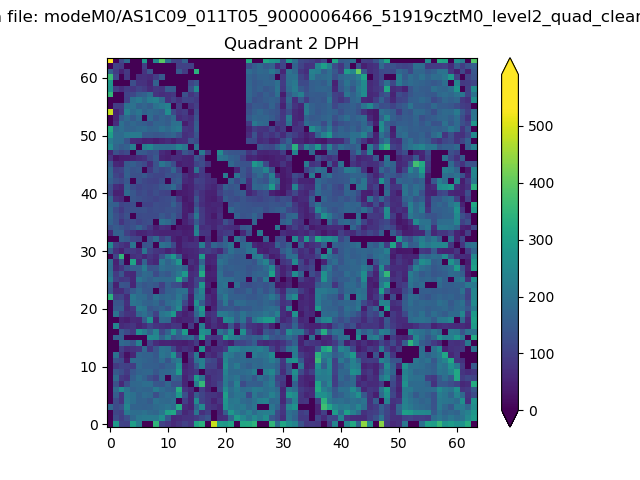
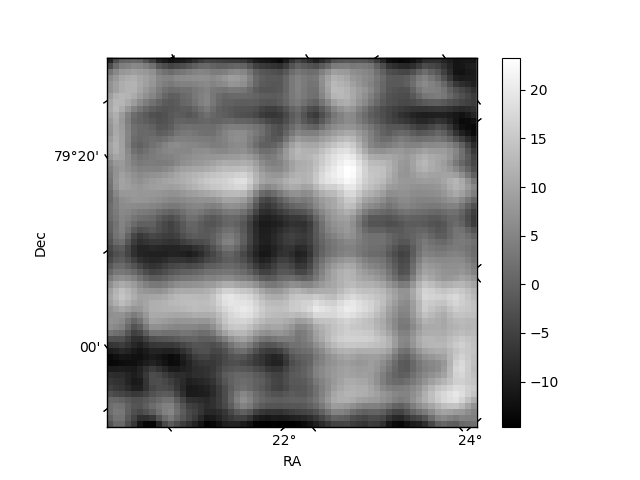
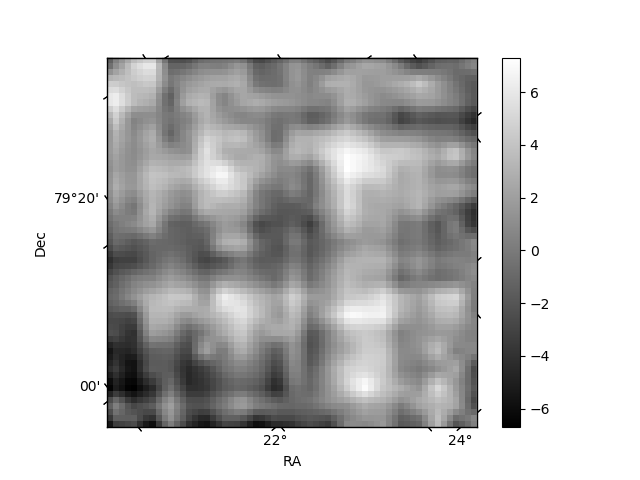
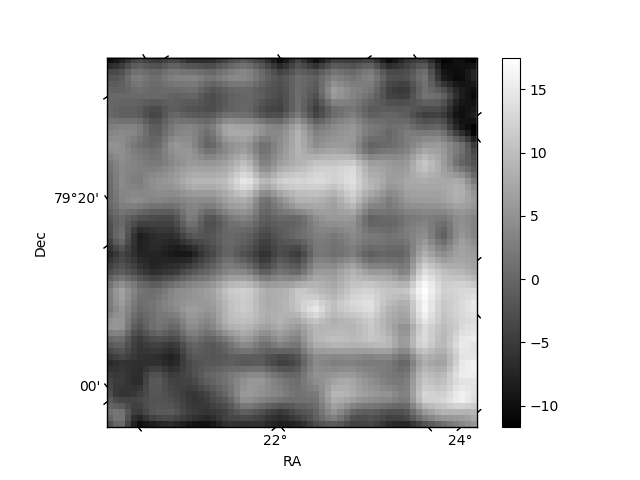
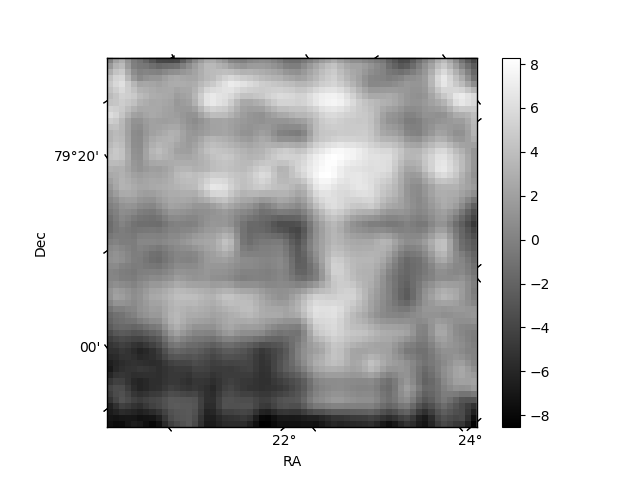
Histogram calculated using DETX and DETY for each event in the final _common_clean file
| Quadrant A | 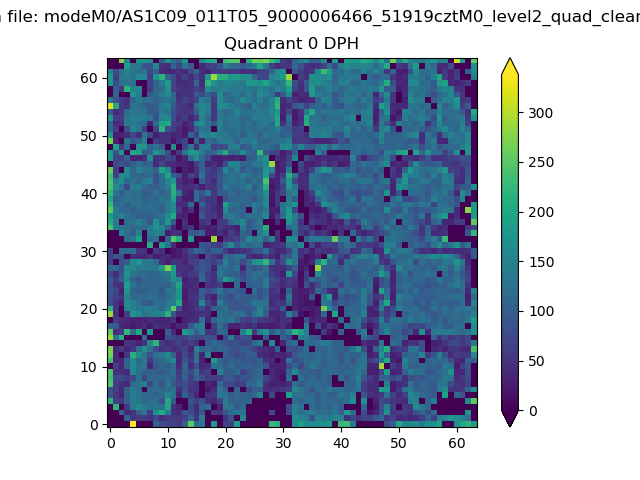 |
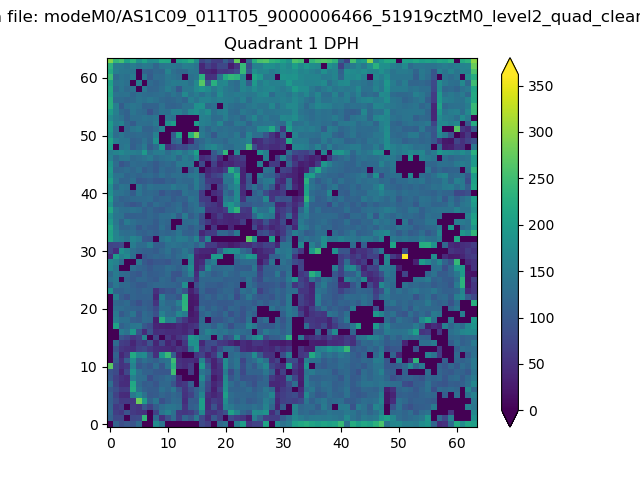 |
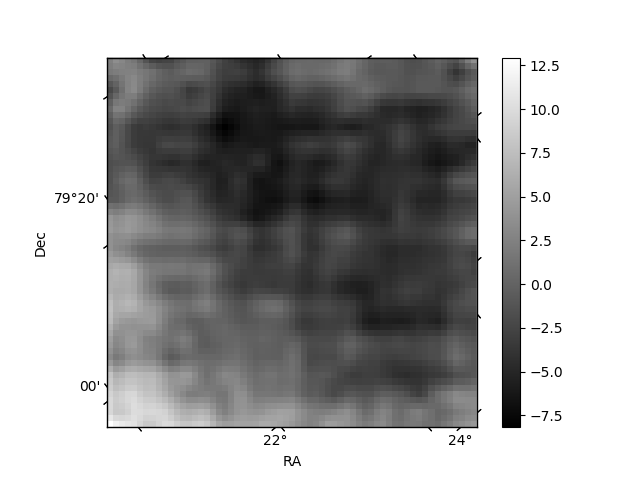
Quadrant B |
|---|---|---|---|
| Quadrant D | 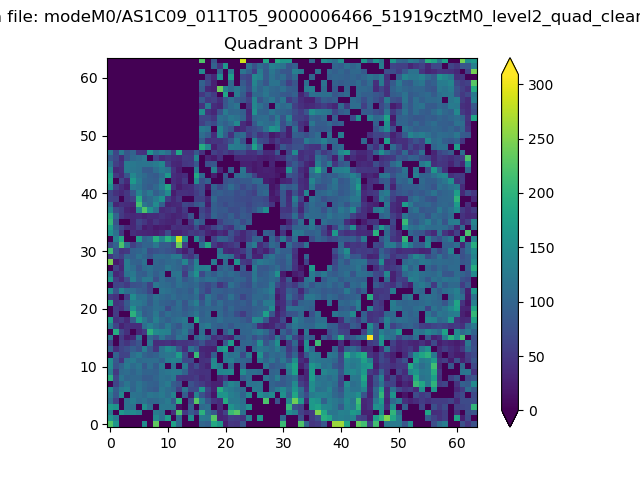 |
 |
Quadrant C |
| Plot type | Count rate plots | Images |
|---|---|---|
| Comparison with Poisson distribution Blue bars denote a histogram of data divided into 1 sec bins. Red curve is a Poisson curve with rate = median count rate of data. |
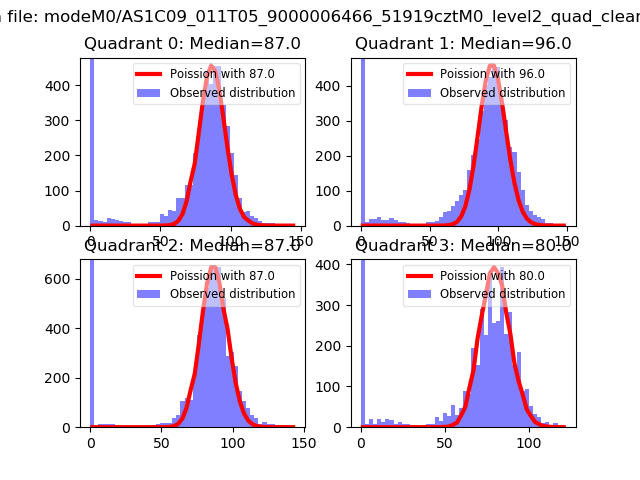 |
 |
| Quadrant-wise count rates Data is divided into 100 sec bins |
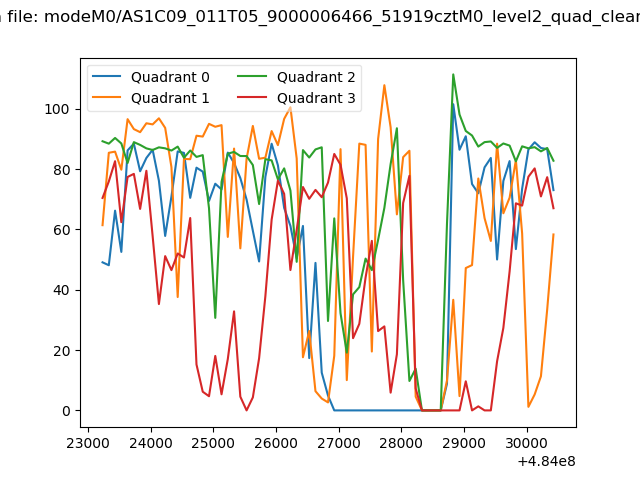 |
|
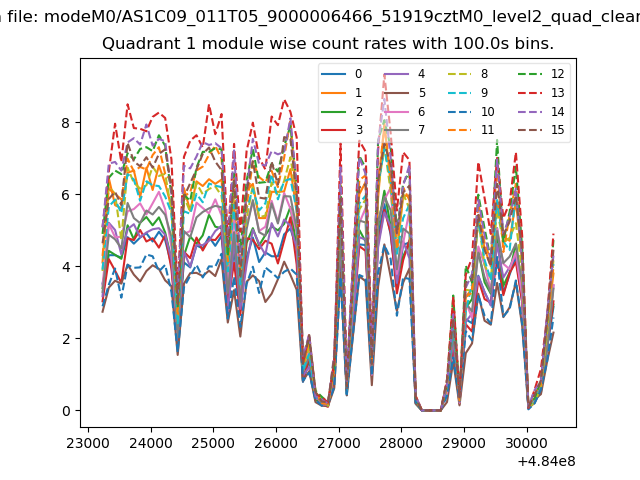
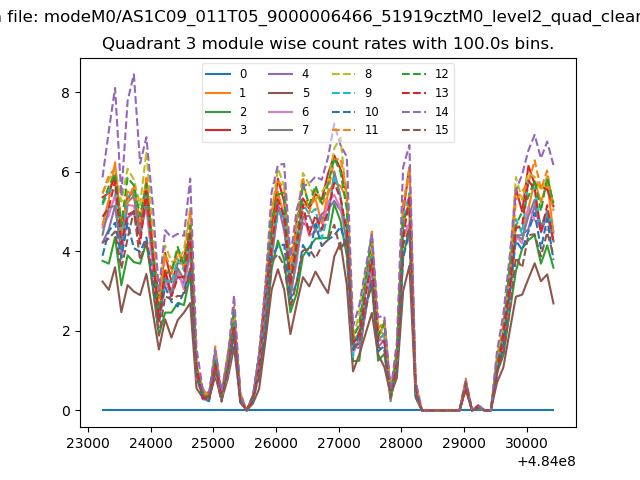
| Module-wise count rates for Quadrant A Data is divided into 100 sec bins |
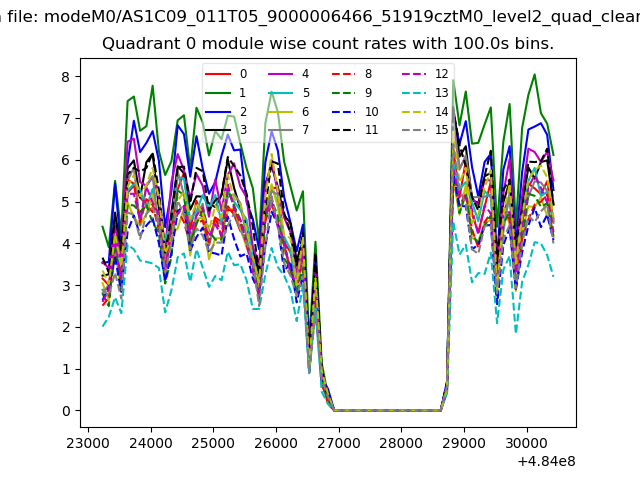 |
 |
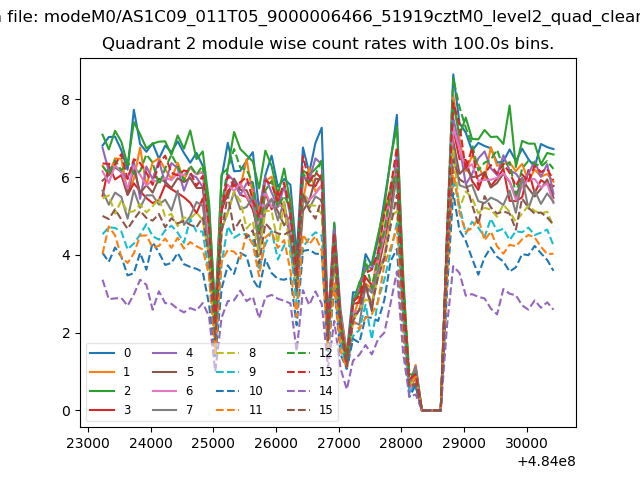
| Module-wise count rates for Quadrant B Data is divided into 100 sec bins |
 |
 |
| Module-wise count rates for Quadrant C Data is divided into 100 sec bins |
 |
 |
| Module-wise count rates for Quadrant D Data is divided into 100 sec bins |
 |
 |
| Parameter | Plot |
|---|---|
| CZT HV Monitor | 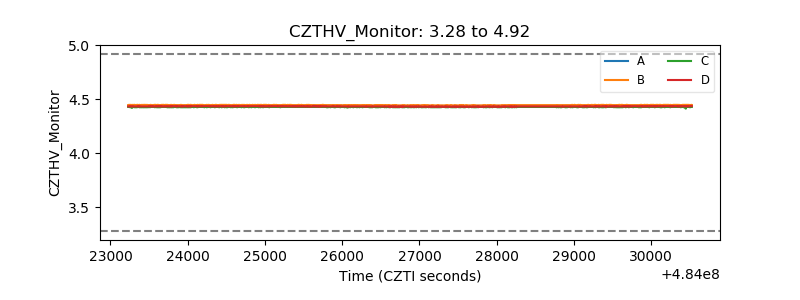 |
| D_VDD | 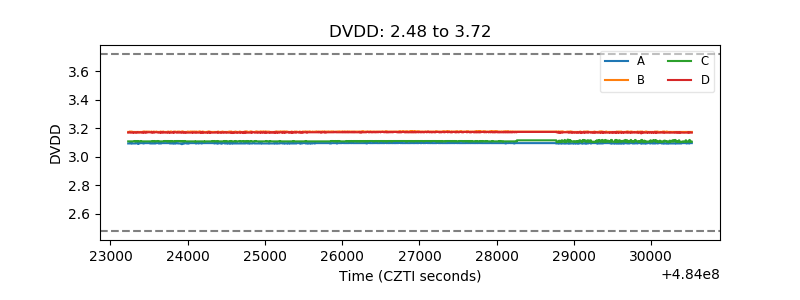 |
| Temperature 1 | 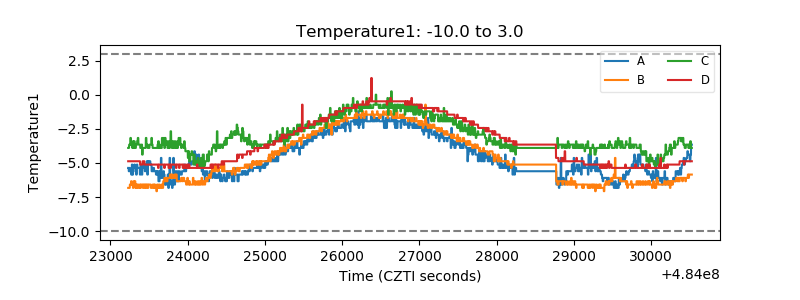 |
| Veto HV Monitor | 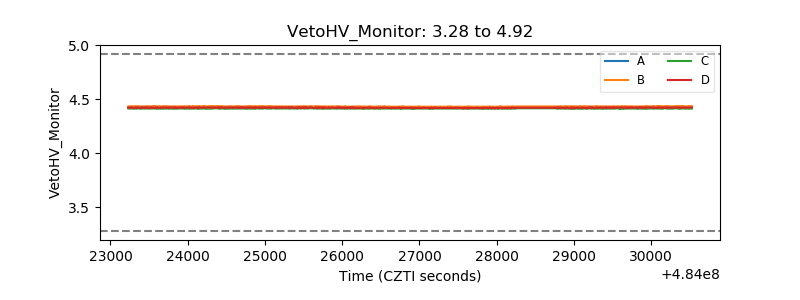 |
| Veto LLD | 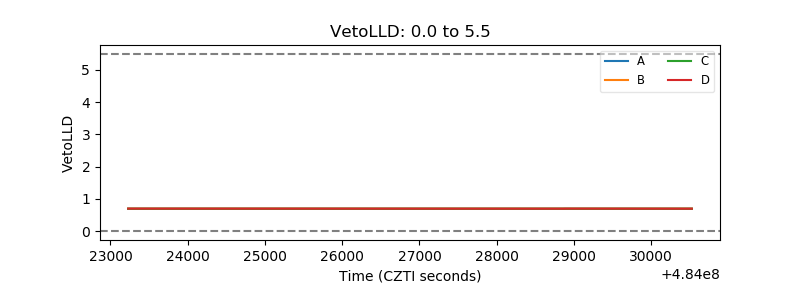 |
| Alpha Counter | 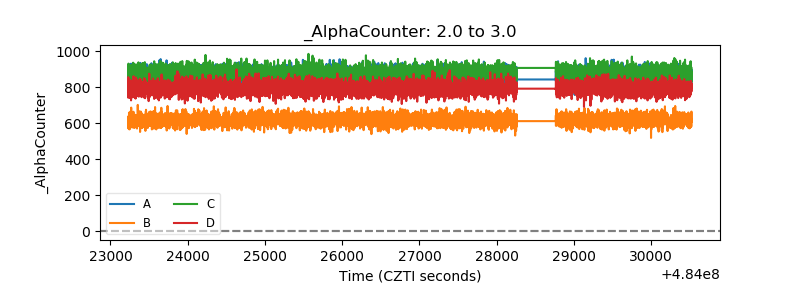 |
| _CPM_Rate | 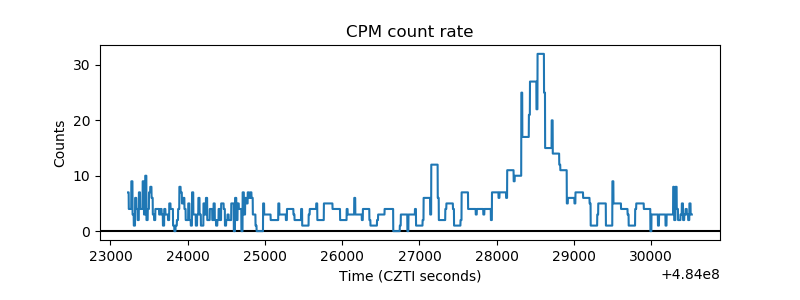 |
| CZT Counter | 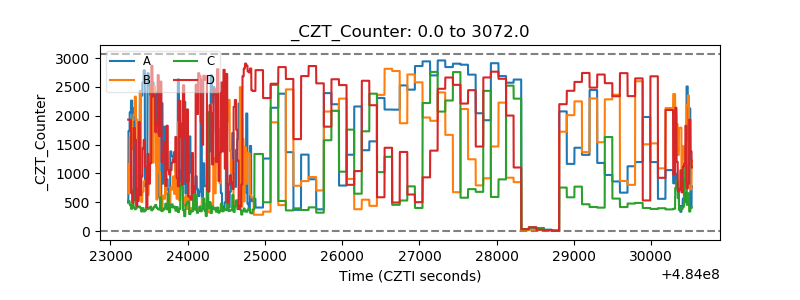 |
| +2.5 Volts monitor | 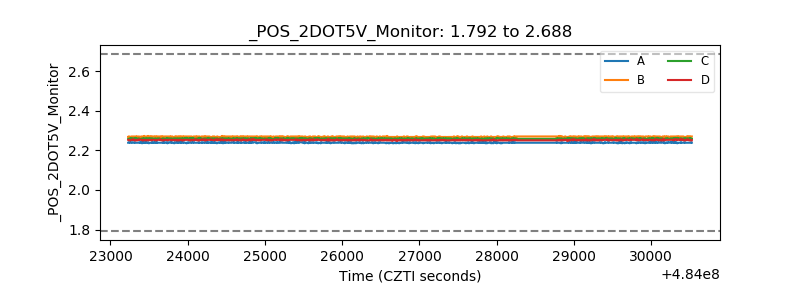 |
| +5 Volts monitor | 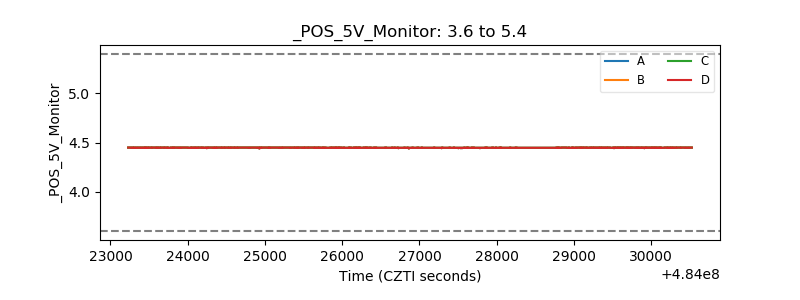 |
| _ROLL_ROT | 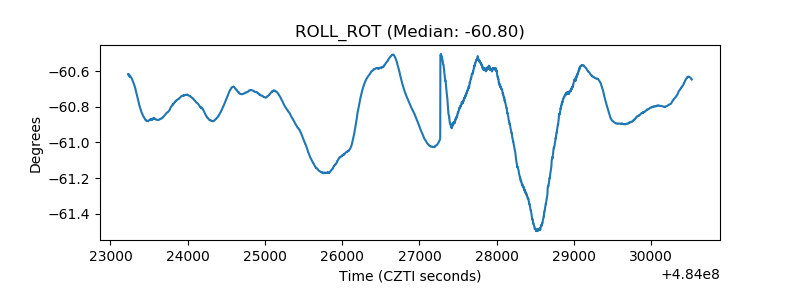 |
| _Roll_DEC | 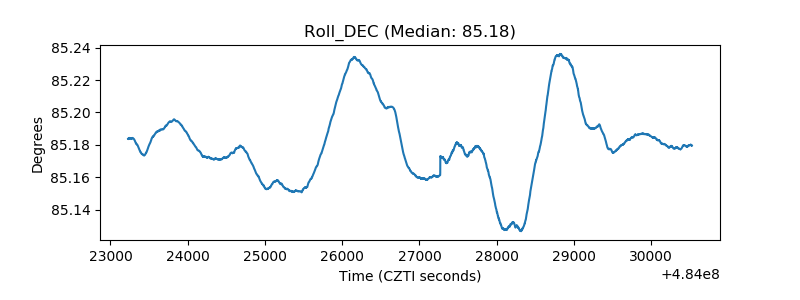 |
| _Roll_RA | 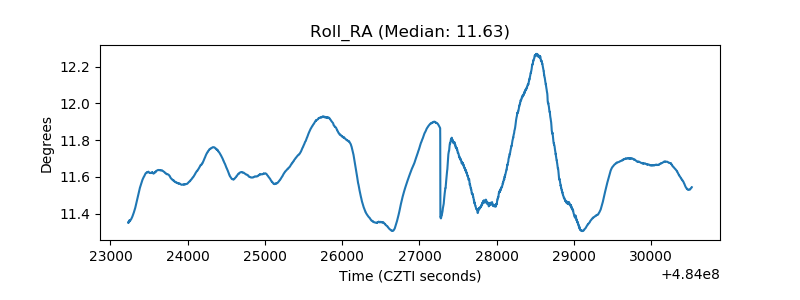 |
| Veto Counter | 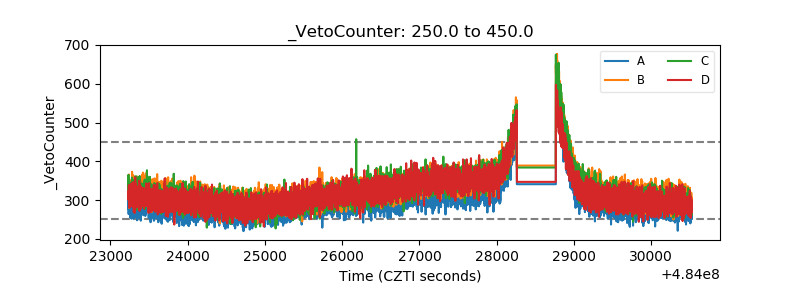 |