| Param | Original file | Final file |
|---|---|---|
| Filename | modeM0/AS1C09_011T05_9000006466_51921cztM0_level2.fits | modeM0/AS1C09_011T05_9000006466_51921cztM0_level2_quad_clean.evt |
| Size (bytes) | 1,125,950,400 | 78,258,240 |
| Size | 1.0 GB | 74.6 MB |
| Events in quadrant A | 12,944,431 | 348,941 |
| Events in quadrant B | 4,351,094 | 702,004 |
| Events in quadrant C | 13,416,690 | 333,298 |
| Events in quadrant D | 10,405,144 | 477,234 |
| Mode SS | |||
|---|---|---|---|
| Quadrant | BADHDUFLAG | Total packets | Discarded packets |
| A | 0 | 146 | 0 |
| B | 0 | 146 | 0 |
| C | 0 | 146 | 0 |
| D | 0 | 146 | 0 |
| Mode M0 | |||
|---|---|---|---|
| Quadrant | BADHDUFLAG | Total packets | Discarded packets |
| A | 0 | 43479 | 3 |
| B | 0 | 18117 | 0 |
| C | 0 | 44902 | 0 |
| D | 0 | 36027 | 9 |
| Quadrant | Total seconds | Saturated seconds | Saturation percentage |
|---|---|---|---|
| A | 7286 | 3667 | 50.329399% |
| B | 7287 | 307 | 4.212982% |
| C | 7287 | 3969 | 54.466859% |
| D | 7285 | 1744 | 23.939602% |
Noise dominated data is calculated using 1-second bins in cleaned event files. If a bin has >2000 counts, and if more than 50% of those come from <1% of pixels, then it is considered to be noise-dominated and hence unusable.
| Quadrant | # 1 sec bins | Bins with >0 counts | Bins with >2000 counts | High rate bins dominated by noise | Noise dominated (total time) | Noise dominated (detector-on time) | Marked lightcurve |
|---|---|---|---|---|---|---|---|
| A | 7287 | 7287 | 3456 | 3456 | 47.43% | 47.43% | 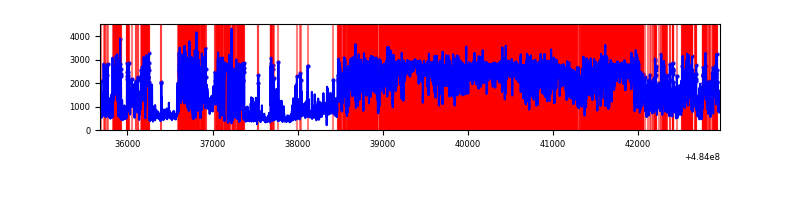 |
| B | 7287 | 7287 | 187 | 187 | 2.57% | 2.57% | 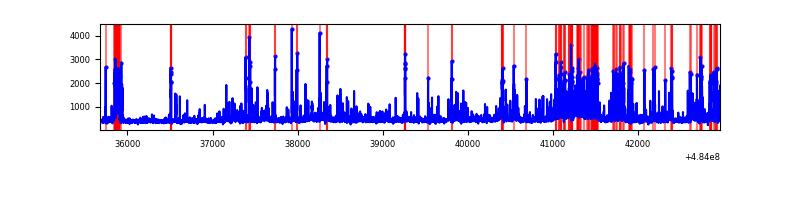 |
| C | 7287 | 7287 | 3670 | 3670 | 50.36% | 50.36% | 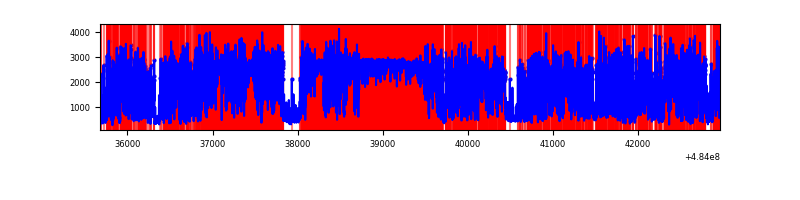 |
| D | 7286 | 7285 | 1790 | 1790 | 24.57% | 24.57% | 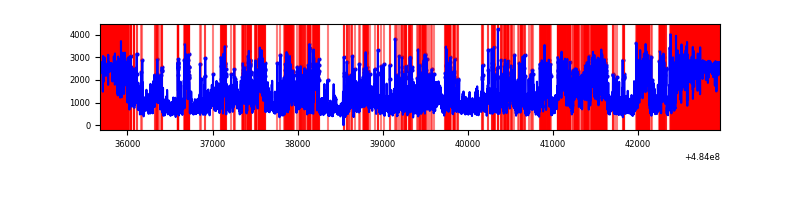 |
Top three noisy pixels from each quadrant. If the there are fewer than three noisy pixels in the level2.evt file, extra rows are filled as -1
| Pixel properties | Quadrant properties | ||||||
|---|---|---|---|---|---|---|---|
| Quadrant | DetID | PixID | Counts | Sigma | Mean | Median | Sigma |
| A | 8 | 248 | 6853049 | 47102.62 | 584 | 570 | 145.5 |
| A | 15 | 174 | 965146 | 6630.31 | 584 | 570 | 145.5 |
| A | 7 | 64 | 938672 | 6448.33 | 584 | 570 | 145.5 |
| B | 12 | 32 | 536041 | 3415.85 | 730 | 705 | 156.7 |
| B | 5 | 185 | 332525 | 2117.26 | 730 | 705 | 156.7 |
| B | 8 | 128 | 99612 | 631.1 | 730 | 705 | 156.7 |
| C | 15 | 158 | 4785889 | 33241.94 | 519 | 516 | 144.0 |
| C | 15 | 224 | 4598154 | 31937.83 | 519 | 516 | 144.0 |
| C | 13 | 3 | 533998 | 3705.87 | 519 | 516 | 144.0 |
| D | 6 | 42 | 2923884 | 15139.54 | 637 | 611 | 193.1 |
| D | 13 | 248 | 1237690 | 6406.79 | 637 | 611 | 193.1 |
| D | 13 | 169 | 959544 | 4966.28 | 637 | 611 | 193.1 |
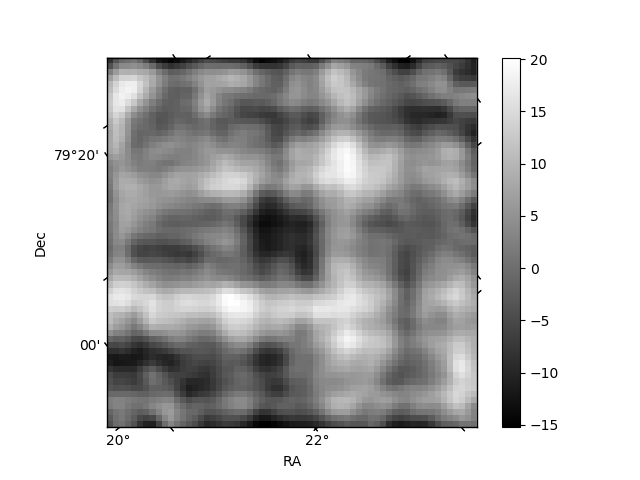
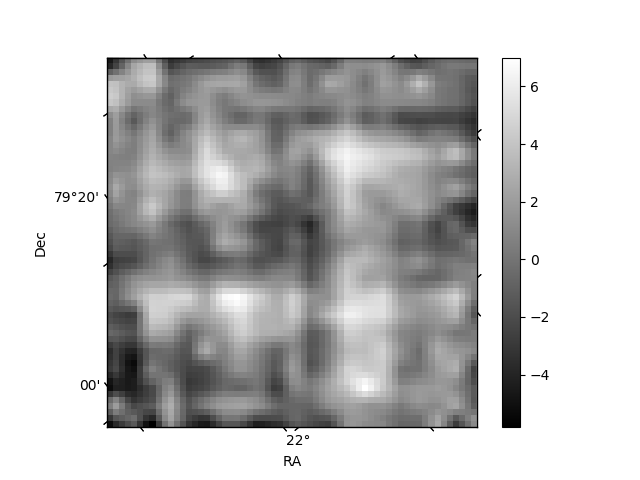
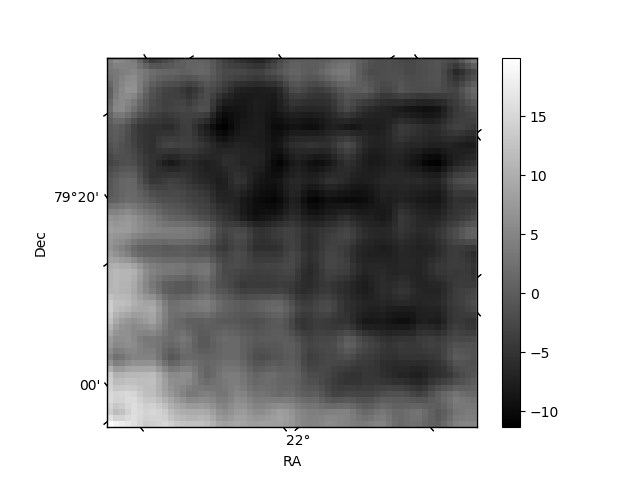
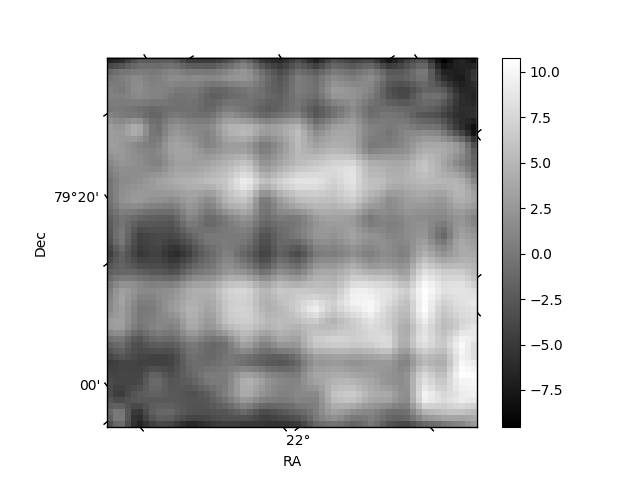
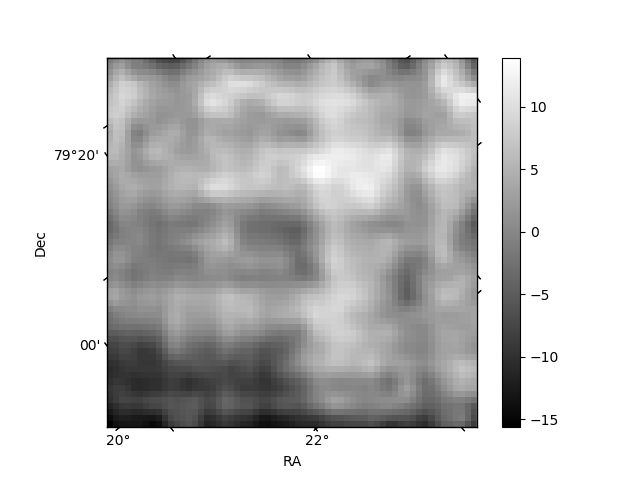
Histogram calculated using DETX and DETY for each event in the final _common_clean file
| Quadrant A | 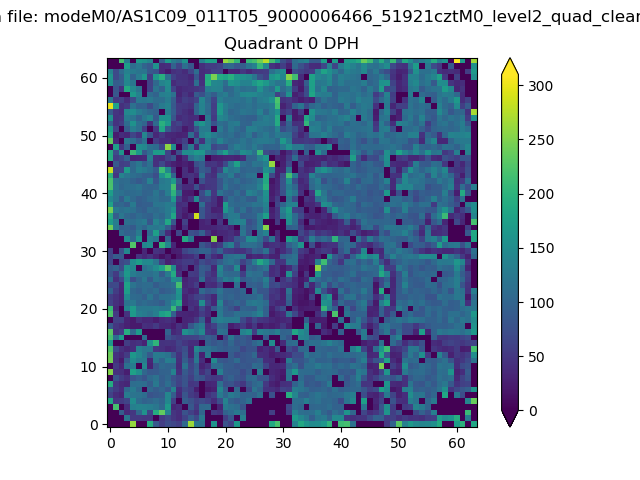 |
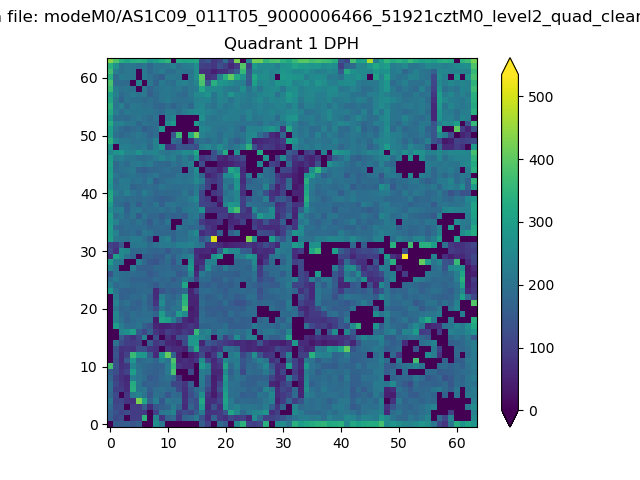 |
Quadrant B |
|---|---|---|---|
| Quadrant D | 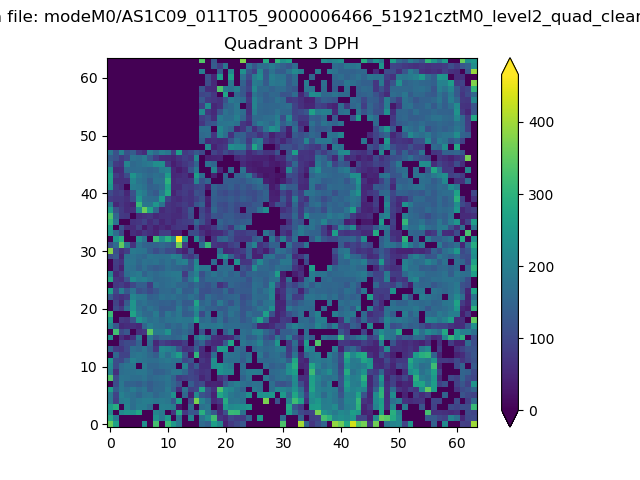 |
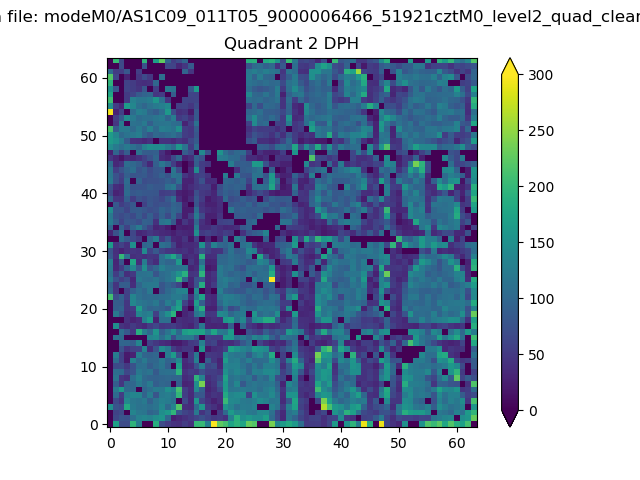 |
Quadrant C |
| Plot type | Count rate plots | Images |
|---|---|---|
| Comparison with Poisson distribution Blue bars denote a histogram of data divided into 1 sec bins. Red curve is a Poisson curve with rate = median count rate of data. |
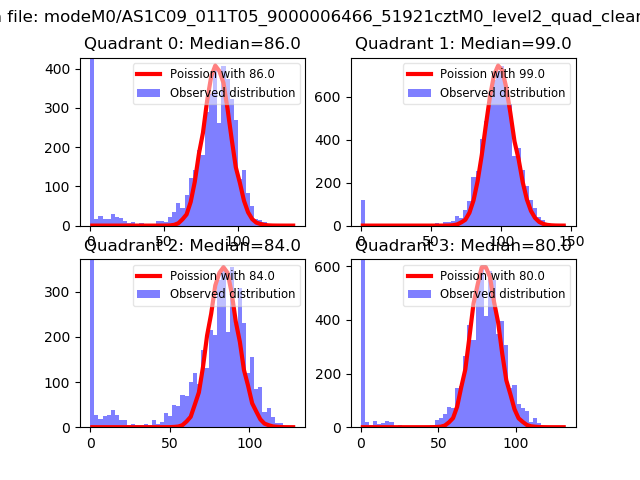 |
 |
| Quadrant-wise count rates Data is divided into 100 sec bins |
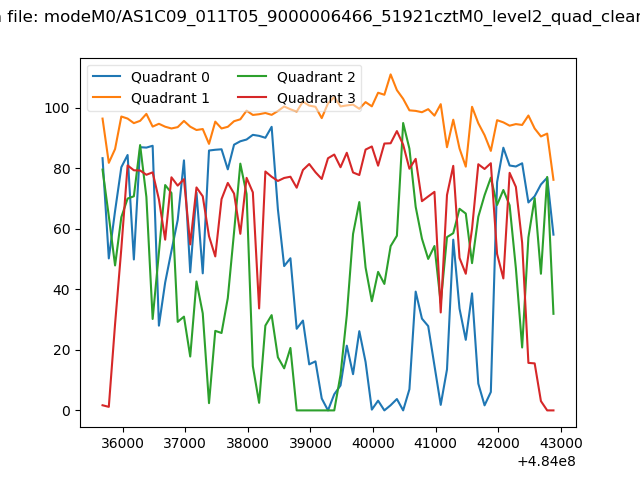 |
|
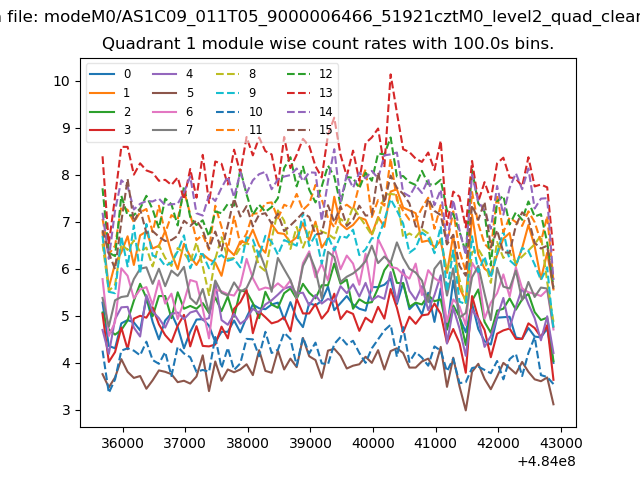
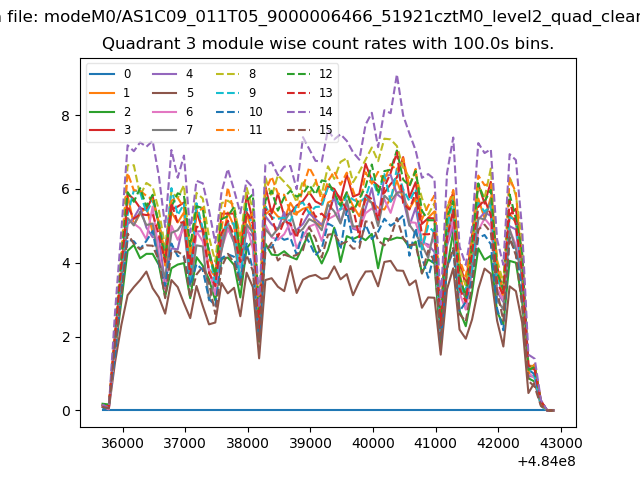
| Module-wise count rates for Quadrant A Data is divided into 100 sec bins |
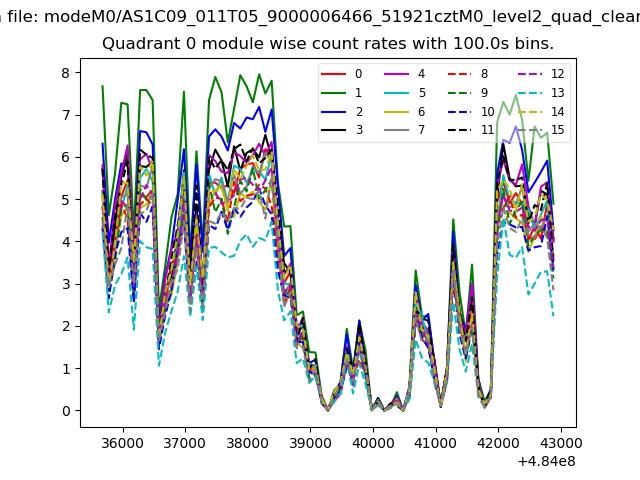 |
 |
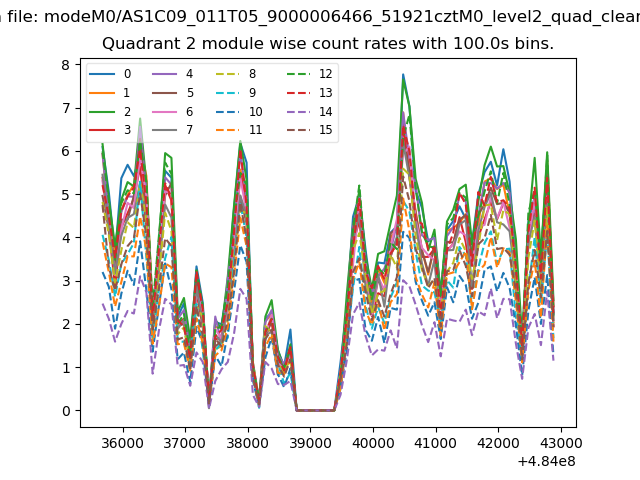
| Module-wise count rates for Quadrant B Data is divided into 100 sec bins |
 |
 |
| Module-wise count rates for Quadrant C Data is divided into 100 sec bins |
 |
 |
| Module-wise count rates for Quadrant D Data is divided into 100 sec bins |
 |
 |
| Parameter | Plot |
|---|---|
| CZT HV Monitor | 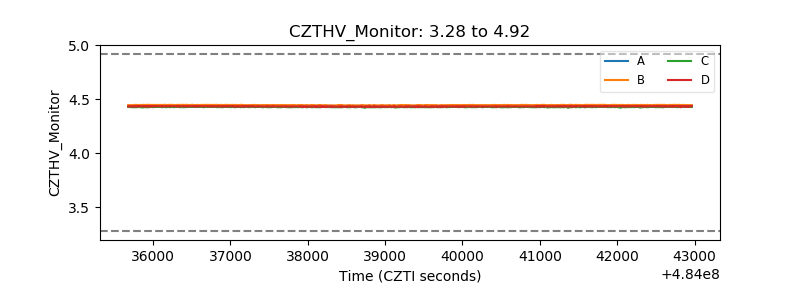 |
| D_VDD | 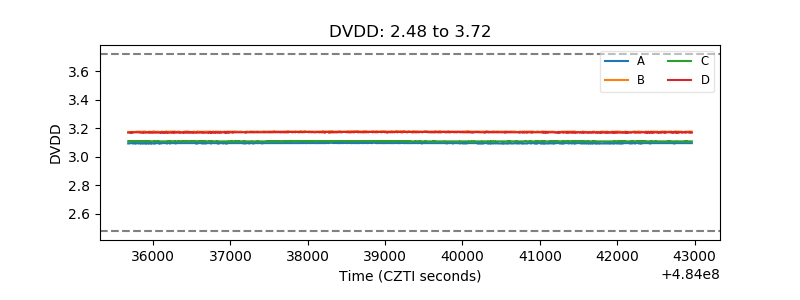 |
| Temperature 1 | 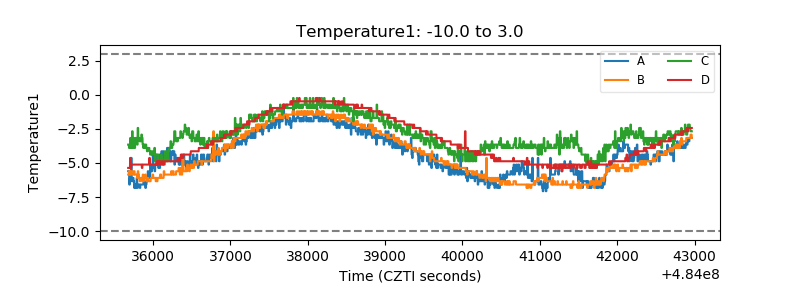 |
| Veto HV Monitor | 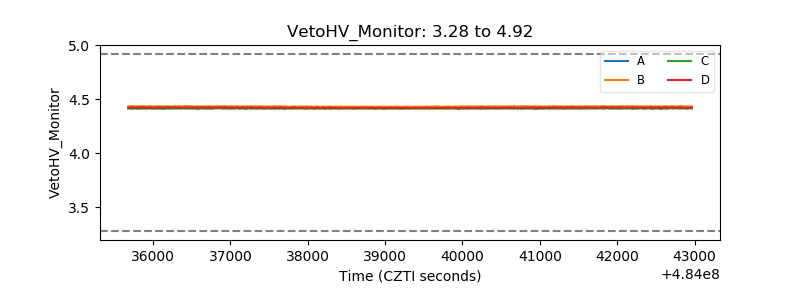 |
| Veto LLD | 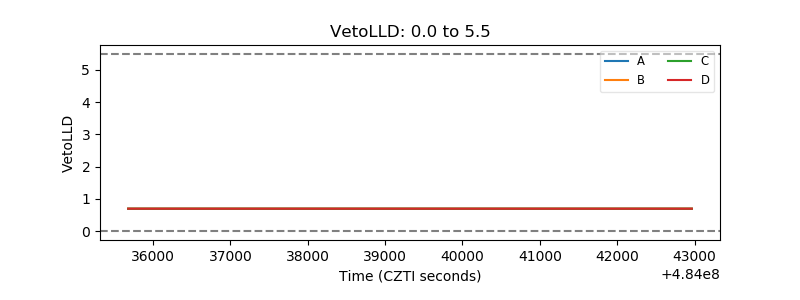 |
| Alpha Counter | 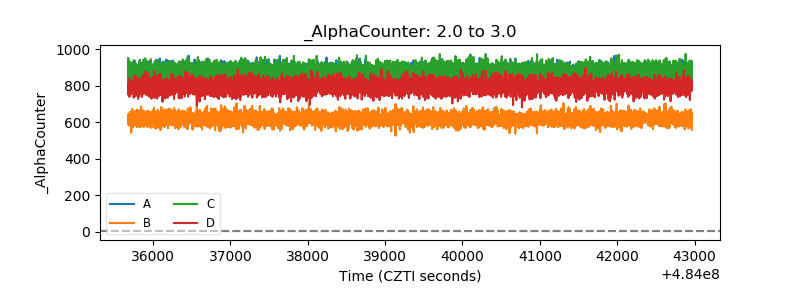 |
| _CPM_Rate | 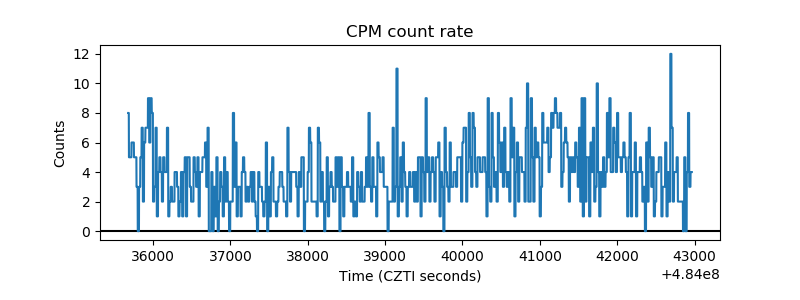 |
| CZT Counter | 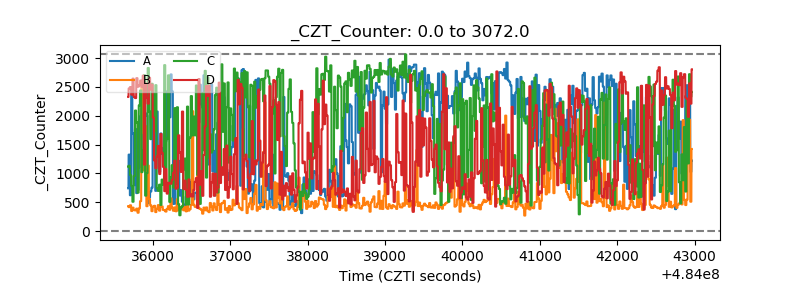 |
| +2.5 Volts monitor | 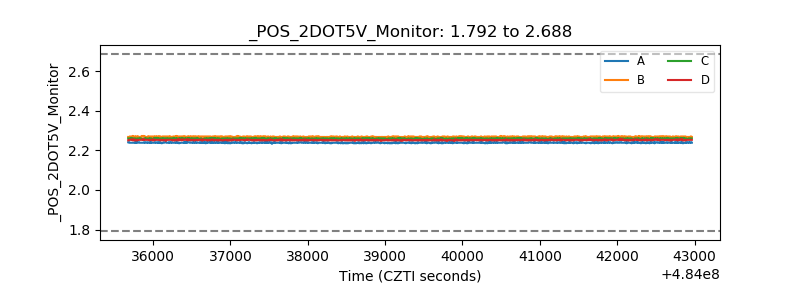 |
| +5 Volts monitor | 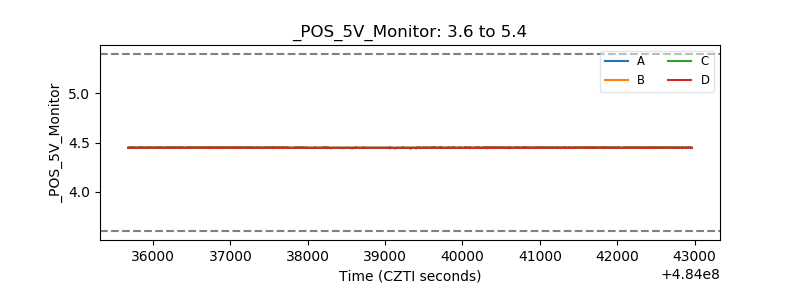 |
| _ROLL_ROT | 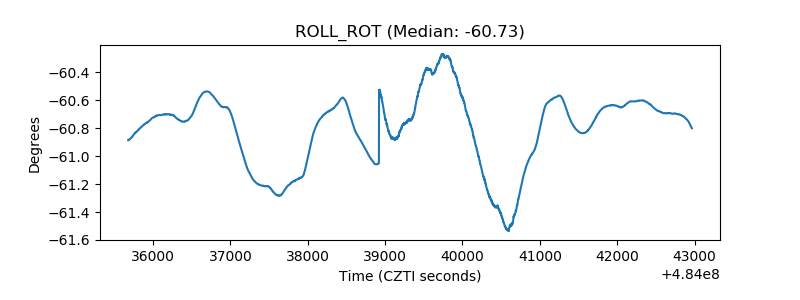 |
| _Roll_DEC | 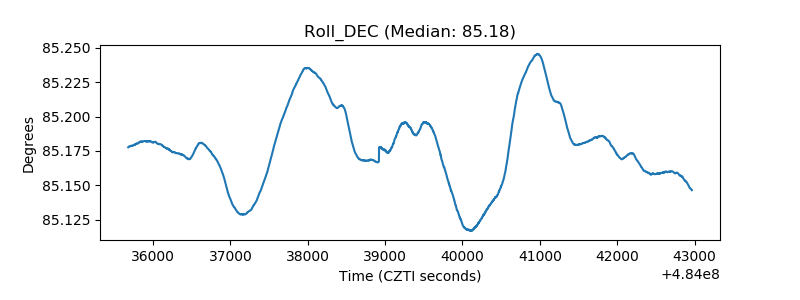 |
| _Roll_RA | 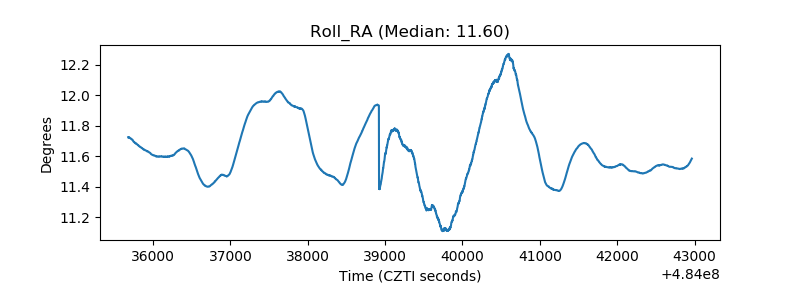 |
| Veto Counter | 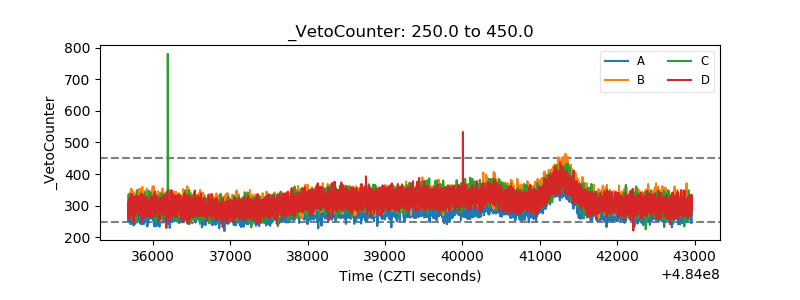 |