| Param | Original file | Final file |
|---|---|---|
| Filename | modeM0/AS1C09_011T05_9000006466_51926cztM0_level2.fits | modeM0/AS1C09_011T05_9000006466_51926cztM0_level2_quad_clean.evt |
| Size (bytes) | 1,072,990,080 | 69,022,080 |
| Size | 1023.3 MB | 65.8 MB |
| Events in quadrant A | 8,830,547 | 476,394 |
| Events in quadrant B | 8,968,367 | 433,678 |
| Events in quadrant C | 10,061,916 | 396,369 |
| Events in quadrant D | 11,362,627 | 333,954 |
| Mode SS | |||
|---|---|---|---|
| Quadrant | BADHDUFLAG | Total packets | Discarded packets |
| A | 0 | 130 | 0 |
| B | 0 | 130 | 0 |
| C | 0 | 130 | 0 |
| D | 0 | 130 | 0 |
| Mode M0 | |||
|---|---|---|---|
| Quadrant | BADHDUFLAG | Total packets | Discarded packets |
| A | 0 | 30741 | 1 |
| B | 0 | 31096 | 1 |
| C | 0 | 34375 | 1 |
| D | 0 | 38203 | 1 |
| Mode M9 | |||
|---|---|---|---|
| Quadrant | BADHDUFLAG | Total packets | Discarded packets |
| A | 0 | 9 | 0 |
| B | 0 | 9 | 0 |
| C | 0 | 9 | 0 |
| D | 0 | 9 | 0 |
| Quadrant | Total seconds | Saturated seconds | Saturation percentage |
|---|---|---|---|
| A | 6432 | 1651 | 25.668532% |
| B | 6433 | 2365 | 36.763563% |
| C | 6433 | 2560 | 39.794808% |
| D | 6432 | 2868 | 44.589552% |
Noise dominated data is calculated using 1-second bins in cleaned event files. If a bin has >2000 counts, and if more than 50% of those come from <1% of pixels, then it is considered to be noise-dominated and hence unusable.
| Quadrant | # 1 sec bins | Bins with >0 counts | Bins with >2000 counts | High rate bins dominated by noise | Noise dominated (total time) | Noise dominated (detector-on time) | Marked lightcurve |
|---|---|---|---|---|---|---|---|
| A | 7321 | 6431 | 1562 | 1562 | 21.34% | 24.29% | 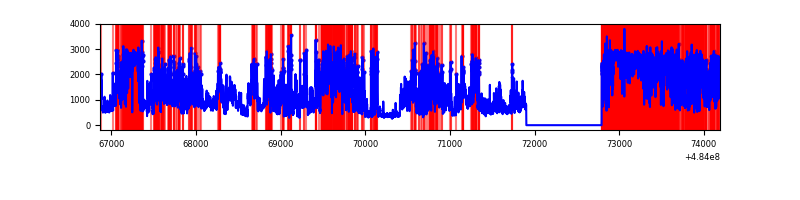 |
| B | 7323 | 6433 | 2085 | 2085 | 28.47% | 32.41% | 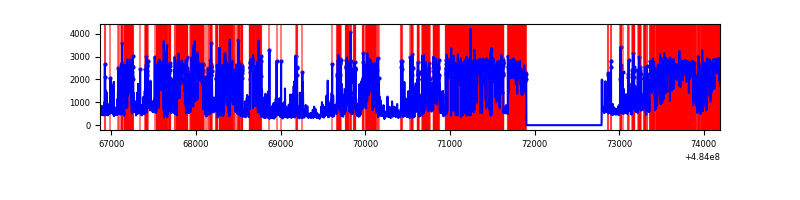 |
| C | 7322 | 6432 | 2307 | 2307 | 31.51% | 35.87% | 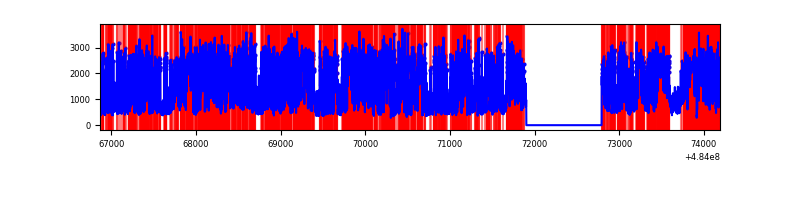 |
| D | 7322 | 6432 | 2895 | 2895 | 39.54% | 45.01% | 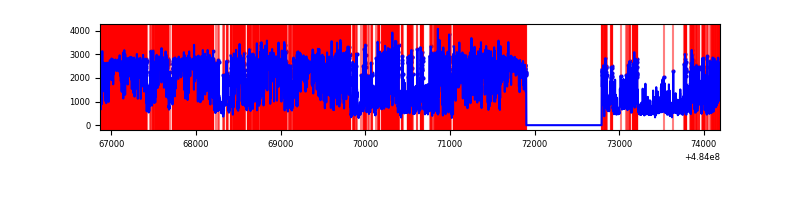 |
Top three noisy pixels from each quadrant. If the there are fewer than three noisy pixels in the level2.evt file, extra rows are filled as -1
| Pixel properties | Quadrant properties | ||||||
|---|---|---|---|---|---|---|---|
| Quadrant | DetID | PixID | Counts | Sigma | Mean | Median | Sigma |
| A | 4 | 95 | 3798084 | 25214.95 | 601 | 586 | 150.6 |
| A | 12 | 3 | 1610249 | 10687.98 | 601 | 586 | 150.6 |
| A | 7 | 64 | 237634 | 1573.97 | 601 | 586 | 150.6 |
| B | 10 | 44 | 2950478 | 24943.39 | 550 | 531 | 118.3 |
| B | 4 | 206 | 2753469 | 23277.57 | 550 | 531 | 118.3 |
| B | 12 | 32 | 303967 | 2565.71 | 550 | 531 | 118.3 |
| C | 15 | 224 | 5171137 | 33121.32 | 553 | 548 | 156.1 |
| C | 15 | 218 | 808031 | 5172.51 | 553 | 548 | 156.1 |
| C | 0 | 193 | 524358 | 3355.38 | 553 | 548 | 156.1 |
| D | 12 | 17 | 6000475 | 39922.59 | 521 | 499 | 150.3 |
| D | 2 | 172 | 1366371 | 9088.23 | 521 | 499 | 150.3 |
| D | 6 | 42 | 1060536 | 7053.27 | 521 | 499 | 150.3 |
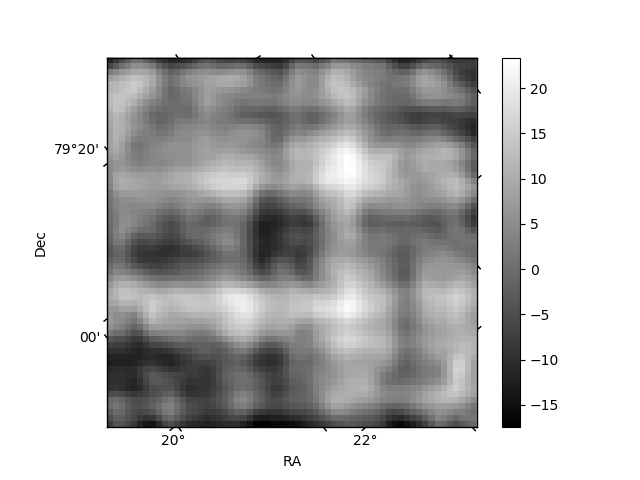
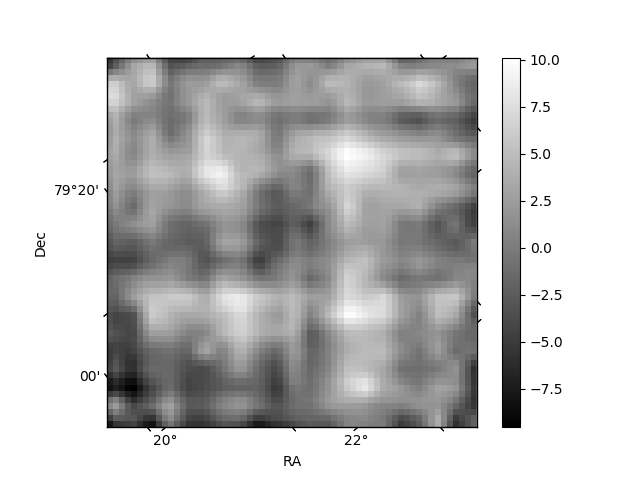
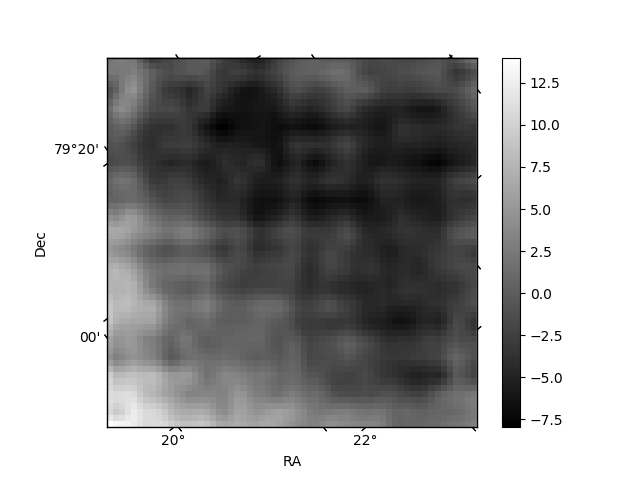
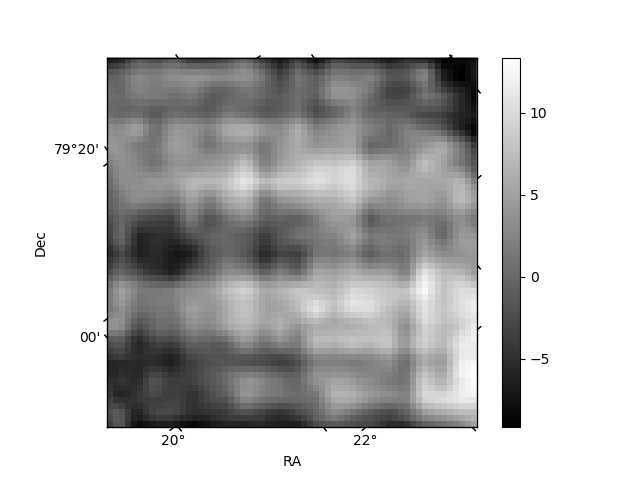
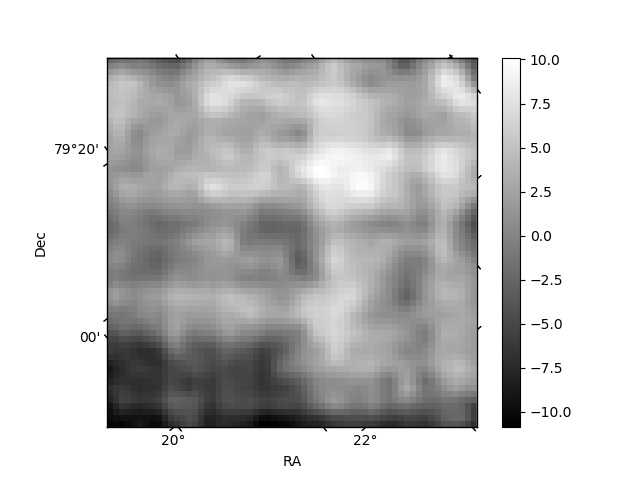
Histogram calculated using DETX and DETY for each event in the final _common_clean file
| Quadrant A | 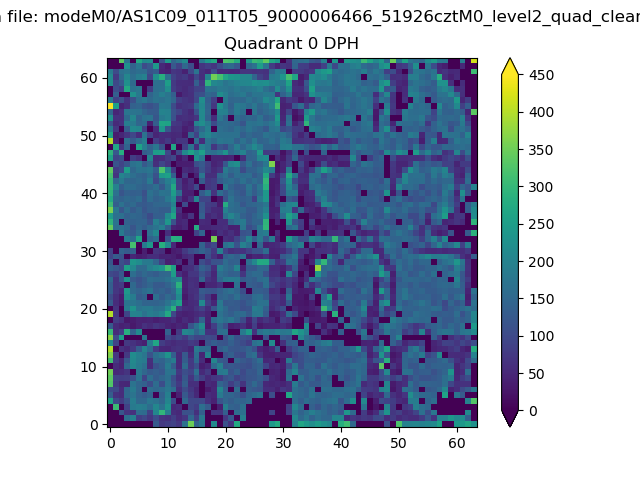 |
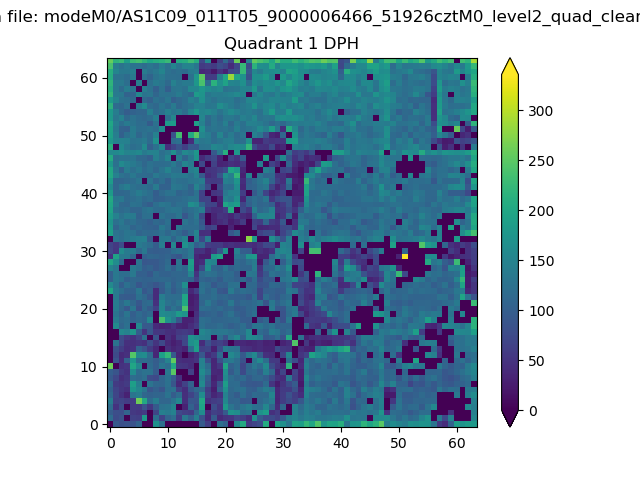 |
Quadrant B |
|---|---|---|---|
| Quadrant D | 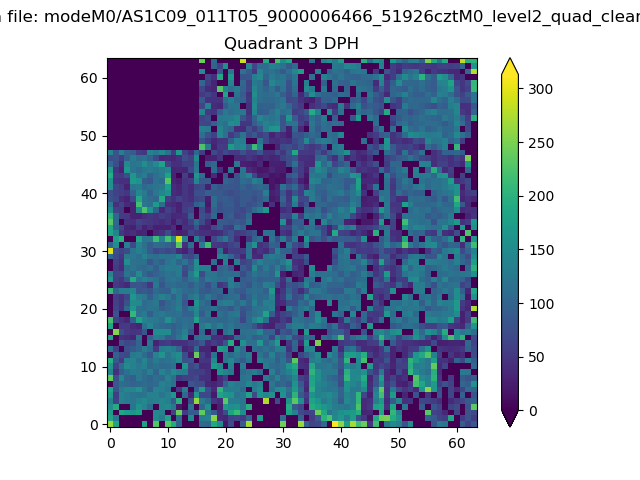 |
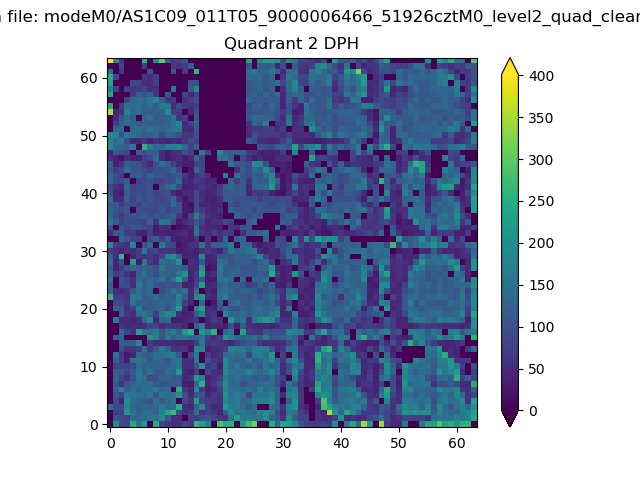 |
Quadrant C |
| Plot type | Count rate plots | Images |
|---|---|---|
| Comparison with Poisson distribution Blue bars denote a histogram of data divided into 1 sec bins. Red curve is a Poisson curve with rate = median count rate of data. |
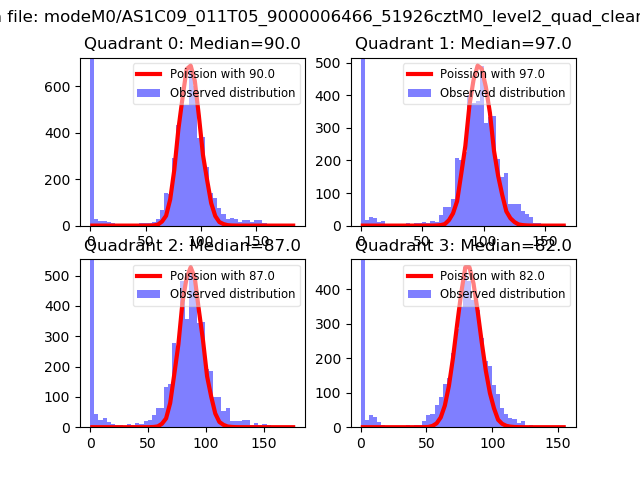 |
 |
| Quadrant-wise count rates Data is divided into 100 sec bins |
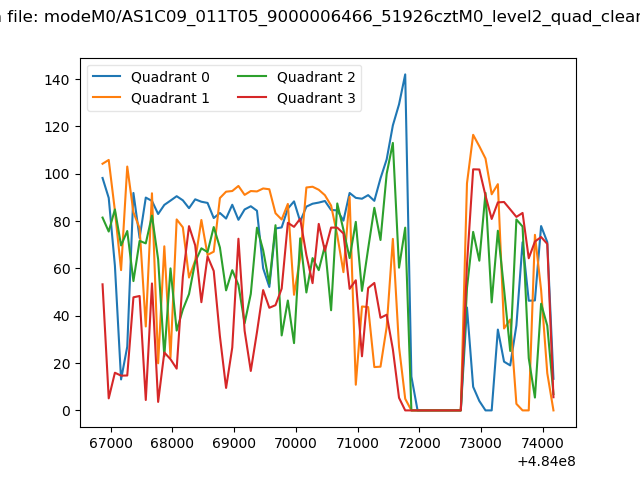 |
|
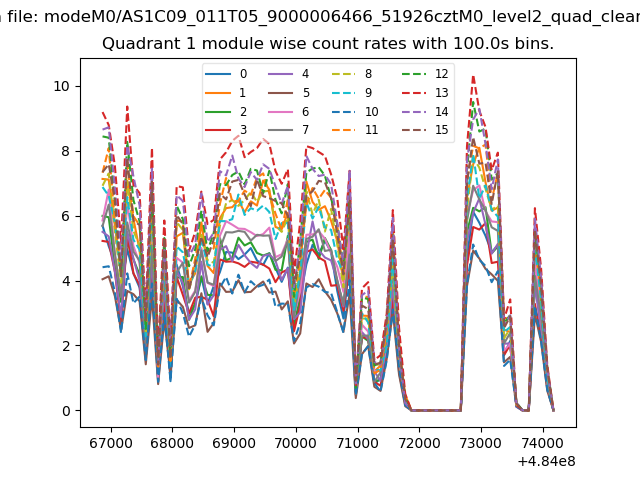
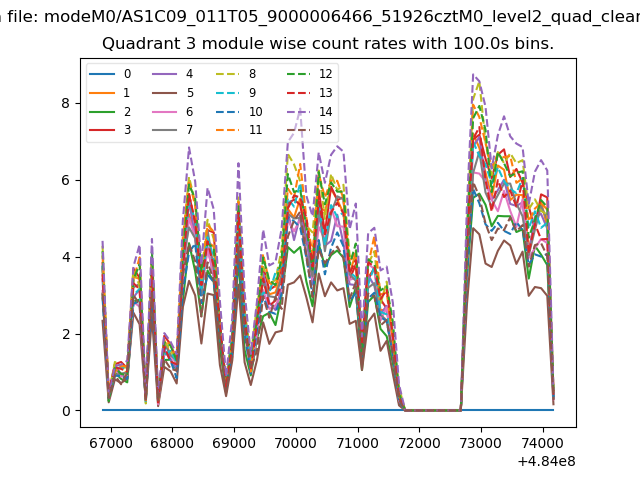
| Module-wise count rates for Quadrant A Data is divided into 100 sec bins |
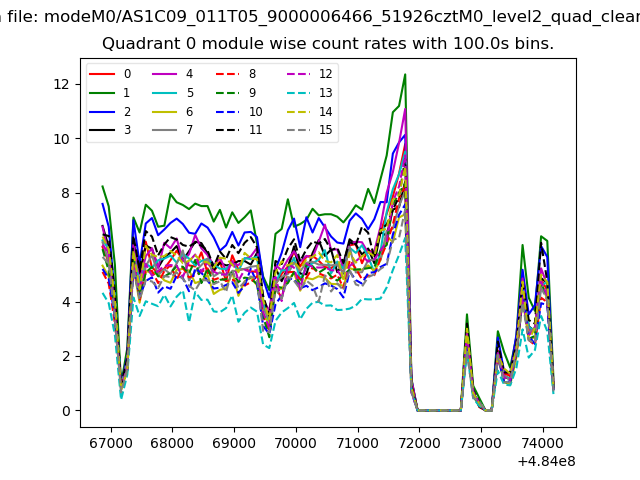 |
 |
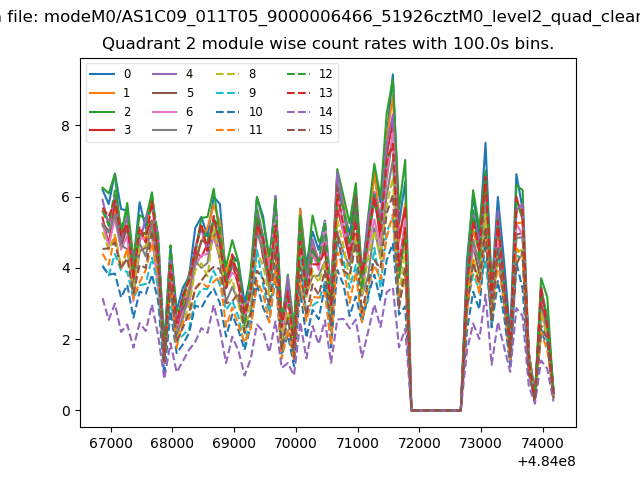
| Module-wise count rates for Quadrant B Data is divided into 100 sec bins |
 |
 |
| Module-wise count rates for Quadrant C Data is divided into 100 sec bins |
 |
 |
| Module-wise count rates for Quadrant D Data is divided into 100 sec bins |
 |
 |
| Parameter | Plot |
|---|---|
| CZT HV Monitor | 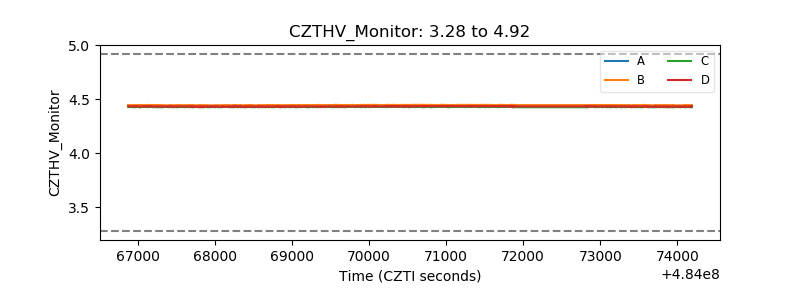 |
| D_VDD | 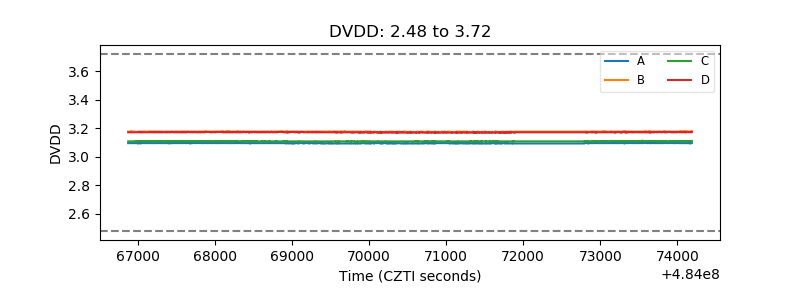 |
| Temperature 1 | 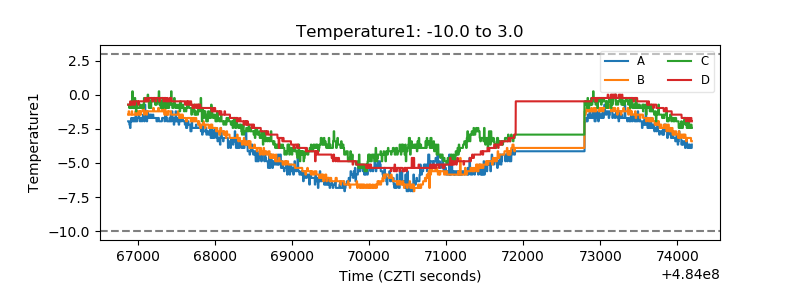 |
| Veto HV Monitor | 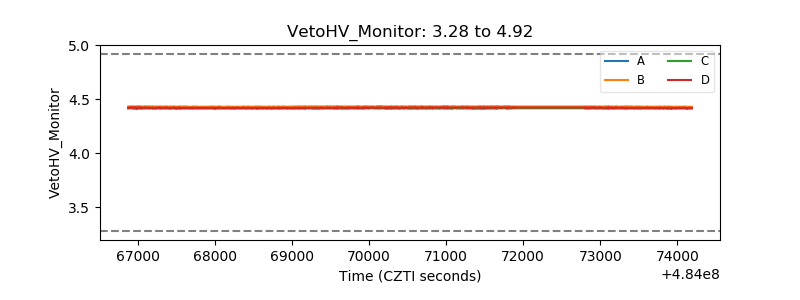 |
| Veto LLD | 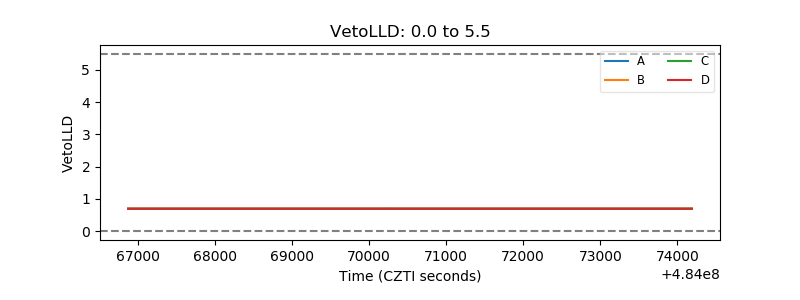 |
| Alpha Counter | 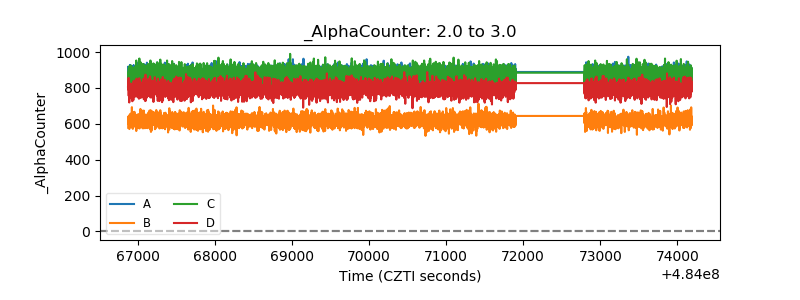 |
| _CPM_Rate | 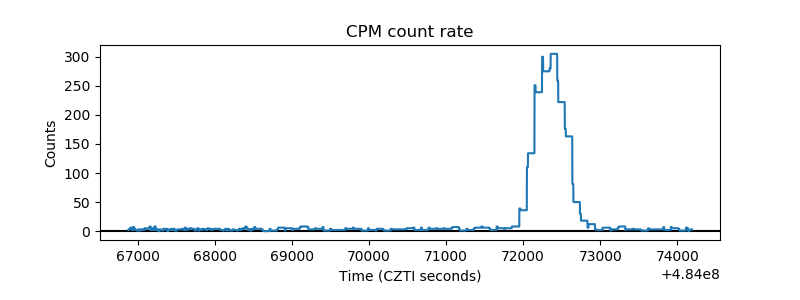 |
| CZT Counter | 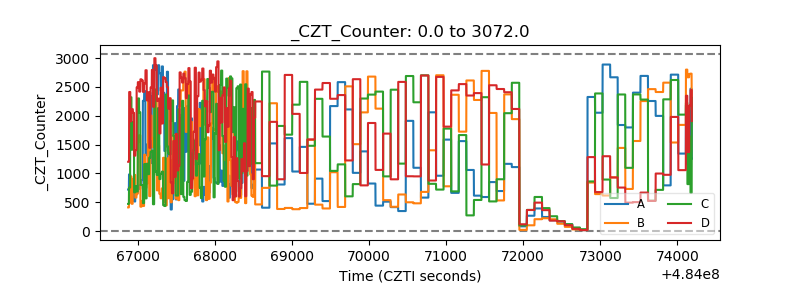 |
| +2.5 Volts monitor | 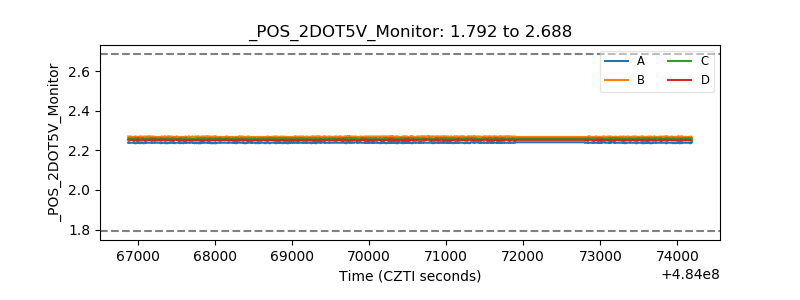 |
| +5 Volts monitor | 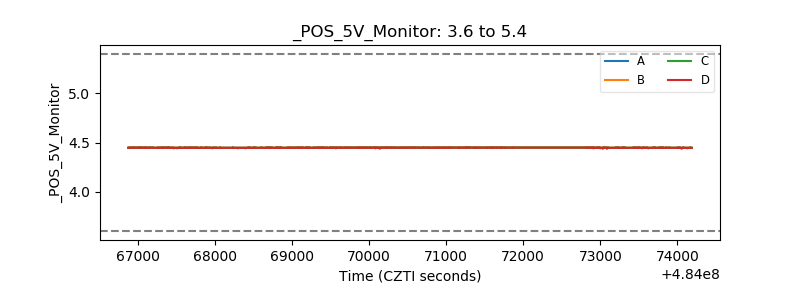 |
| _ROLL_ROT | 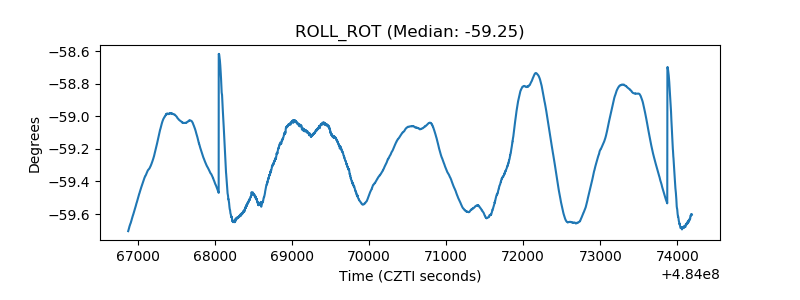 |
| _Roll_DEC | 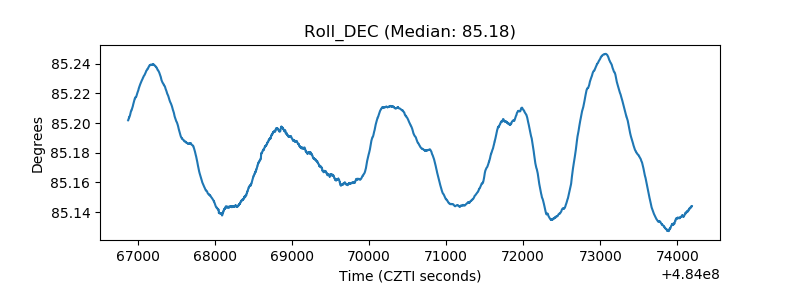 |
| _Roll_RA | 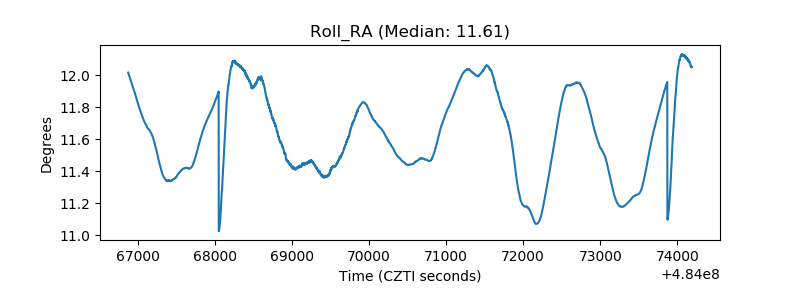 |
| Veto Counter | 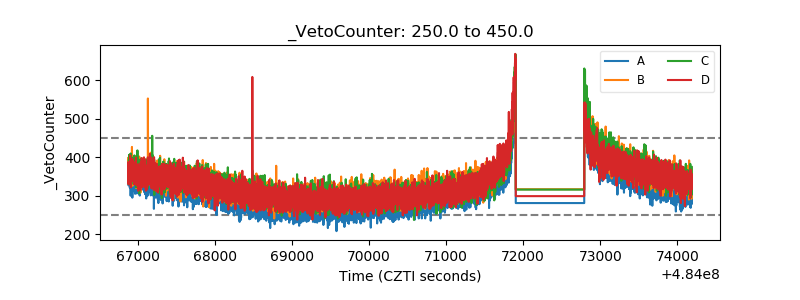 |