| Param | Original file | Final file |
|---|---|---|
| Filename | modeM0/AS1C09_011T05_9000006466_51928cztM0_level2.fits | modeM0/AS1C09_011T05_9000006466_51928cztM0_level2_quad_clean.evt |
| Size (bytes) | 1,058,253,120 | 66,928,320 |
| Size | 1009.2 MB | 63.8 MB |
| Events in quadrant A | 9,695,712 | 419,134 |
| Events in quadrant B | 7,615,107 | 521,603 |
| Events in quadrant C | 9,474,677 | 380,907 |
| Events in quadrant D | 11,903,741 | 266,149 |
| Mode SS | |||
|---|---|---|---|
| Quadrant | BADHDUFLAG | Total packets | Discarded packets |
| A | 0 | 126 | 0 |
| B | 0 | 126 | 0 |
| C | 0 | 126 | 0 |
| D | 0 | 126 | 0 |
| Mode M0 | |||
|---|---|---|---|
| Quadrant | BADHDUFLAG | Total packets | Discarded packets |
| A | 0 | 33180 | 8 |
| B | 0 | 26948 | 1 |
| C | 0 | 32533 | 1 |
| D | 0 | 39676 | 1 |
| Mode M9 | |||
|---|---|---|---|
| Quadrant | BADHDUFLAG | Total packets | Discarded packets |
| A | 0 | 11 | 0 |
| B | 0 | 11 | 0 |
| C | 0 | 11 | 0 |
| D | 0 | 11 | 0 |
| Quadrant | Total seconds | Saturated seconds | Saturation percentage |
|---|---|---|---|
| A | 6282 | 2189 | 34.845591% |
| B | 6282 | 1492 | 23.750398% |
| C | 6283 | 2584 | 41.126850% |
| D | 6283 | 3544 | 56.406175% |
Noise dominated data is calculated using 1-second bins in cleaned event files. If a bin has >2000 counts, and if more than 50% of those come from <1% of pixels, then it is considered to be noise-dominated and hence unusable.
| Quadrant | # 1 sec bins | Bins with >0 counts | Bins with >2000 counts | High rate bins dominated by noise | Noise dominated (total time) | Noise dominated (detector-on time) | Marked lightcurve |
|---|---|---|---|---|---|---|---|
| A | 7297 | 6283 | 2008 | 2008 | 27.52% | 31.96% | 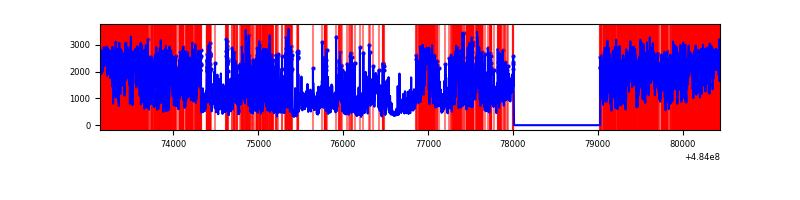 |
| B | 7297 | 6283 | 1308 | 1308 | 17.93% | 20.82% | 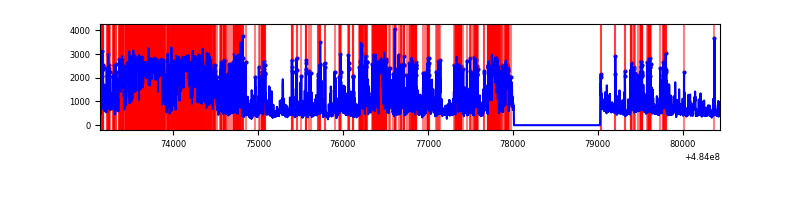 |
| C | 7298 | 6284 | 2093 | 2093 | 28.68% | 33.31% | 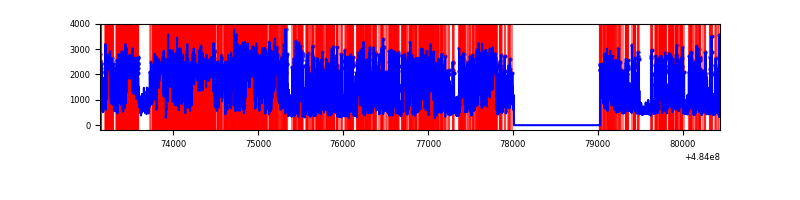 |
| D | 7298 | 6283 | 3457 | 3457 | 47.37% | 55.02% |  |
Top three noisy pixels from each quadrant. If the there are fewer than three noisy pixels in the level2.evt file, extra rows are filled as -1
| Pixel properties | Quadrant properties | ||||||
|---|---|---|---|---|---|---|---|
| Quadrant | DetID | PixID | Counts | Sigma | Mean | Median | Sigma |
| A | 4 | 95 | 3000158 | 20979.76 | 574 | 562 | 143.0 |
| A | 7 | 64 | 1880023 | 13145.32 | 574 | 562 | 143.0 |
| A | 12 | 3 | 1412947 | 9878.5 | 574 | 562 | 143.0 |
| B | 4 | 206 | 1702363 | 13534.05 | 594 | 575 | 125.7 |
| B | 10 | 44 | 1544436 | 12278.09 | 594 | 575 | 125.7 |
| B | 12 | 32 | 1414602 | 11245.54 | 594 | 575 | 125.7 |
| C | 15 | 224 | 4415786 | 29723.83 | 530 | 525 | 148.5 |
| C | 15 | 198 | 1120806 | 7541.81 | 530 | 525 | 148.5 |
| C | 15 | 218 | 515550 | 3467.18 | 530 | 525 | 148.5 |
| D | 12 | 17 | 6988416 | 55498.36 | 440 | 421 | 125.9 |
| D | 6 | 42 | 2055499 | 16321.34 | 440 | 421 | 125.9 |
| D | 3 | 12 | 258138 | 2046.78 | 440 | 421 | 125.9 |
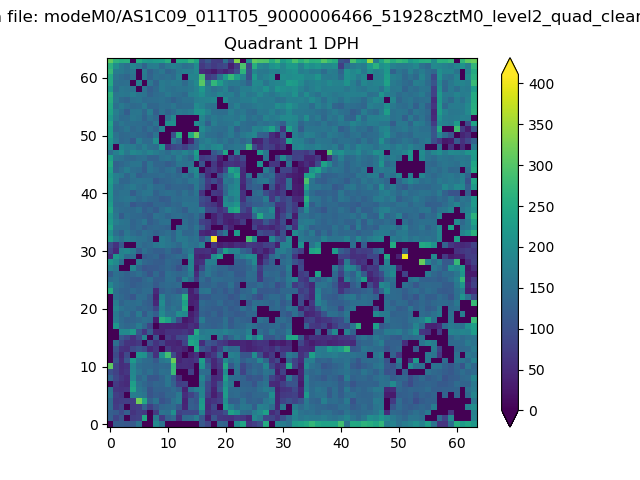
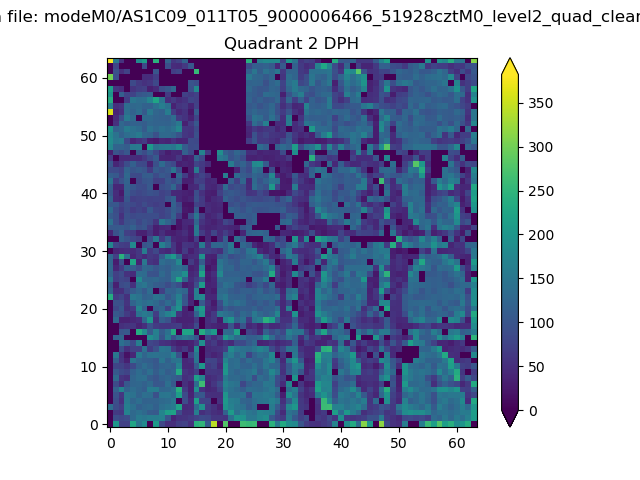
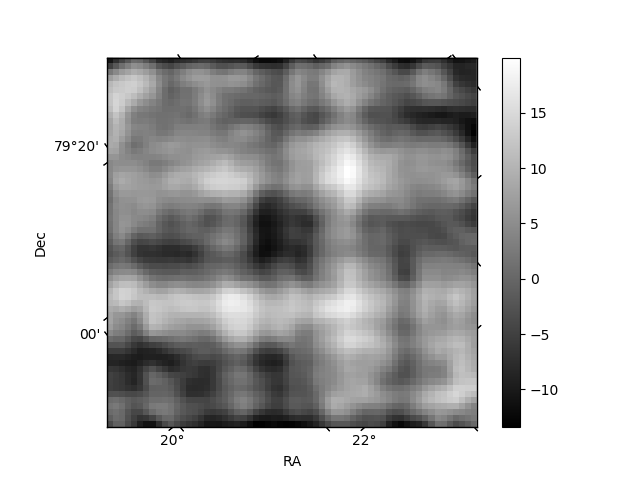
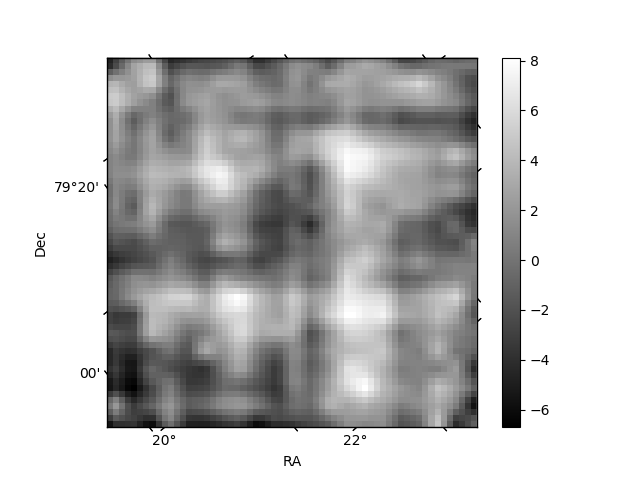
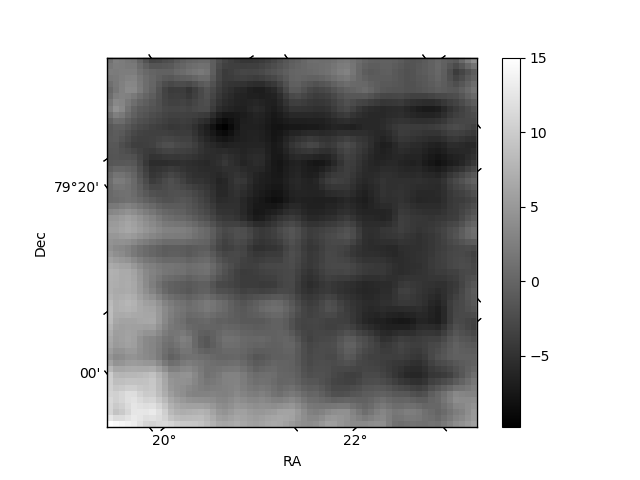
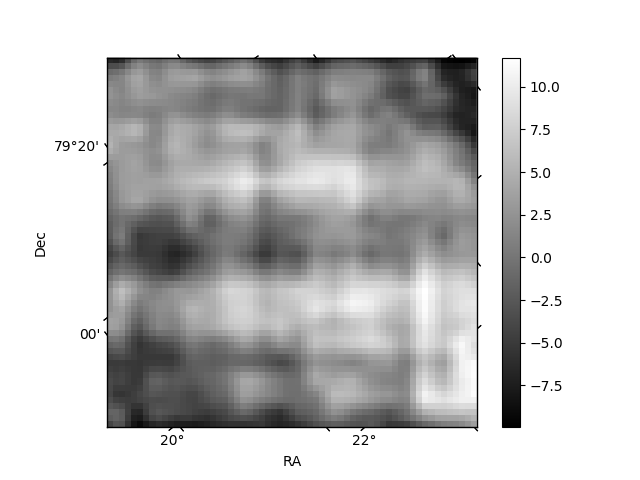
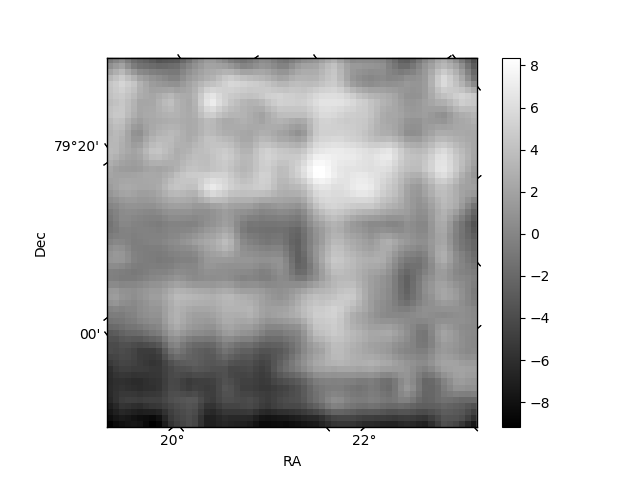
Histogram calculated using DETX and DETY for each event in the final _common_clean file
| Quadrant A | 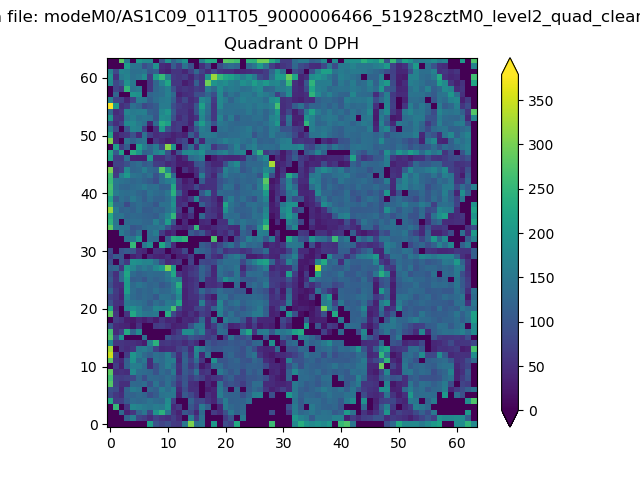 |
 |
Quadrant B |
|---|---|---|---|
| Quadrant D | 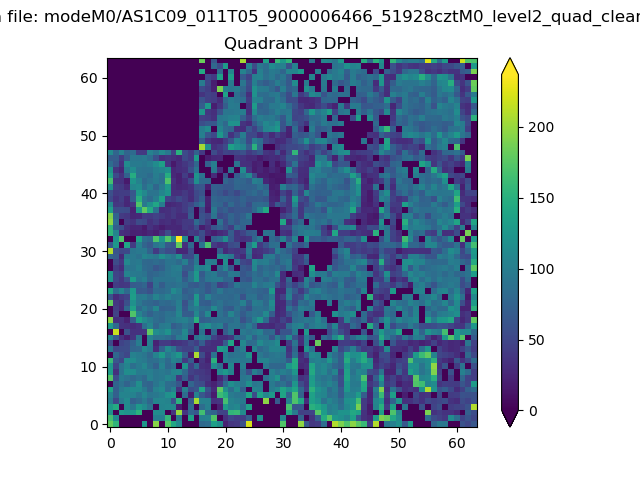 |
 |
Quadrant C |
| Plot type | Count rate plots | Images |
|---|---|---|
| Comparison with Poisson distribution Blue bars denote a histogram of data divided into 1 sec bins. Red curve is a Poisson curve with rate = median count rate of data. |
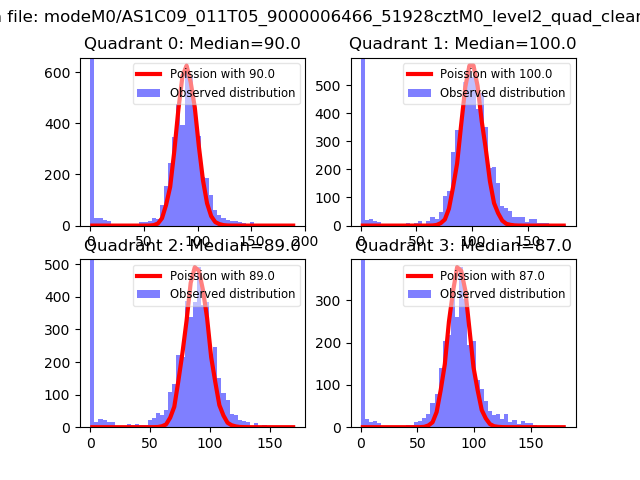 |
 |
| Quadrant-wise count rates Data is divided into 100 sec bins |
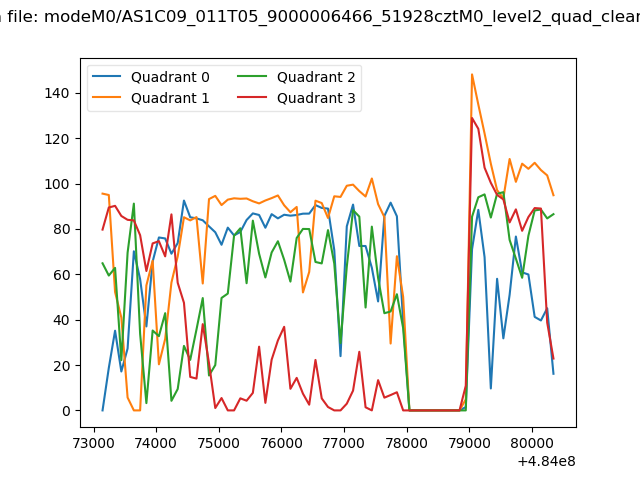 |
|
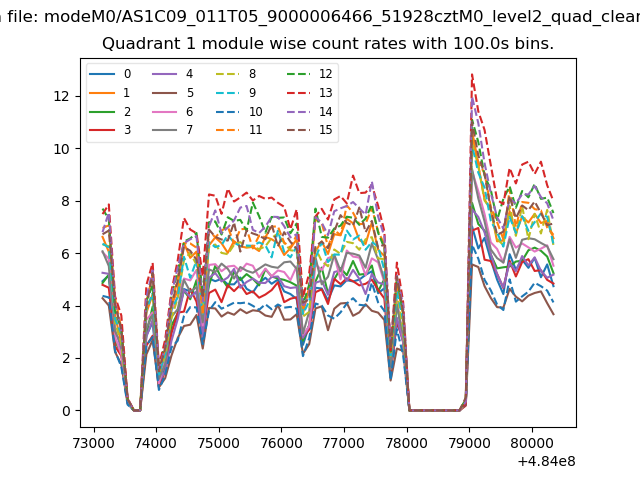
| Module-wise count rates for Quadrant A Data is divided into 100 sec bins |
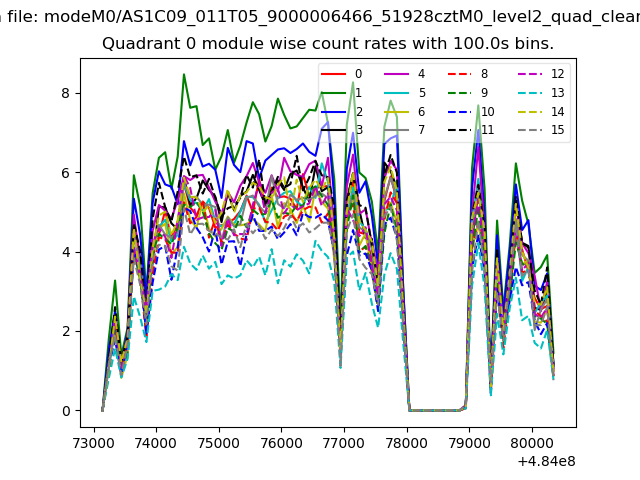 |
 |
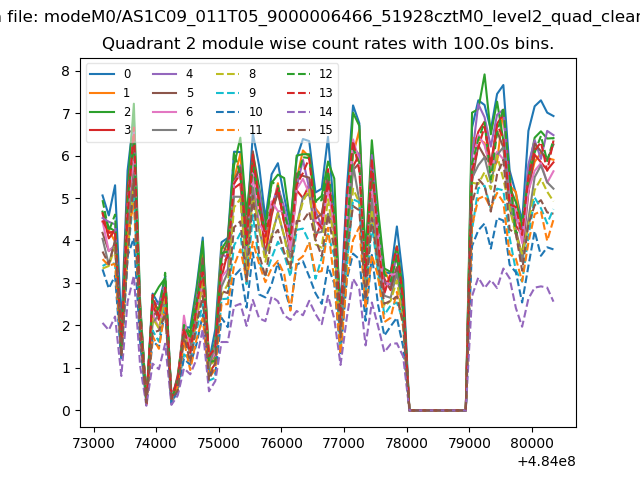
| Module-wise count rates for Quadrant B Data is divided into 100 sec bins |
 |
 |
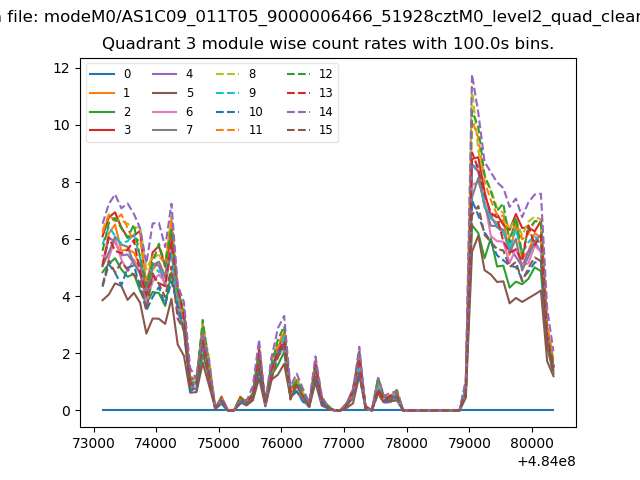
| Module-wise count rates for Quadrant C Data is divided into 100 sec bins |
 |
 |
| Module-wise count rates for Quadrant D Data is divided into 100 sec bins |
 |
 |
| Parameter | Plot |
|---|---|
| CZT HV Monitor | 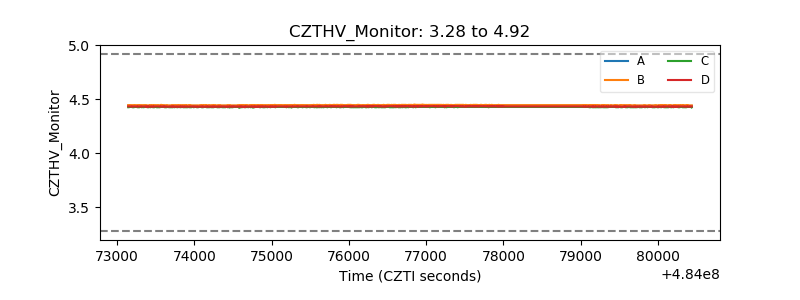 |
| D_VDD | 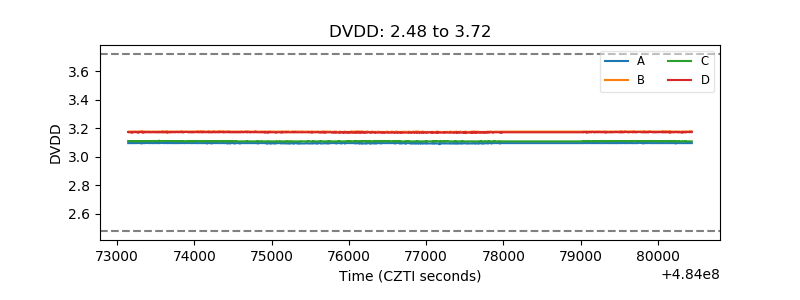 |
| Temperature 1 |  |
| Veto HV Monitor | 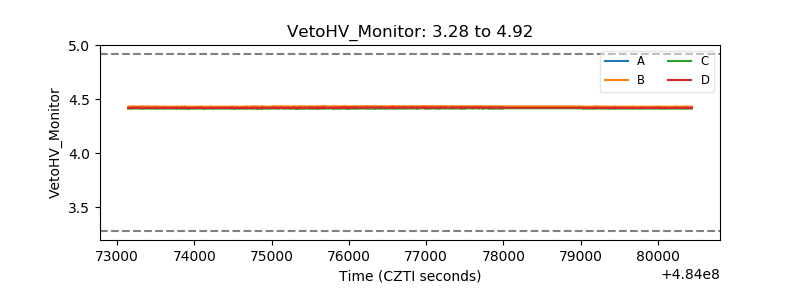 |
| Veto LLD | 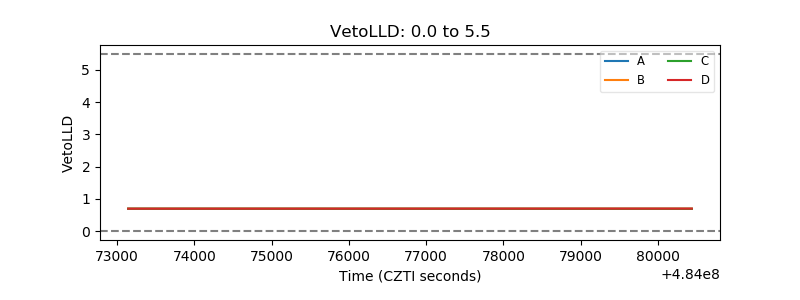 |
| Alpha Counter | 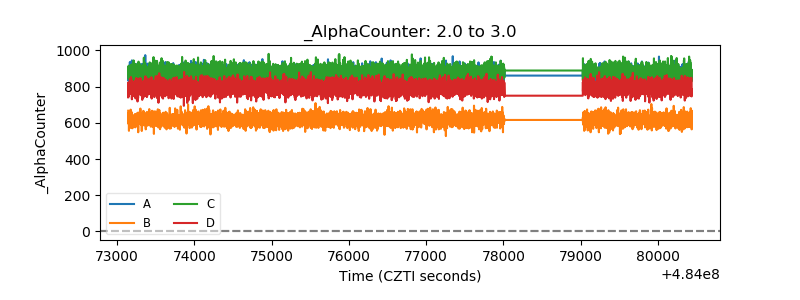 |
| _CPM_Rate | 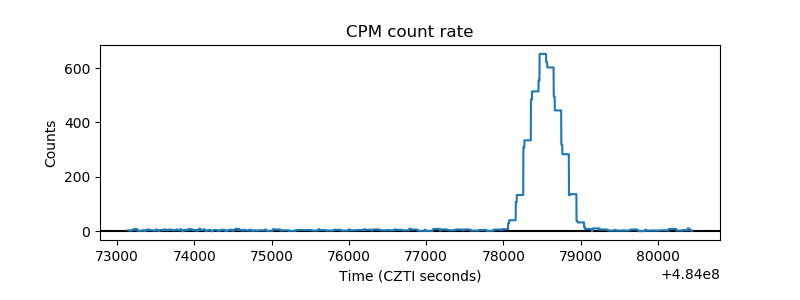 |
| CZT Counter | 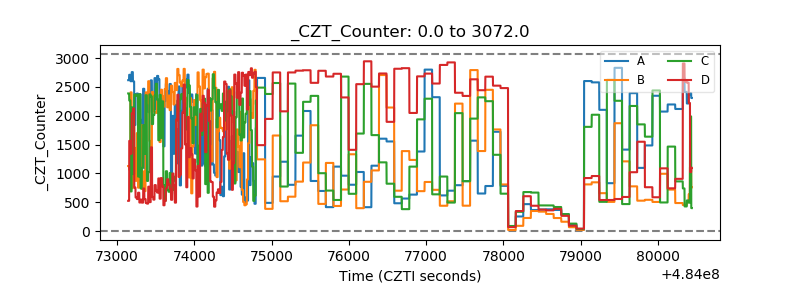 |
| +2.5 Volts monitor | 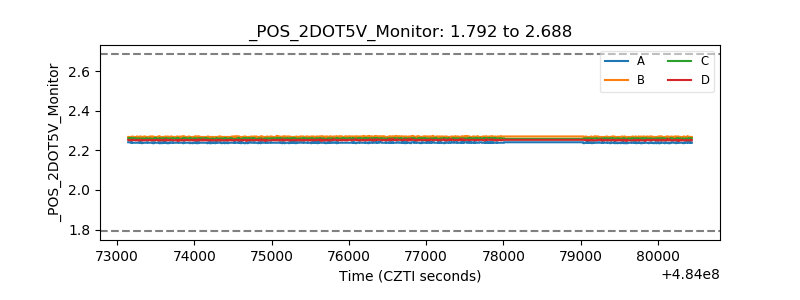 |
| +5 Volts monitor | 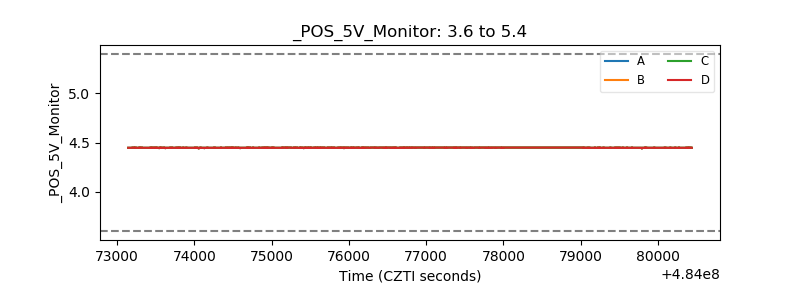 |
| _ROLL_ROT | 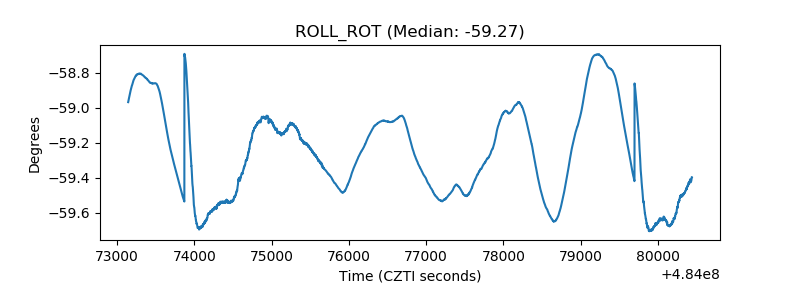 |
| _Roll_DEC | 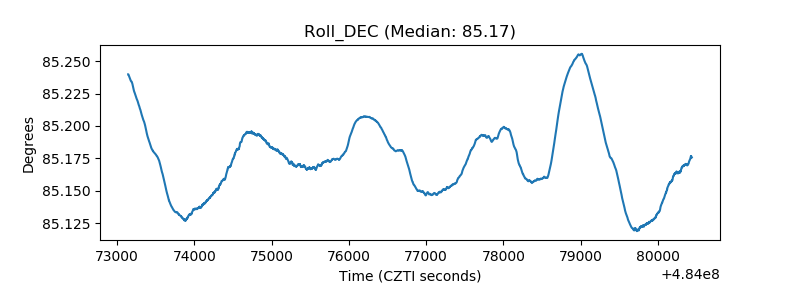 |
| _Roll_RA | 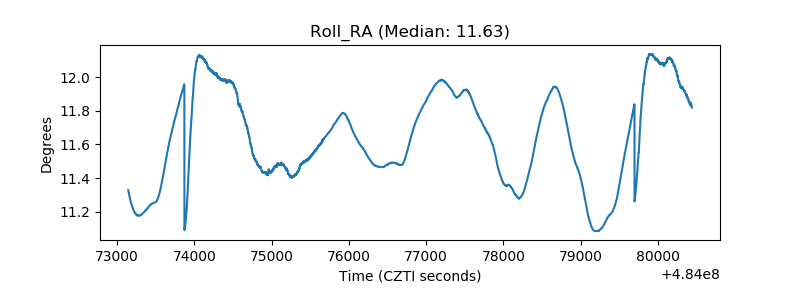 |
| Veto Counter | 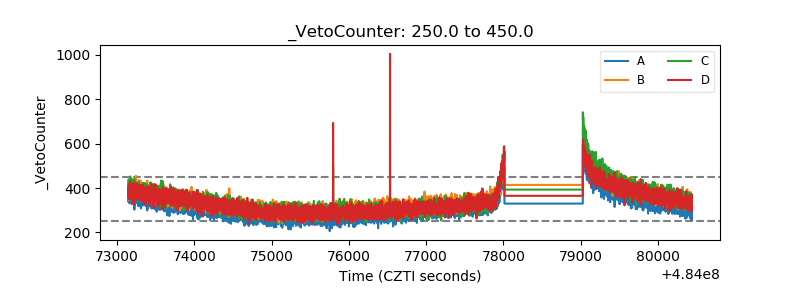 |