| Param | Original file | Final file |
|---|---|---|
| Filename | modeM0/AS1C09_011T05_9000006466_51929cztM0_level2.fits | modeM0/AS1C09_011T05_9000006466_51929cztM0_level2_quad_clean.evt |
| Size (bytes) | 951,768,000 | 70,292,160 |
| Size | 907.7 MB | 67.0 MB |
| Events in quadrant A | 8,638,111 | 422,635 |
| Events in quadrant B | 6,231,333 | 560,392 |
| Events in quadrant C | 7,099,136 | 508,537 |
| Events in quadrant D | 12,783,889 | 203,324 |
| Mode SS | |||
|---|---|---|---|
| Quadrant | BADHDUFLAG | Total packets | Discarded packets |
| A | 0 | 126 | 0 |
| B | 0 | 126 | 0 |
| C | 0 | 126 | 0 |
| D | 0 | 126 | 0 |
| Mode M0 | |||
|---|---|---|---|
| Quadrant | BADHDUFLAG | Total packets | Discarded packets |
| A | 0 | 29964 | 1 |
| B | 0 | 22785 | 1 |
| C | 0 | 25458 | 1 |
| D | 0 | 42270 | 1 |
| Mode M9 | |||
|---|---|---|---|
| Quadrant | BADHDUFLAG | Total packets | Discarded packets |
| A | 0 | 11 | 0 |
| B | 0 | 11 | 0 |
| C | 0 | 11 | 0 |
| D | 0 | 11 | 0 |
| Quadrant | Total seconds | Saturated seconds | Saturation percentage |
|---|---|---|---|
| A | 6202 | 1956 | 31.538213% |
| B | 6202 | 1060 | 17.091261% |
| C | 6202 | 1188 | 19.155111% |
| D | 6203 | 4171 | 67.241657% |
Noise dominated data is calculated using 1-second bins in cleaned event files. If a bin has >2000 counts, and if more than 50% of those come from <1% of pixels, then it is considered to be noise-dominated and hence unusable.
| Quadrant | # 1 sec bins | Bins with >0 counts | Bins with >2000 counts | High rate bins dominated by noise | Noise dominated (total time) | Noise dominated (detector-on time) | Marked lightcurve |
|---|---|---|---|---|---|---|---|
| A | 7321 | 6201 | 1781 | 1781 | 24.33% | 28.72% | 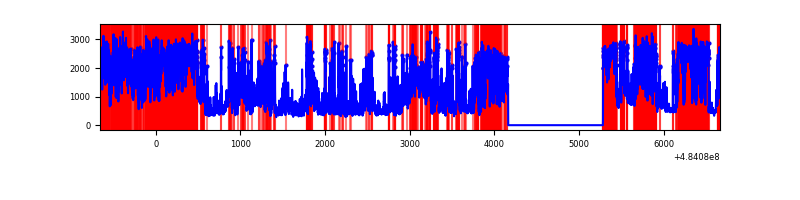 |
| B | 7321 | 6201 | 787 | 787 | 10.75% | 12.69% | 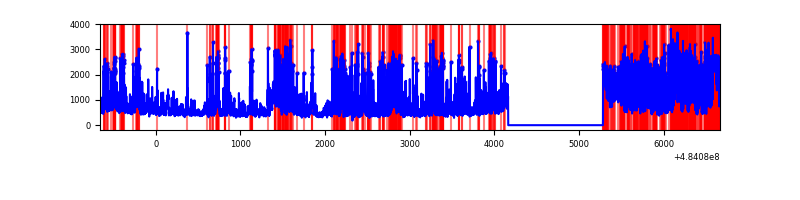 |
| C | 7322 | 6203 | 1073 | 1073 | 14.65% | 17.30% | 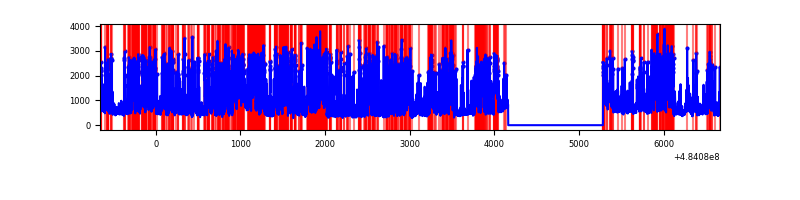 |
| D | 7322 | 6202 | 4065 | 4065 | 55.52% | 65.54% | 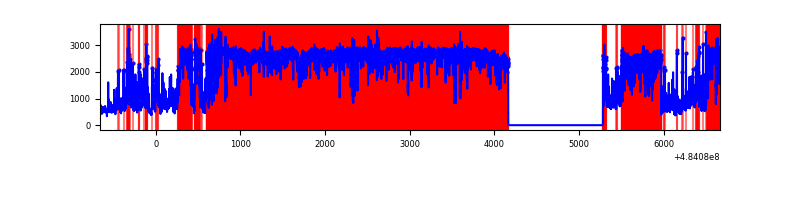 |
Top three noisy pixels from each quadrant. If the there are fewer than three noisy pixels in the level2.evt file, extra rows are filled as -1
| Pixel properties | Quadrant properties | ||||||
|---|---|---|---|---|---|---|---|
| Quadrant | DetID | PixID | Counts | Sigma | Mean | Median | Sigma |
| A | 7 | 64 | 2378166 | 16870.04 | 560 | 545 | 140.9 |
| A | 12 | 3 | 1322177 | 9377.43 | 560 | 545 | 140.9 |
| A | 4 | 95 | 1184363 | 8399.6 | 560 | 545 | 140.9 |
| B | 12 | 32 | 2316026 | 17907.15 | 606 | 586 | 129.3 |
| B | 4 | 206 | 557629 | 4308.06 | 606 | 586 | 129.3 |
| B | 4 | 171 | 225011 | 1735.66 | 606 | 586 | 129.3 |
| C | 15 | 224 | 3594732 | 21506.63 | 600 | 594 | 167.1 |
| C | 15 | 218 | 320577 | 1914.72 | 600 | 594 | 167.1 |
| C | 13 | 3 | 177046 | 1055.85 | 600 | 594 | 167.1 |
| D | 6 | 42 | 5093147 | 46694.02 | 374 | 357 | 109.1 |
| D | 12 | 17 | 4979965 | 45656.3 | 374 | 357 | 109.1 |
| D | 3 | 12 | 280886 | 2572.07 | 374 | 357 | 109.1 |
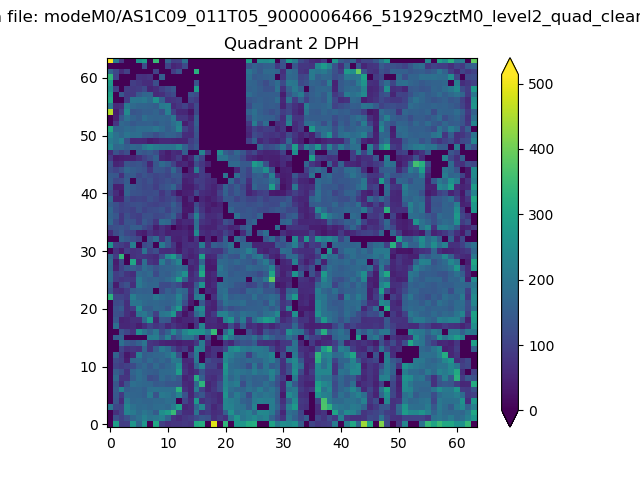
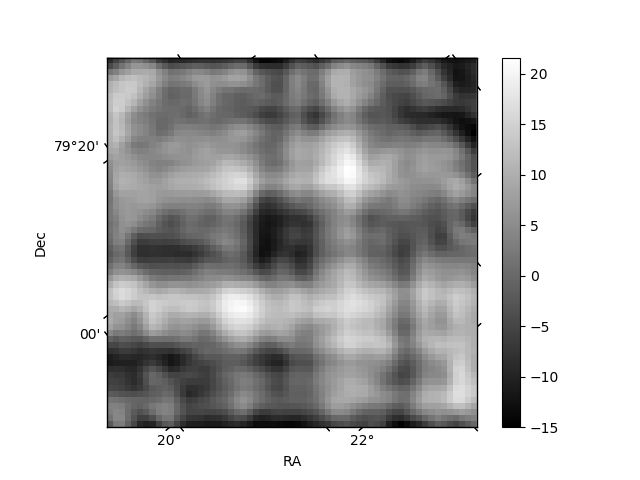
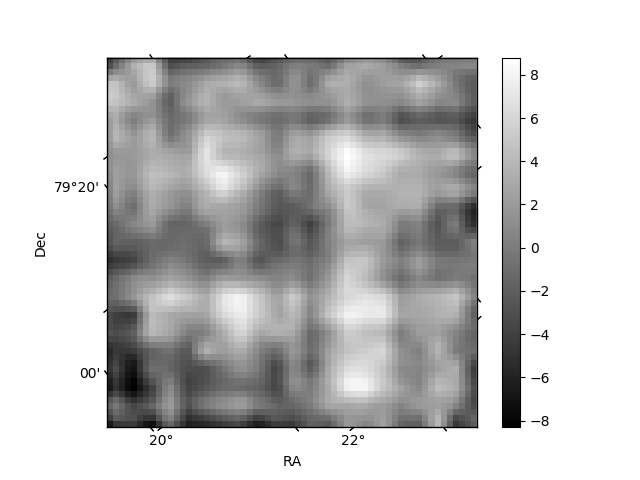
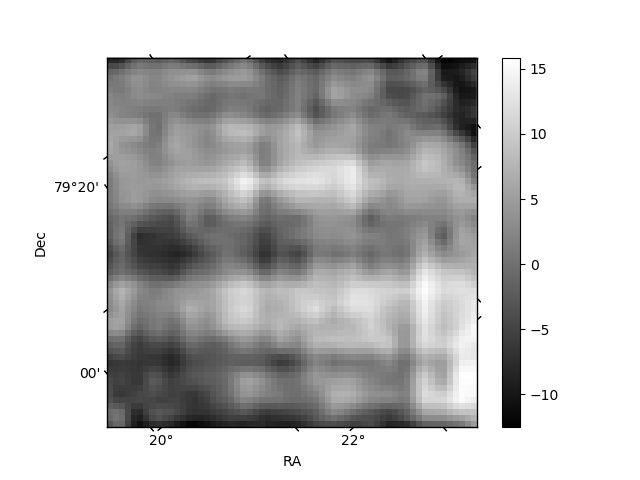
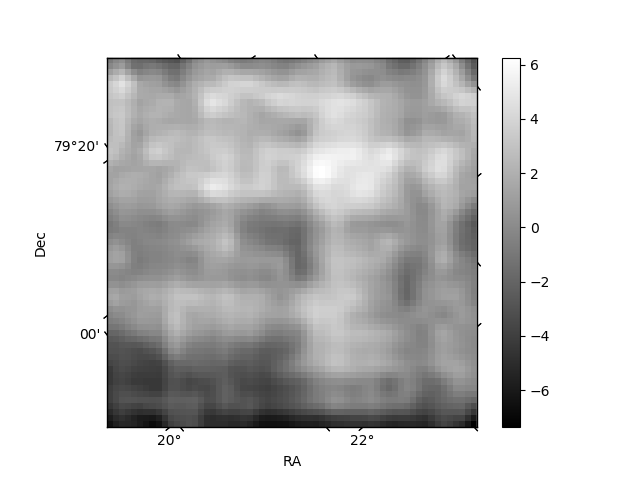
Histogram calculated using DETX and DETY for each event in the final _common_clean file
| Quadrant A | 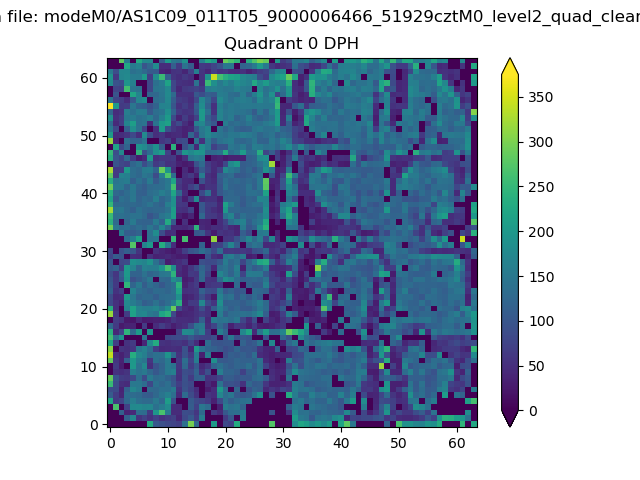 |
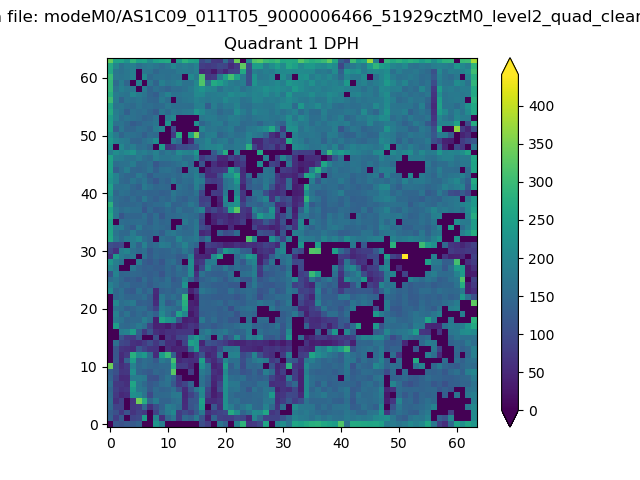 |
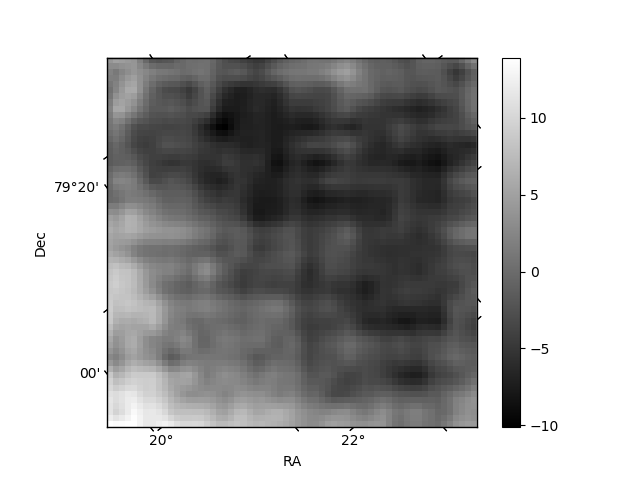
Quadrant B |
|---|---|---|---|
| Quadrant D | 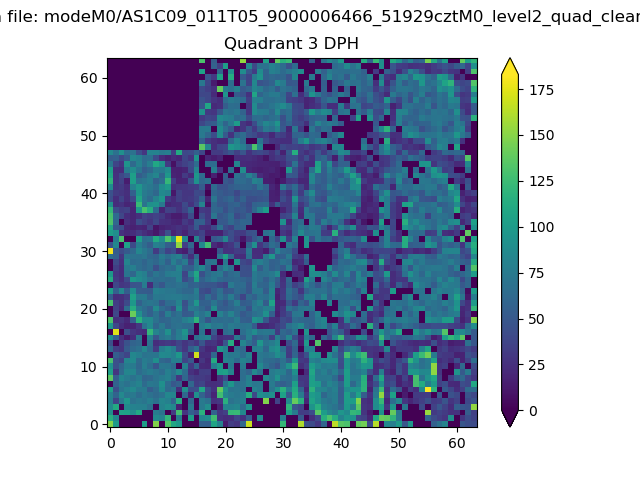 |
 |
Quadrant C |
| Plot type | Count rate plots | Images |
|---|---|---|
| Comparison with Poisson distribution Blue bars denote a histogram of data divided into 1 sec bins. Red curve is a Poisson curve with rate = median count rate of data. |
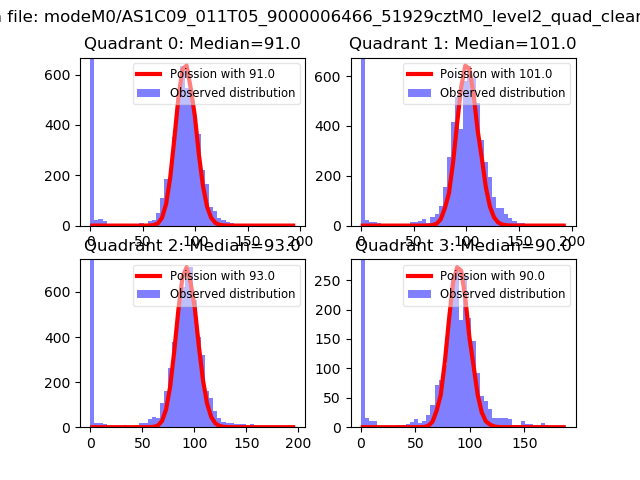 |
 |
| Quadrant-wise count rates Data is divided into 100 sec bins |
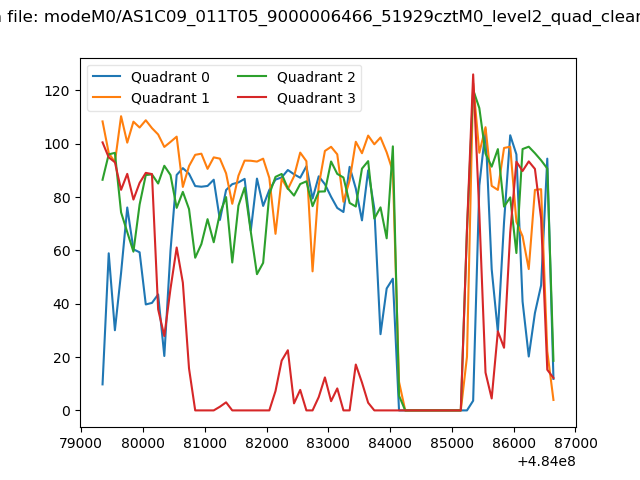 |
|
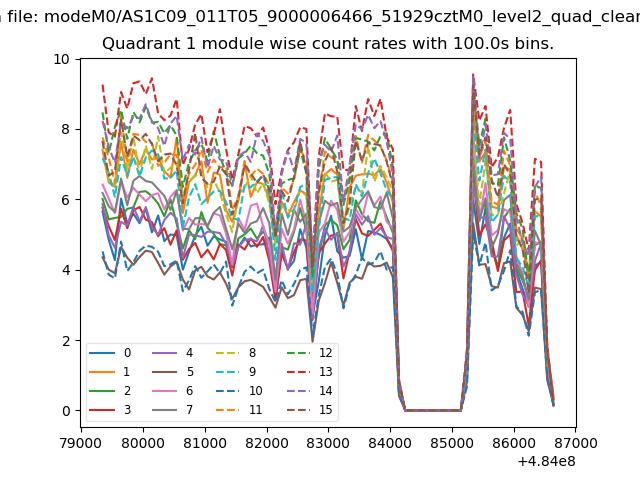
| Module-wise count rates for Quadrant A Data is divided into 100 sec bins |
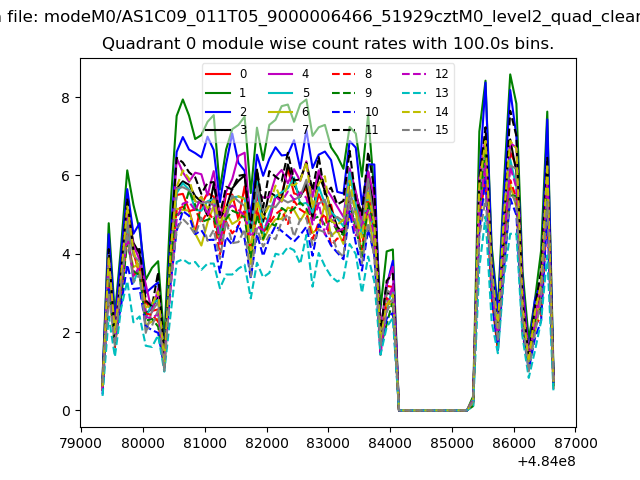 |
 |
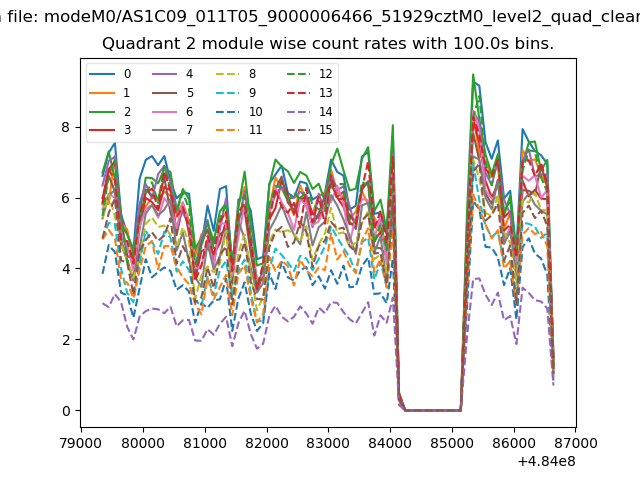
| Module-wise count rates for Quadrant B Data is divided into 100 sec bins |
 |
 |
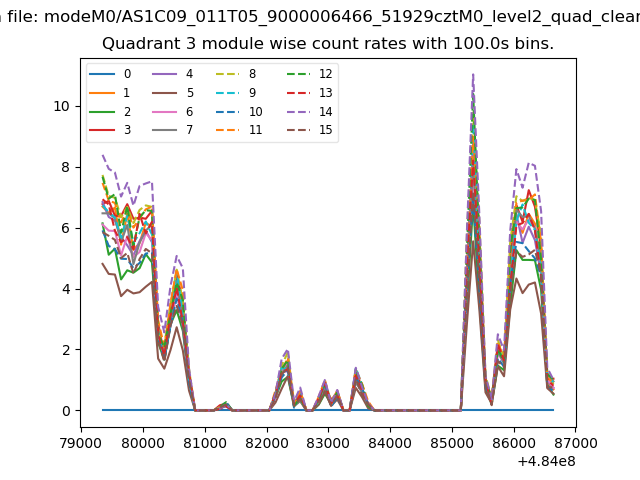
| Module-wise count rates for Quadrant C Data is divided into 100 sec bins |
 |
 |
| Module-wise count rates for Quadrant D Data is divided into 100 sec bins |
 |
 |
| Parameter | Plot |
|---|---|
| CZT HV Monitor | 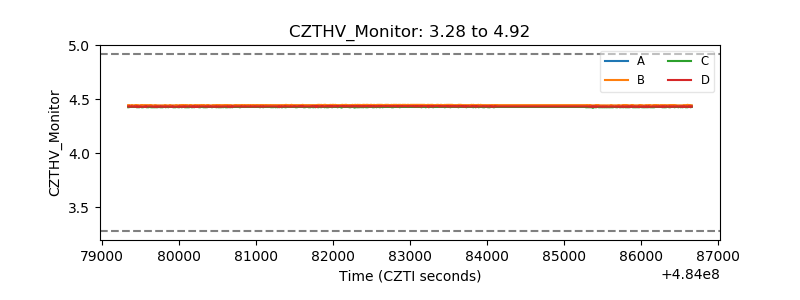 |
| D_VDD | 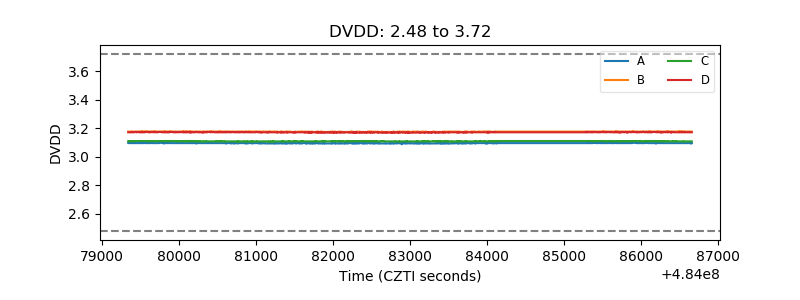 |
| Temperature 1 | 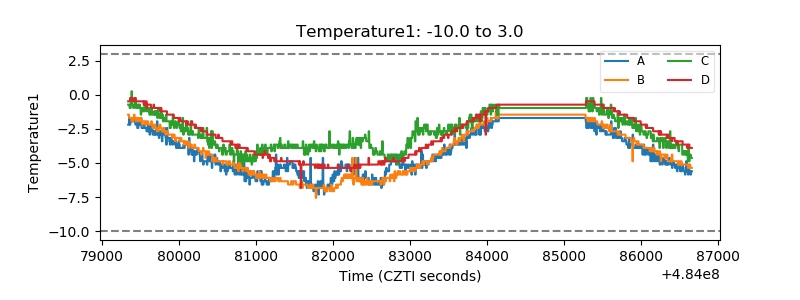 |
| Veto HV Monitor | 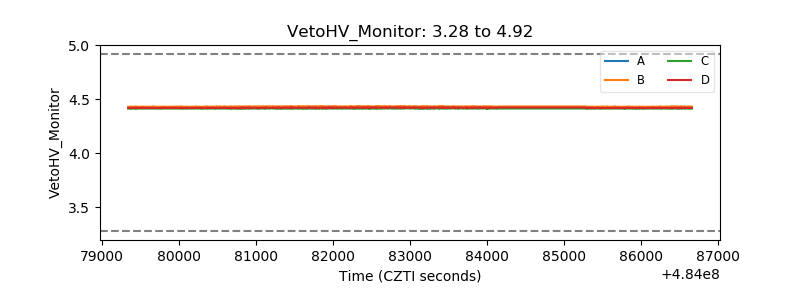 |
| Veto LLD | 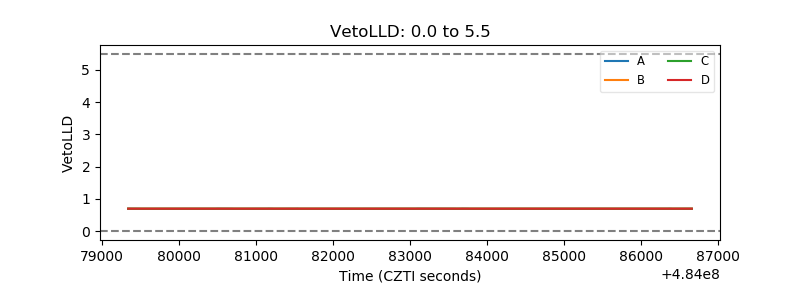 |
| Alpha Counter | 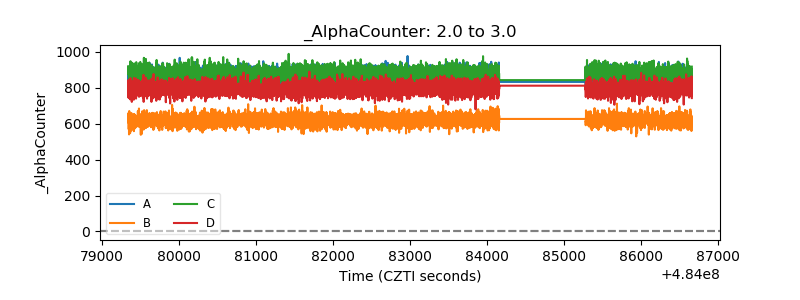 |
| _CPM_Rate | 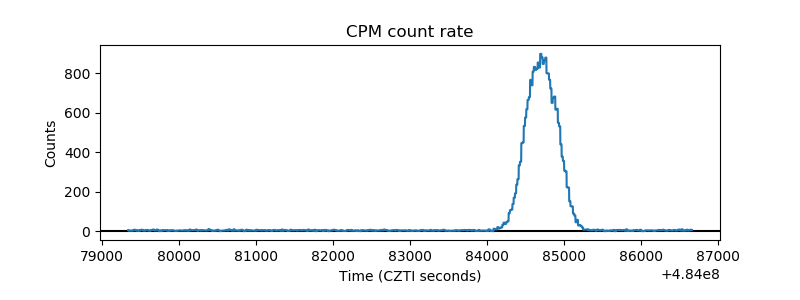 |
| CZT Counter | 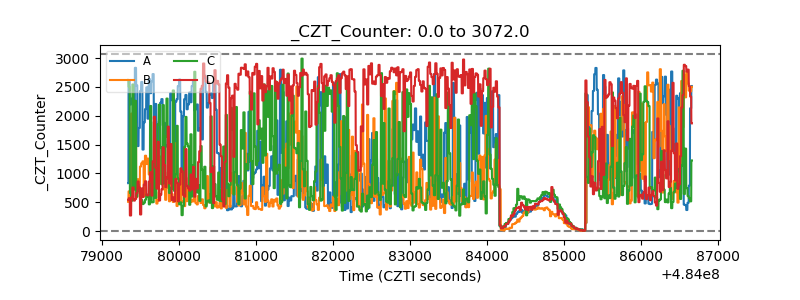 |
| +2.5 Volts monitor | 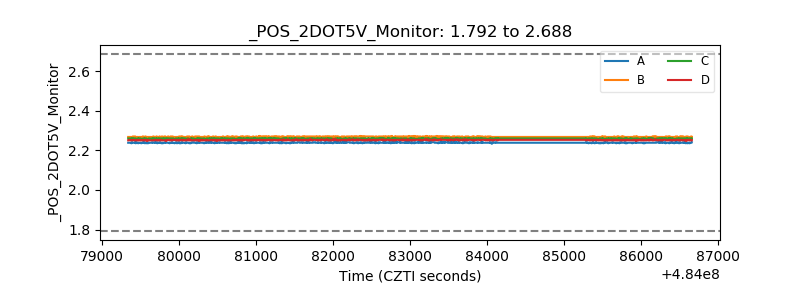 |
| +5 Volts monitor | 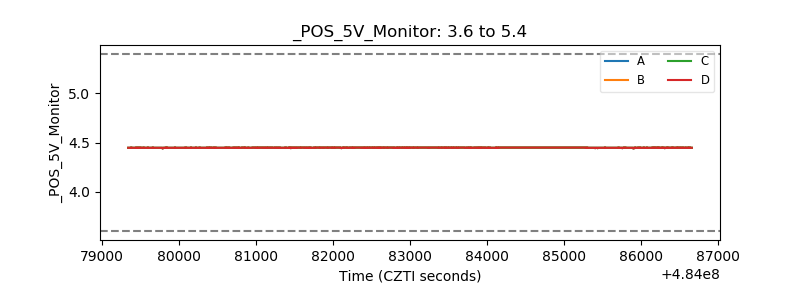 |
| _ROLL_ROT | 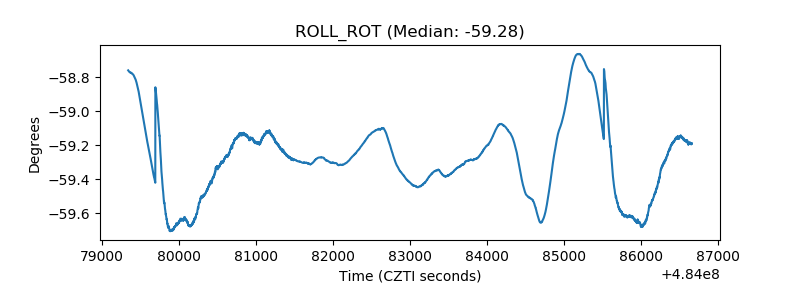 |
| _Roll_DEC | 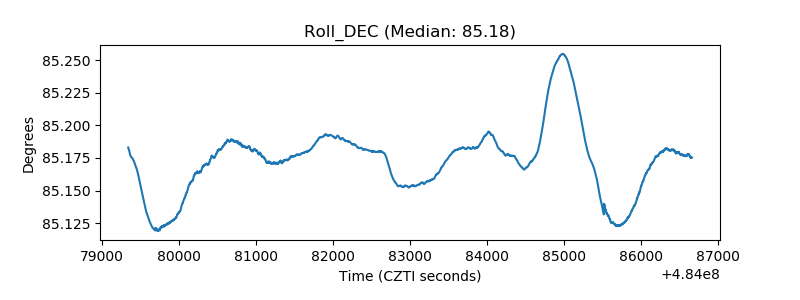 |
| _Roll_RA | 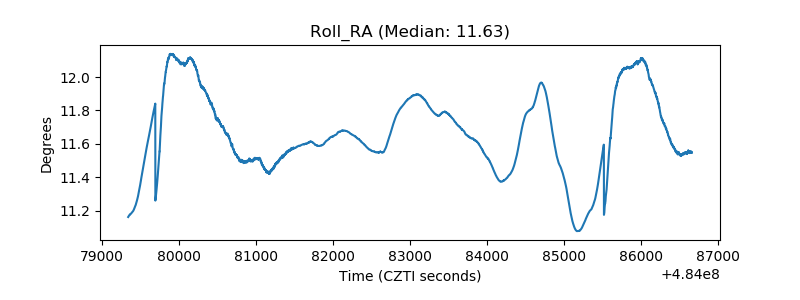 |
| Veto Counter | 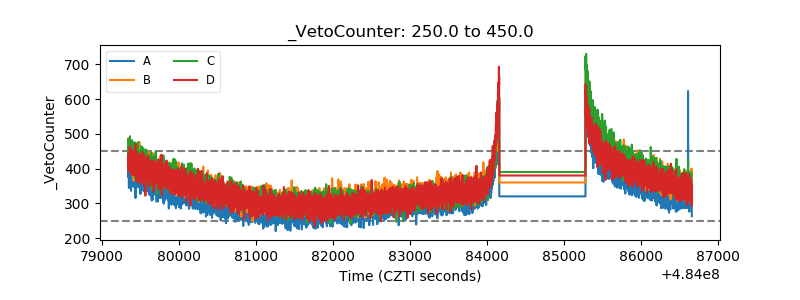 |