| Param | Original file | Final file |
|---|---|---|
| Filename | modeM0/AS1C09_011T05_9000006466_51930cztM0_level2.fits | modeM0/AS1C09_011T05_9000006466_51930cztM0_level2_quad_clean.evt |
| Size (bytes) | 1,101,127,680 | 66,795,840 |
| Size | 1.0 GB | 63.7 MB |
| Events in quadrant A | 9,137,959 | 472,403 |
| Events in quadrant B | 10,198,324 | 396,505 |
| Events in quadrant C | 7,230,496 | 521,828 |
| Events in quadrant D | 13,704,285 | 187,907 |
| Mode SS | |||
|---|---|---|---|
| Quadrant | BADHDUFLAG | Total packets | Discarded packets |
| A | 0 | 128 | 0 |
| B | 0 | 128 | 0 |
| C | 0 | 128 | 0 |
| D | 0 | 128 | 0 |
| Mode M0 | |||
|---|---|---|---|
| Quadrant | BADHDUFLAG | Total packets | Discarded packets |
| A | 0 | 31614 | 2 |
| B | 0 | 34666 | 5 |
| C | 0 | 25936 | 2 |
| D | 0 | 45048 | 2 |
| Mode M9 | |||
|---|---|---|---|
| Quadrant | BADHDUFLAG | Total packets | Discarded packets |
| A | 0 | 12 | 0 |
| B | 0 | 13 | 0 |
| C | 0 | 13 | 0 |
| D | 0 | 13 | 0 |
| Quadrant | Total seconds | Saturated seconds | Saturation percentage |
|---|---|---|---|
| A | 6354 | 1693 | 26.644633% |
| B | 6353 | 3102 | 48.827326% |
| C | 6353 | 1230 | 19.360932% |
| D | 6353 | 4579 | 72.076184% |
Noise dominated data is calculated using 1-second bins in cleaned event files. If a bin has >2000 counts, and if more than 50% of those come from <1% of pixels, then it is considered to be noise-dominated and hence unusable.
| Quadrant | # 1 sec bins | Bins with >0 counts | Bins with >2000 counts | High rate bins dominated by noise | Noise dominated (total time) | Noise dominated (detector-on time) | Marked lightcurve |
|---|---|---|---|---|---|---|---|
| A | 7534 | 6355 | 1620 | 1620 | 21.50% | 25.49% | 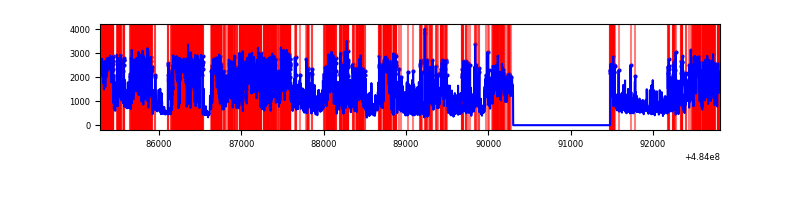 |
| B | 7532 | 6352 | 2403 | 2403 | 31.90% | 37.83% | 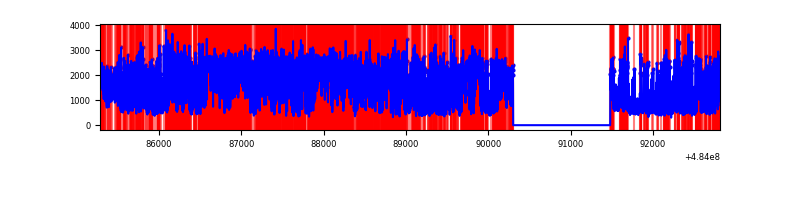 |
| C | 7532 | 6353 | 1118 | 1118 | 14.84% | 17.60% | 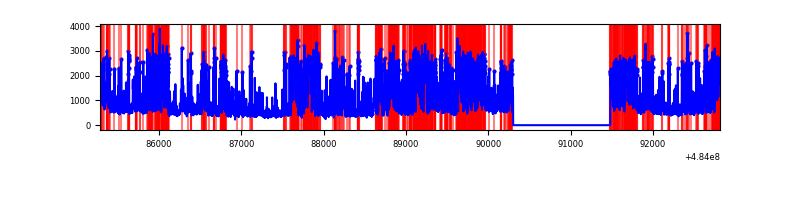 |
| D | 7532 | 6352 | 4419 | 4419 | 58.67% | 69.57% | 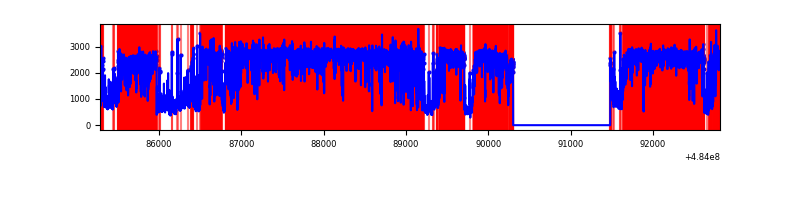 |
Top three noisy pixels from each quadrant. If the there are fewer than three noisy pixels in the level2.evt file, extra rows are filled as -1
| Pixel properties | Quadrant properties | ||||||
|---|---|---|---|---|---|---|---|
| Quadrant | DetID | PixID | Counts | Sigma | Mean | Median | Sigma |
| A | 7 | 64 | 1568696 | 10547.07 | 596 | 582 | 148.7 |
| A | 12 | 3 | 1420670 | 9551.45 | 596 | 582 | 148.7 |
| A | 4 | 175 | 1181836 | 7945.07 | 596 | 582 | 148.7 |
| B | 12 | 32 | 5388510 | 48929.36 | 516 | 498 | 110.1 |
| B | 10 | 44 | 1480848 | 13443.28 | 516 | 498 | 110.1 |
| B | 4 | 206 | 521408 | 4730.46 | 516 | 498 | 110.1 |
| C | 15 | 224 | 3170623 | 18388.3 | 614 | 607 | 172.4 |
| C | 15 | 218 | 489249 | 2834.46 | 614 | 607 | 172.4 |
| C | 13 | 3 | 232115 | 1342.91 | 614 | 607 | 172.4 |
| D | 12 | 17 | 6492223 | 57938.63 | 384 | 365 | 112.0 |
| D | 6 | 42 | 4556031 | 40658.48 | 384 | 365 | 112.0 |
| D | 3 | 12 | 396146 | 3532.27 | 384 | 365 | 112.0 |
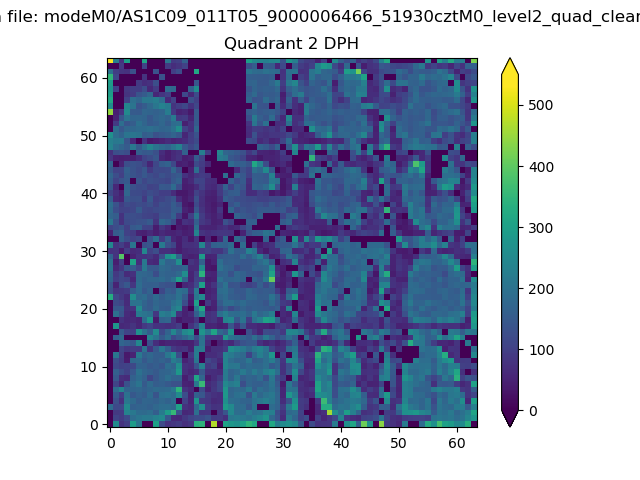
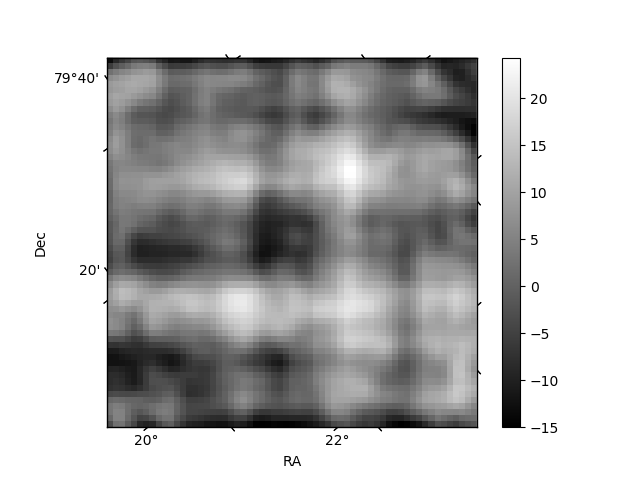
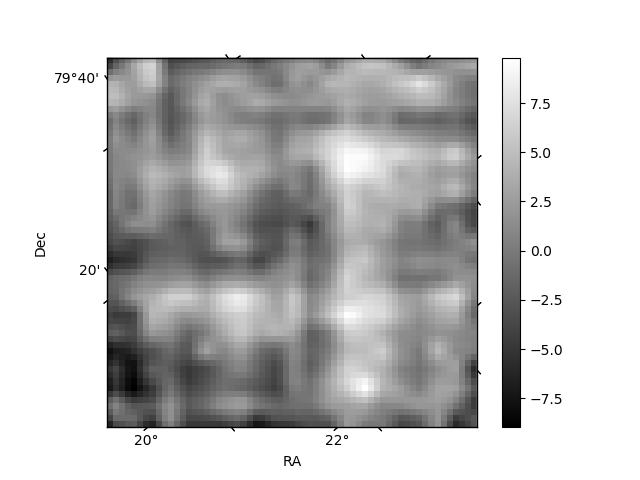
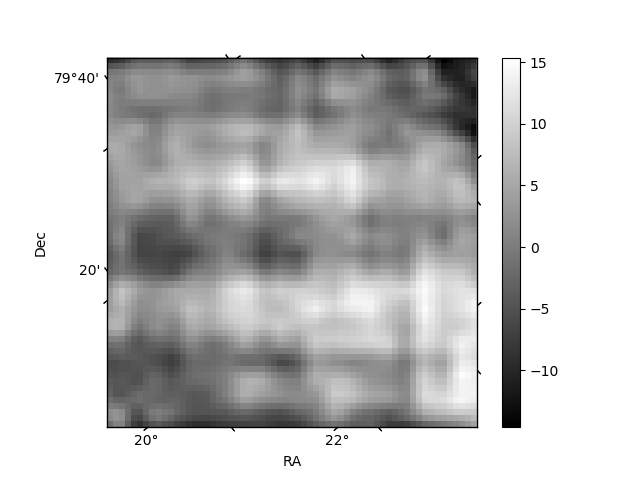
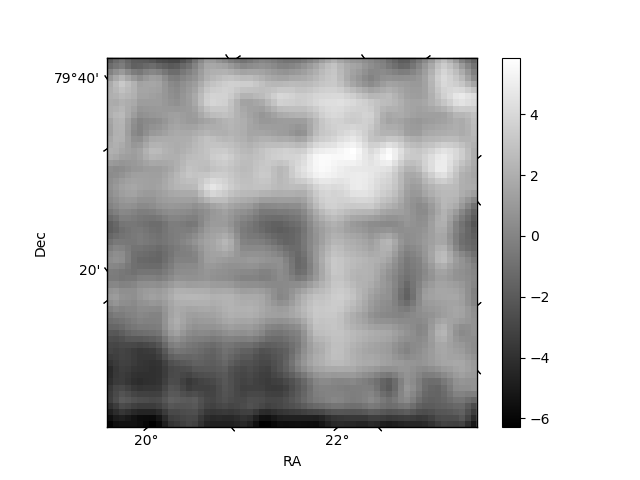
Histogram calculated using DETX and DETY for each event in the final _common_clean file
| Quadrant A | 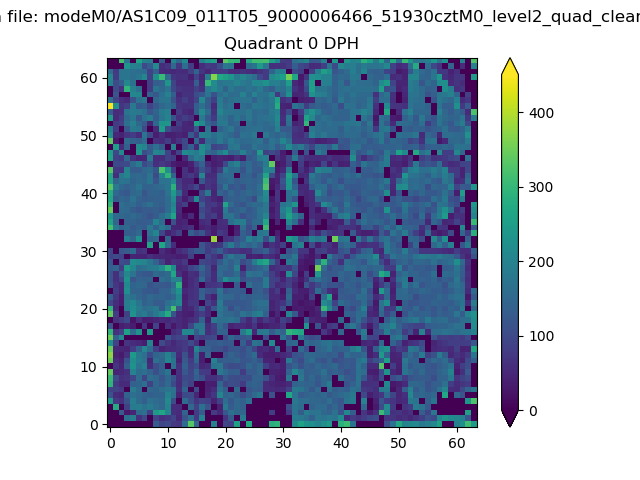 |
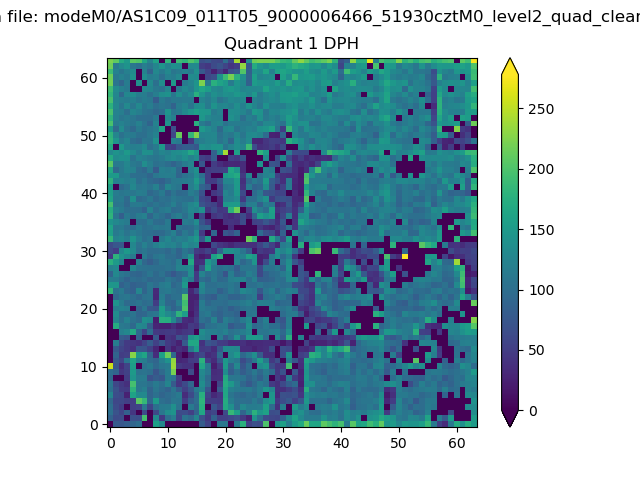 |
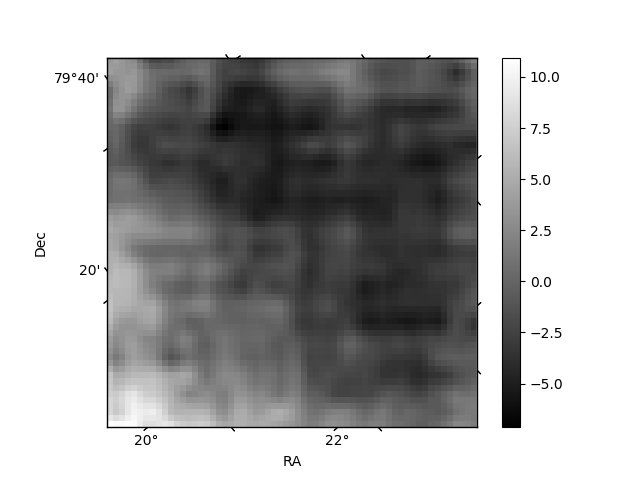
Quadrant B |
|---|---|---|---|
| Quadrant D | 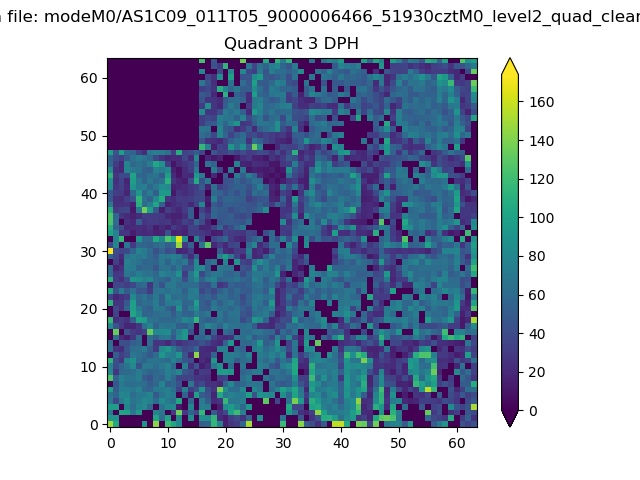 |
 |
Quadrant C |
| Plot type | Count rate plots | Images |
|---|---|---|
| Comparison with Poisson distribution Blue bars denote a histogram of data divided into 1 sec bins. Red curve is a Poisson curve with rate = median count rate of data. |
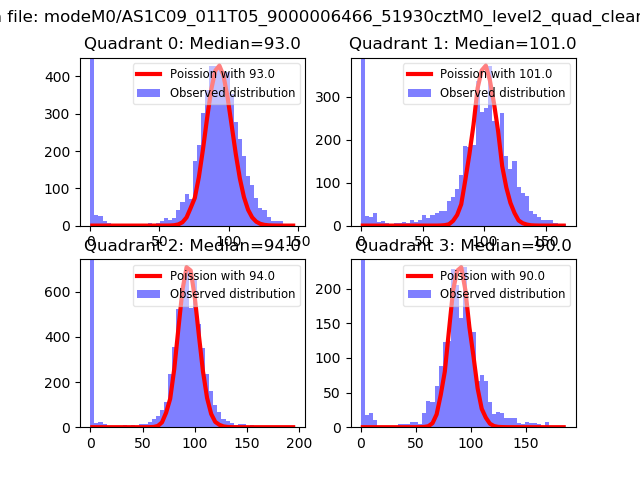 |
 |
| Quadrant-wise count rates Data is divided into 100 sec bins |
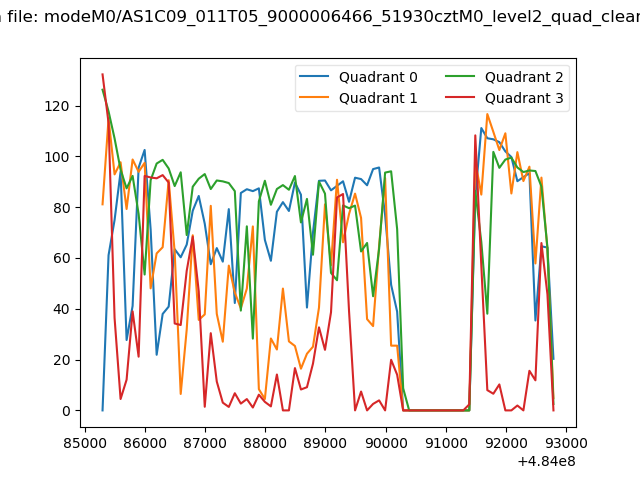 |
|
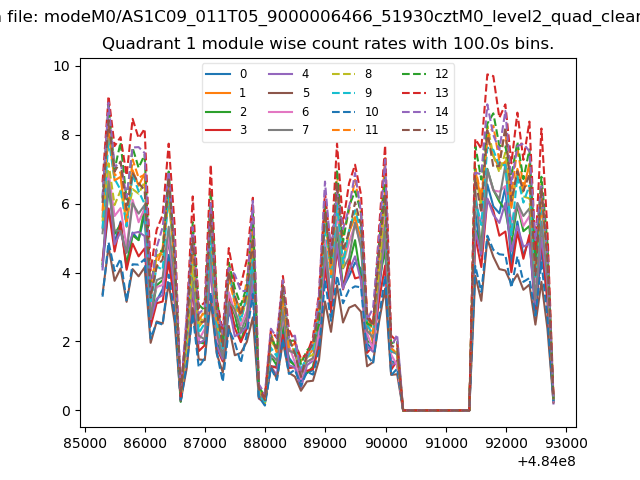
| Module-wise count rates for Quadrant A Data is divided into 100 sec bins |
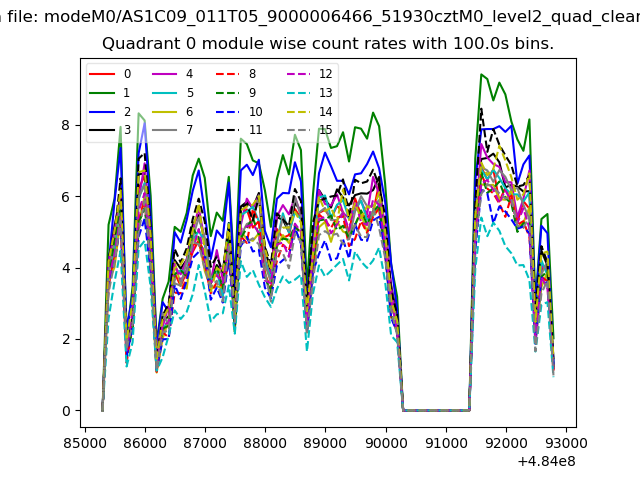 |
 |
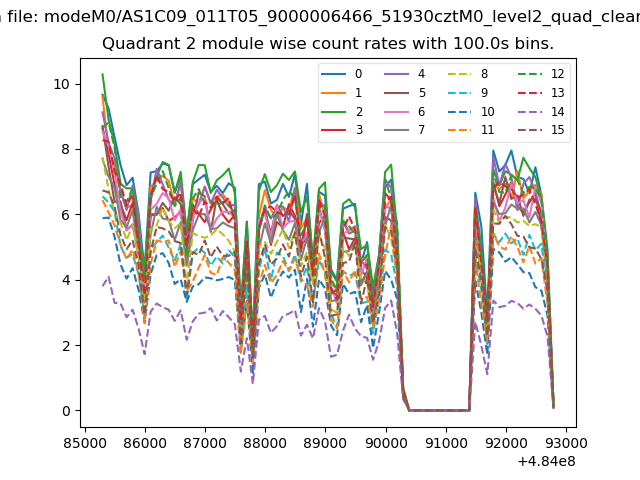
| Module-wise count rates for Quadrant B Data is divided into 100 sec bins |
 |
 |
| Module-wise count rates for Quadrant C Data is divided into 100 sec bins |
 |
 |
| Module-wise count rates for Quadrant D Data is divided into 100 sec bins |
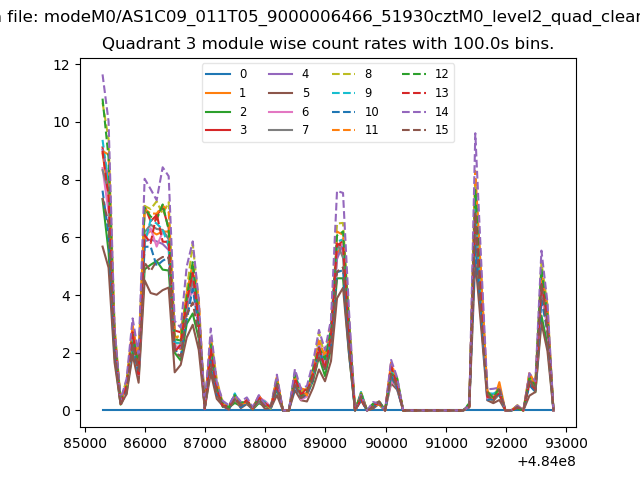 |
 |
| Parameter | Plot |
|---|---|
| CZT HV Monitor | 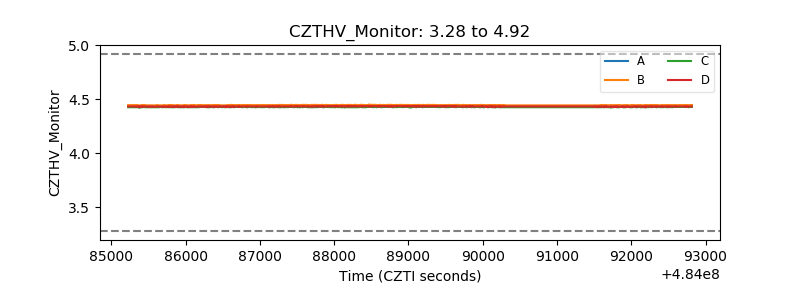 |
| D_VDD | 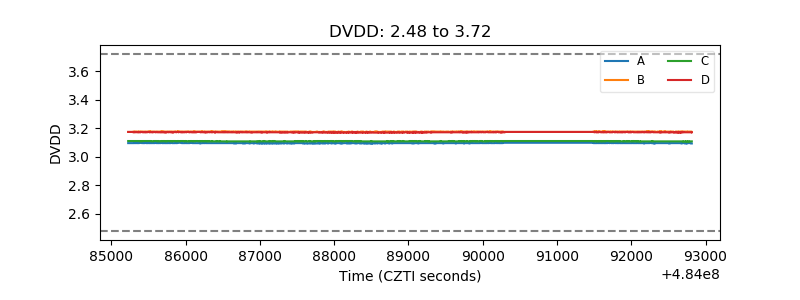 |
| Temperature 1 | 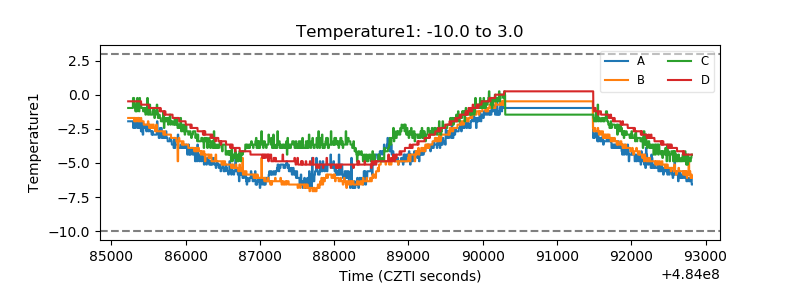 |
| Veto HV Monitor | 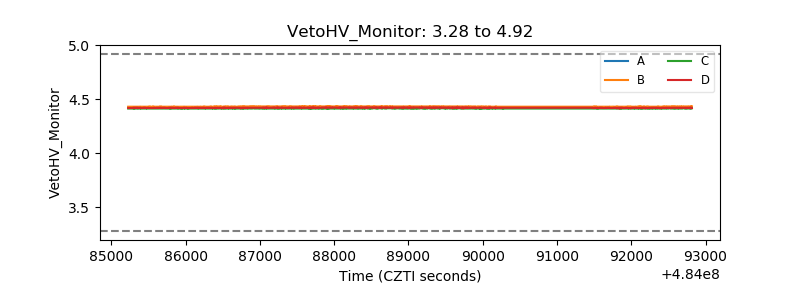 |
| Veto LLD | 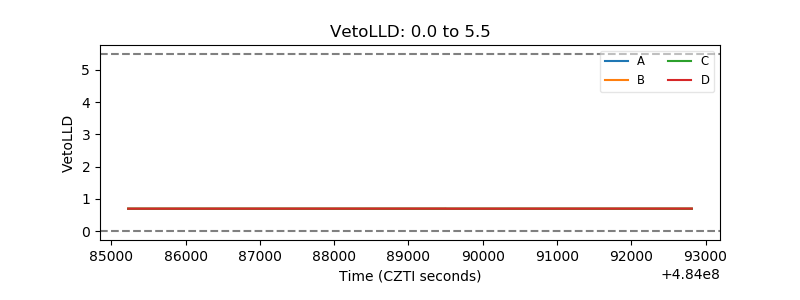 |
| Alpha Counter | 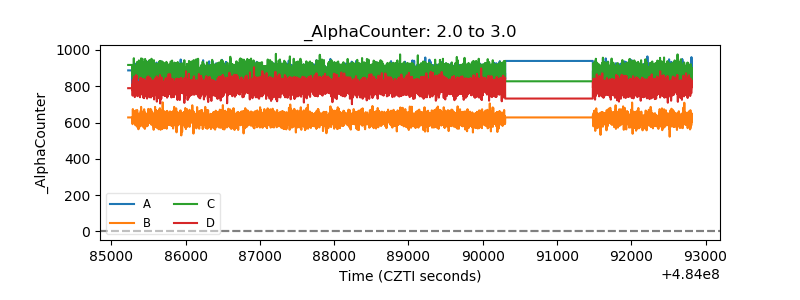 |
| _CPM_Rate | 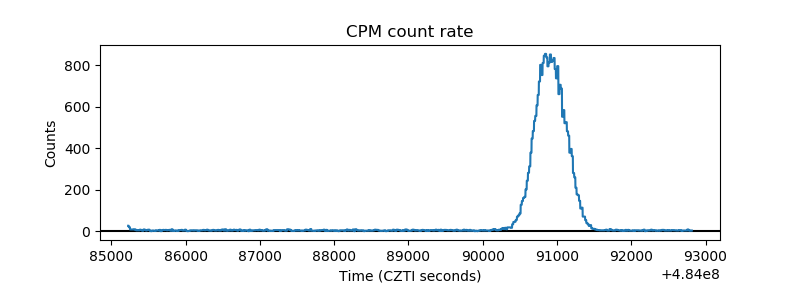 |
| CZT Counter | 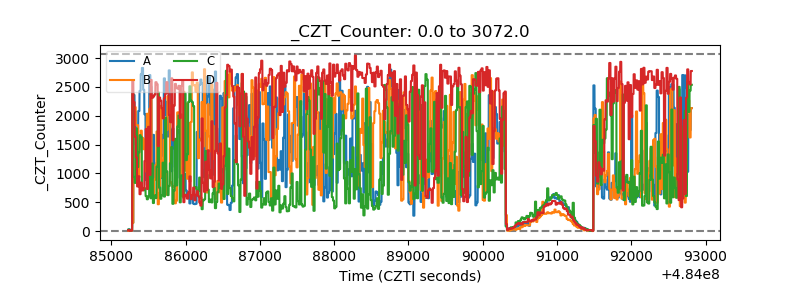 |
| +2.5 Volts monitor | 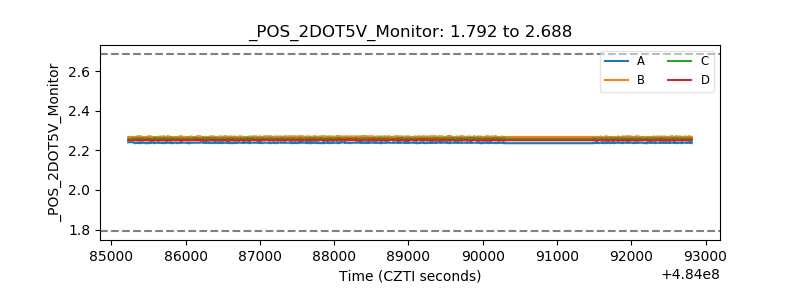 |
| +5 Volts monitor |  |
| _ROLL_ROT | 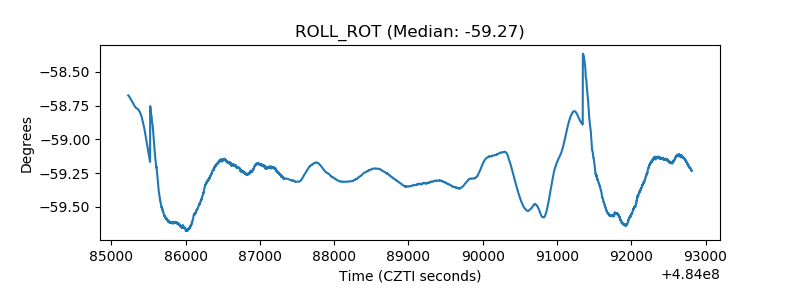 |
| _Roll_DEC | 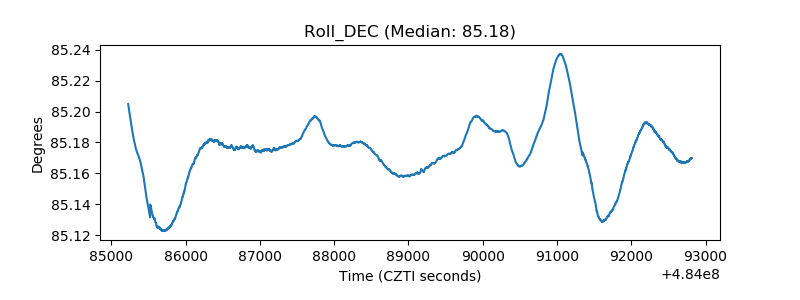 |
| _Roll_RA | 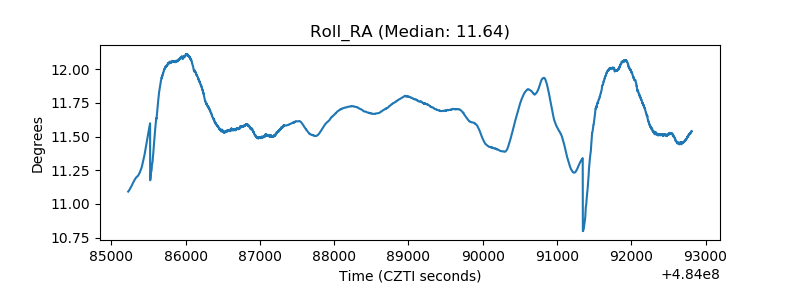 |
| Veto Counter | 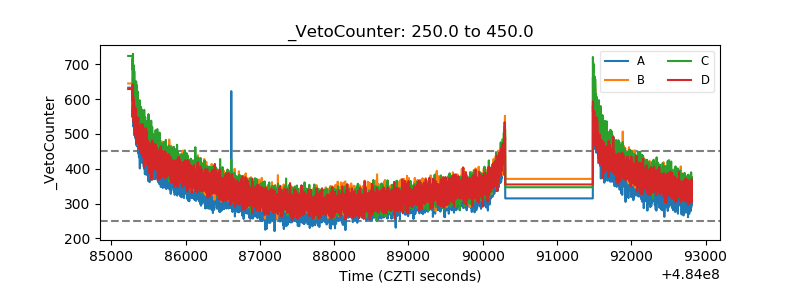 |