| Param | Original file | Final file |
|---|---|---|
| Filename | modeM0/AS1C09_011T05_9000006466_51931cztM0_level2.fits | modeM0/AS1C09_011T05_9000006466_51931cztM0_level2_quad_clean.evt |
| Size (bytes) | 1,035,400,320 | 67,936,320 |
| Size | 987.4 MB | 64.8 MB |
| Events in quadrant A | 7,829,806 | 523,819 |
| Events in quadrant B | 11,012,179 | 316,839 |
| Events in quadrant C | 9,588,112 | 401,706 |
| Events in quadrant D | 9,406,511 | 369,937 |
| Mode SS | |||
|---|---|---|---|
| Quadrant | BADHDUFLAG | Total packets | Discarded packets |
| A | 0 | 130 | 0 |
| B | 0 | 130 | 0 |
| C | 0 | 130 | 0 |
| D | 0 | 130 | 0 |
| Mode M0 | |||
|---|---|---|---|
| Quadrant | BADHDUFLAG | Total packets | Discarded packets |
| A | 0 | 27737 | 1 |
| B | 0 | 37088 | 1 |
| C | 0 | 32888 | 1 |
| D | 0 | 32352 | 1 |
| Mode M9 | |||
|---|---|---|---|
| Quadrant | BADHDUFLAG | Total packets | Discarded packets |
| A | 0 | 12 | 0 |
| B | 0 | 12 | 0 |
| C | 0 | 12 | 0 |
| D | 0 | 12 | 0 |
| Quadrant | Total seconds | Saturated seconds | Saturation percentage |
|---|---|---|---|
| A | 6361 | 988 | 15.532149% |
| B | 6360 | 3801 | 59.764151% |
| C | 6361 | 2422 | 38.075774% |
| D | 6361 | 2319 | 36.456532% |
Noise dominated data is calculated using 1-second bins in cleaned event files. If a bin has >2000 counts, and if more than 50% of those come from <1% of pixels, then it is considered to be noise-dominated and hence unusable.
| Quadrant | # 1 sec bins | Bins with >0 counts | Bins with >2000 counts | High rate bins dominated by noise | Noise dominated (total time) | Noise dominated (detector-on time) | Marked lightcurve |
|---|---|---|---|---|---|---|---|
| A | 7541 | 6361 | 903 | 903 | 11.97% | 14.20% | 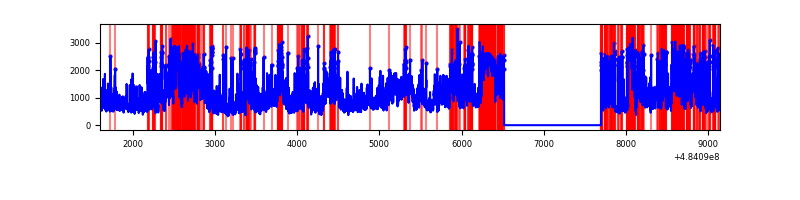 |
| B | 7540 | 6361 | 2878 | 2878 | 38.17% | 45.24% | 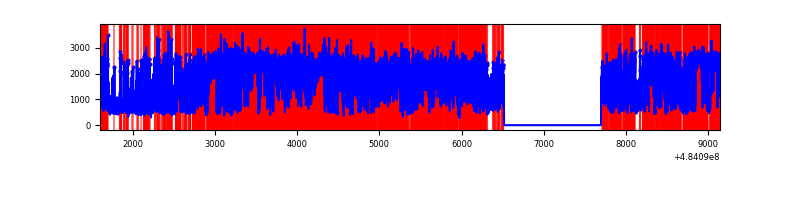 |
| C | 7541 | 6361 | 2215 | 2215 | 29.37% | 34.82% | 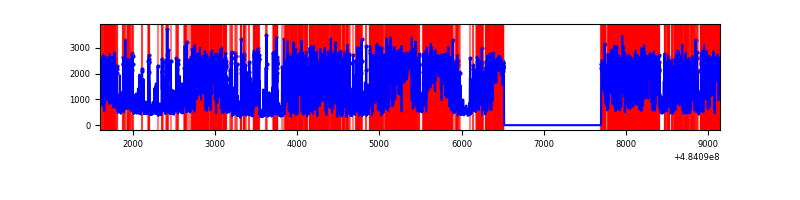 |
| D | 7541 | 6362 | 2354 | 2354 | 31.22% | 37.00% | 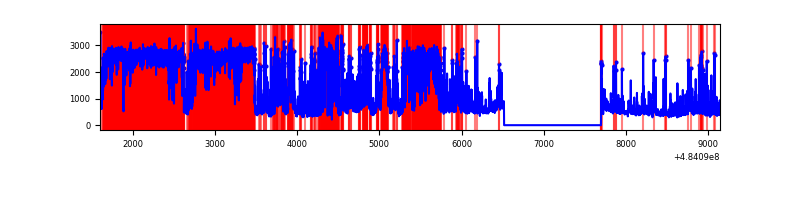 |
Top three noisy pixels from each quadrant. If the there are fewer than three noisy pixels in the level2.evt file, extra rows are filled as -1
| Pixel properties | Quadrant properties | ||||||
|---|---|---|---|---|---|---|---|
| Quadrant | DetID | PixID | Counts | Sigma | Mean | Median | Sigma |
| A | 12 | 3 | 1795022 | 11556.9 | 613 | 599 | 155.3 |
| A | 7 | 64 | 1279055 | 8233.84 | 613 | 599 | 155.3 |
| A | 4 | 175 | 679252 | 4370.83 | 613 | 599 | 155.3 |
| B | 12 | 32 | 7925330 | 85145.16 | 438 | 424 | 93.1 |
| B | 4 | 171 | 246374 | 2642.49 | 438 | 424 | 93.1 |
| B | 4 | 206 | 224722 | 2409.86 | 438 | 424 | 93.1 |
| C | 15 | 224 | 5354344 | 35963.12 | 526 | 523 | 148.9 |
| C | 0 | 193 | 655067 | 4396.76 | 526 | 523 | 148.9 |
| C | 15 | 230 | 339450 | 2276.67 | 526 | 523 | 148.9 |
| D | 6 | 42 | 5287835 | 34630.58 | 524 | 499 | 152.7 |
| D | 12 | 17 | 1098339 | 7190.55 | 524 | 499 | 152.7 |
| D | 3 | 12 | 377409 | 2468.66 | 524 | 499 | 152.7 |
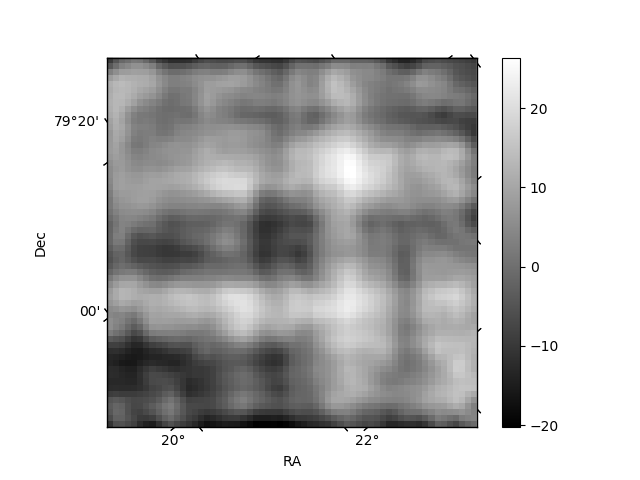
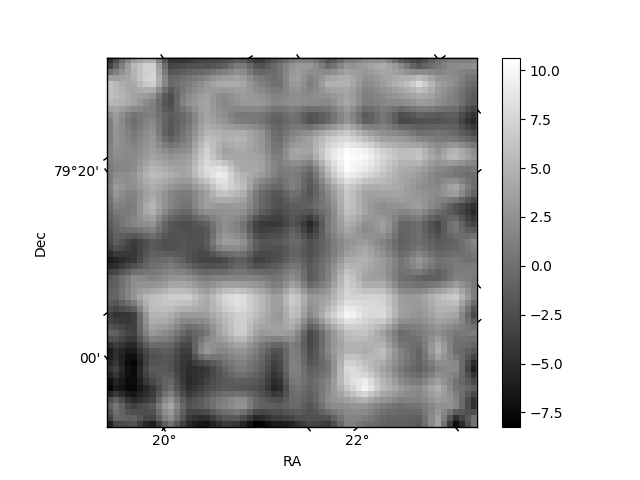
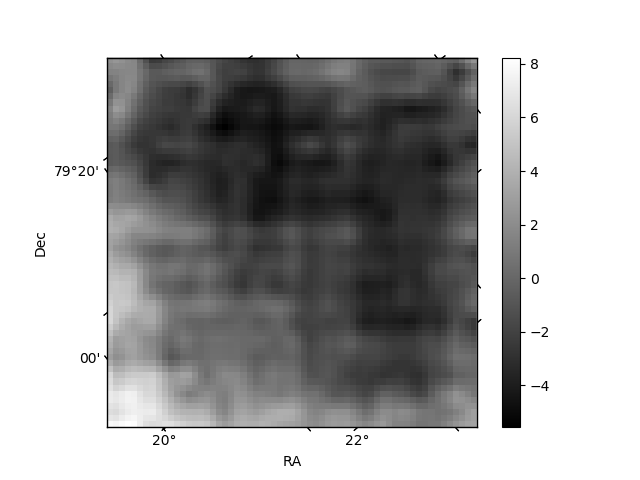
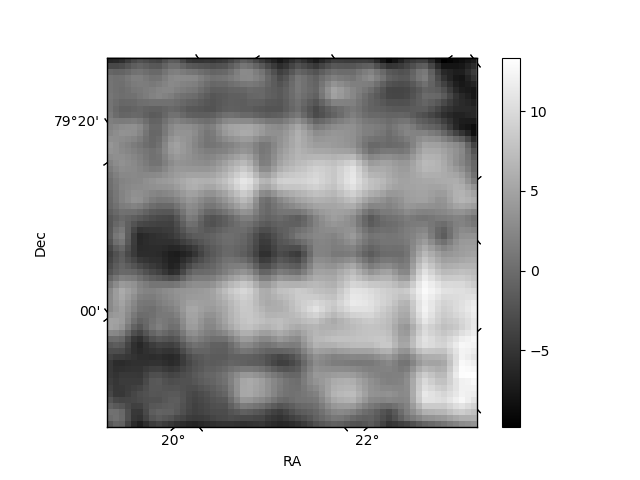
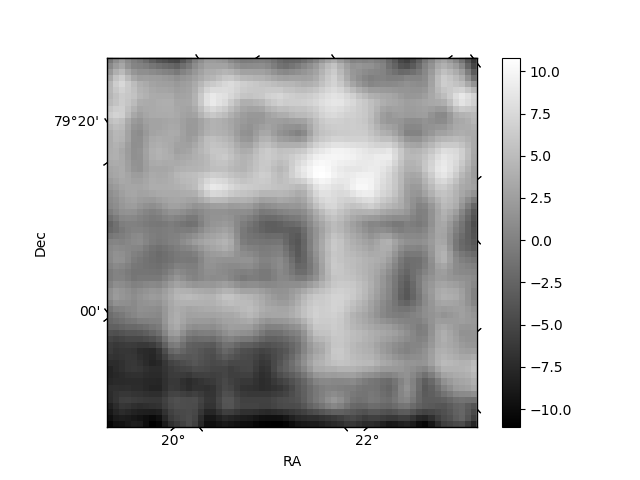
Histogram calculated using DETX and DETY for each event in the final _common_clean file
| Quadrant A | 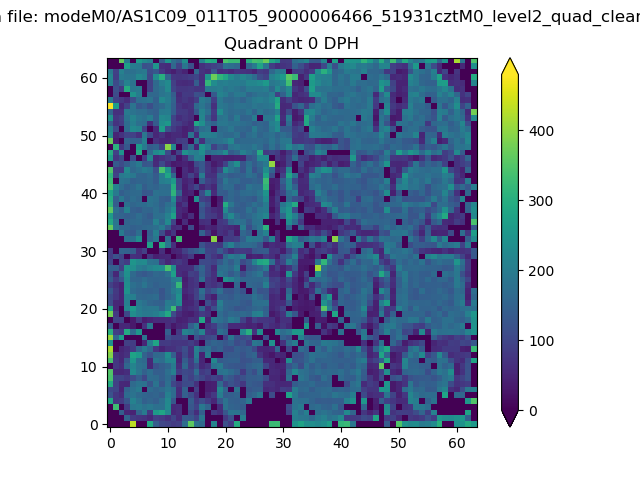 |
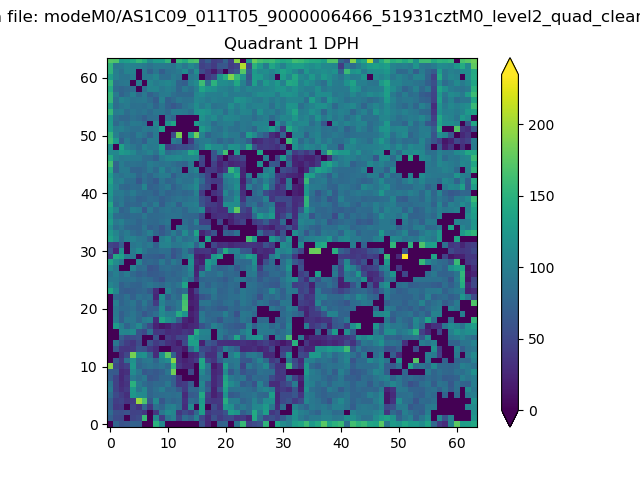 |
Quadrant B |
|---|---|---|---|
| Quadrant D | 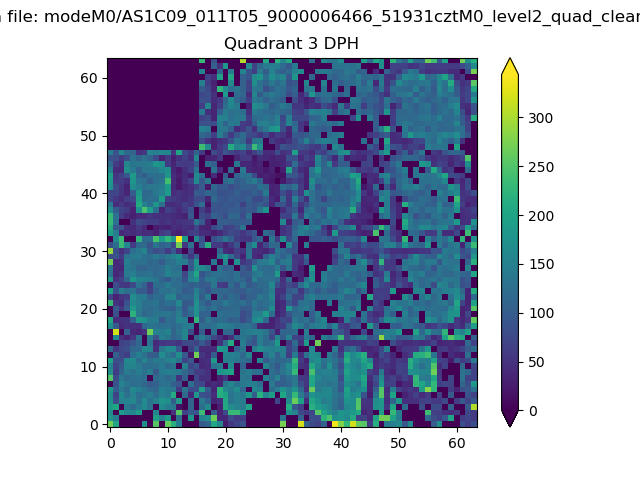 |
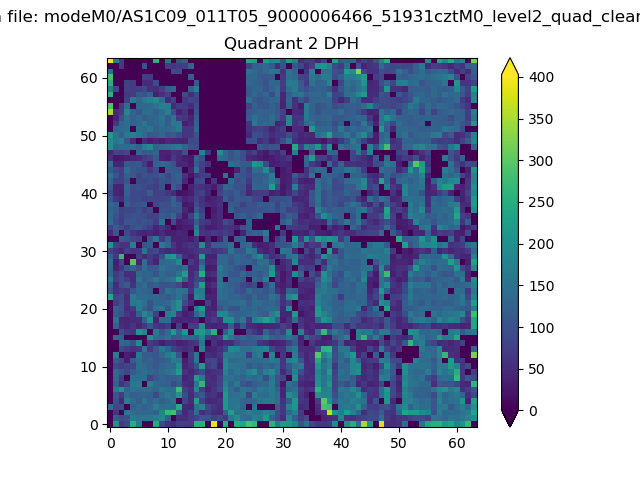 |
Quadrant C |
| Plot type | Count rate plots | Images |
|---|---|---|
| Comparison with Poisson distribution Blue bars denote a histogram of data divided into 1 sec bins. Red curve is a Poisson curve with rate = median count rate of data. |
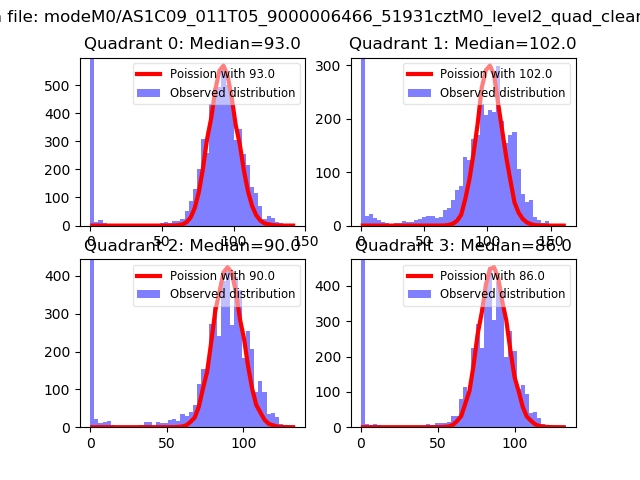 |
 |
| Quadrant-wise count rates Data is divided into 100 sec bins |
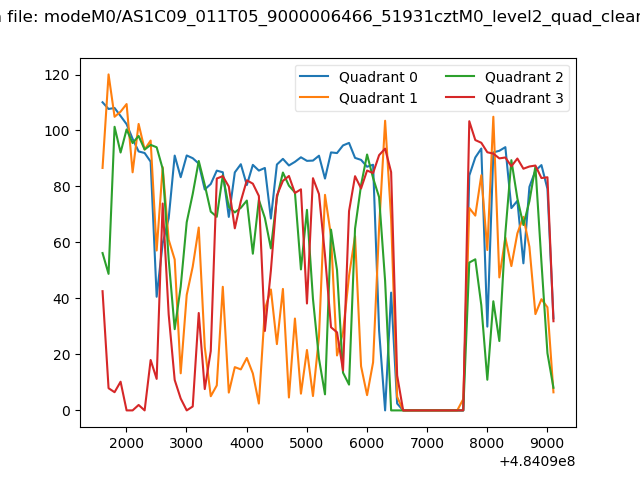 |
|
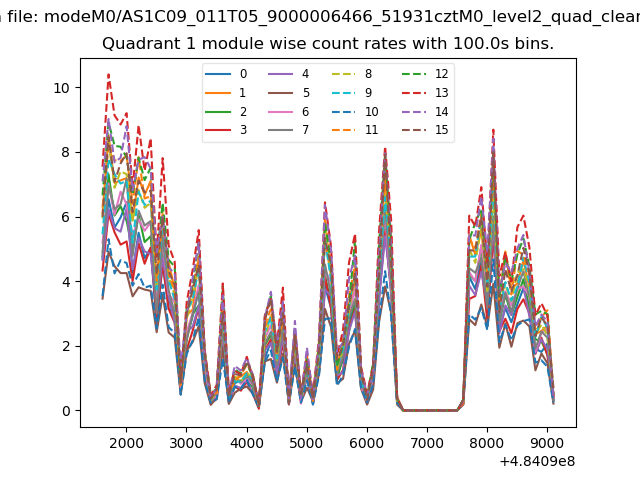
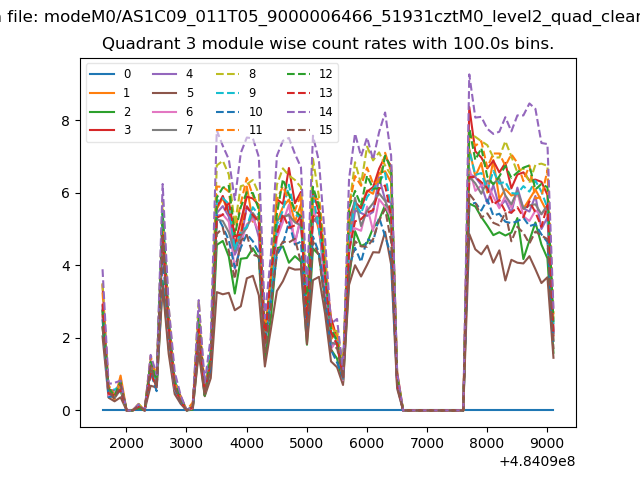
| Module-wise count rates for Quadrant A Data is divided into 100 sec bins |
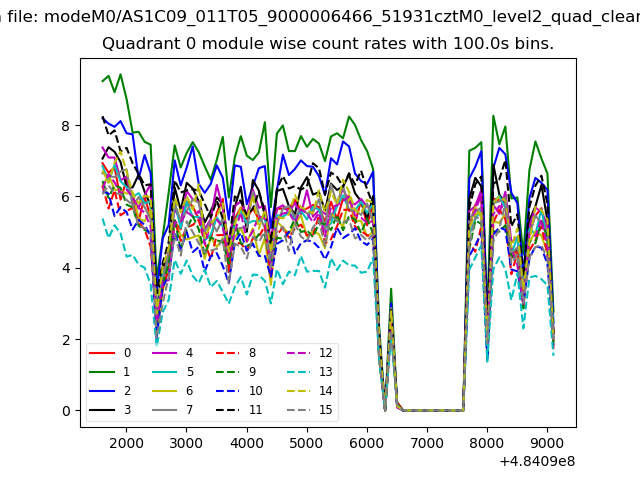 |
 |
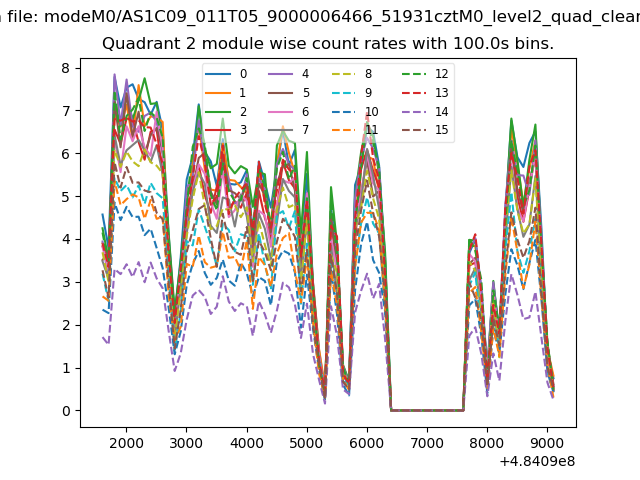
| Module-wise count rates for Quadrant B Data is divided into 100 sec bins |
 |
 |
| Module-wise count rates for Quadrant C Data is divided into 100 sec bins |
 |
 |
| Module-wise count rates for Quadrant D Data is divided into 100 sec bins |
 |
 |
| Parameter | Plot |
|---|---|
| CZT HV Monitor |  |
| D_VDD | 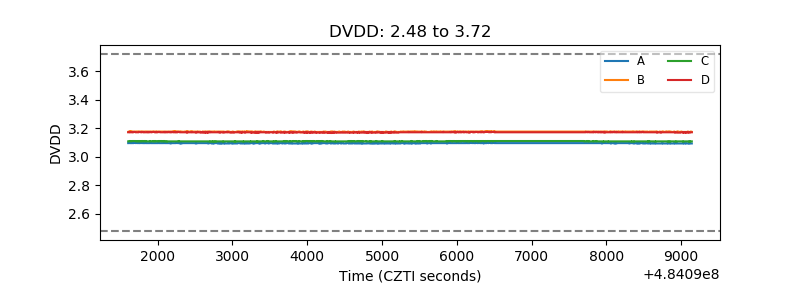 |
| Temperature 1 | 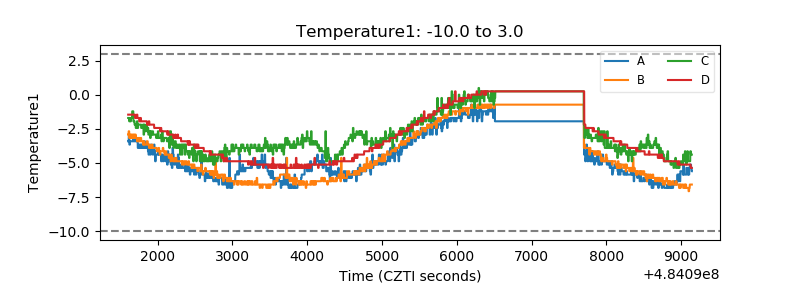 |
| Veto HV Monitor | 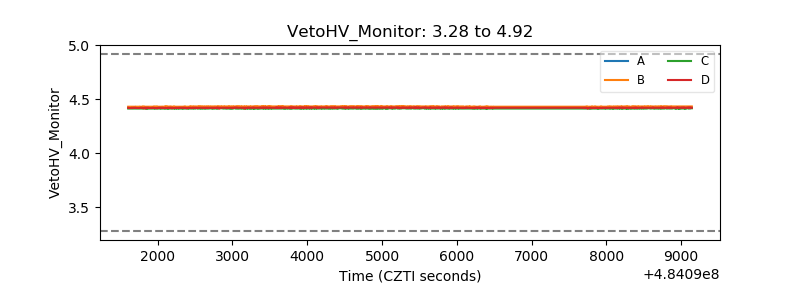 |
| Veto LLD | 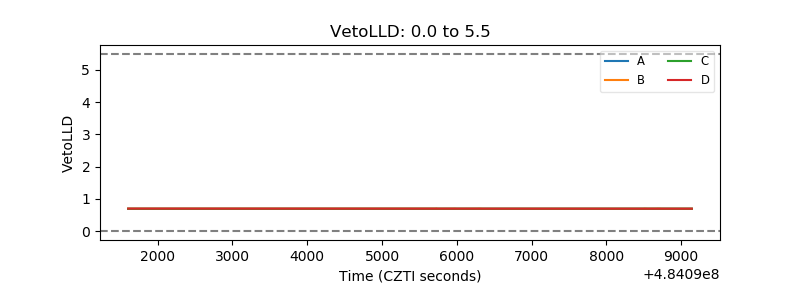 |
| Alpha Counter | 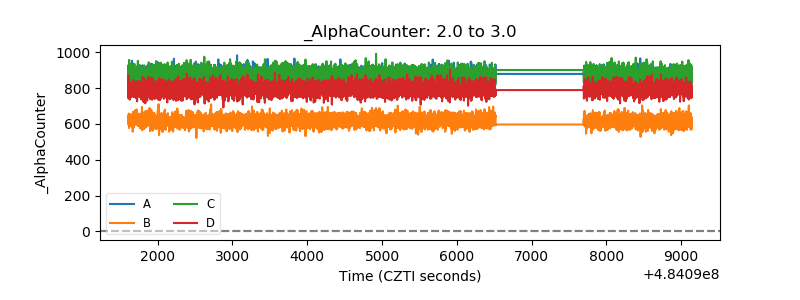 |
| _CPM_Rate | 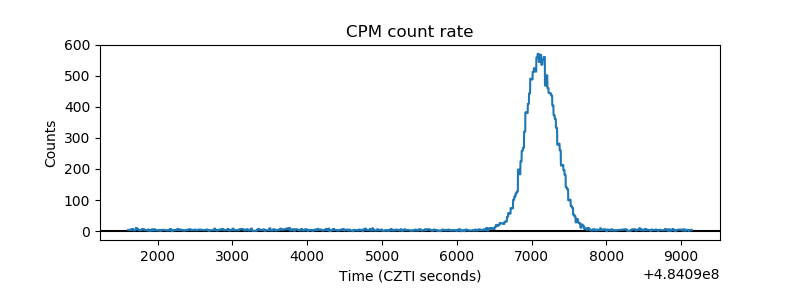 |
| CZT Counter | 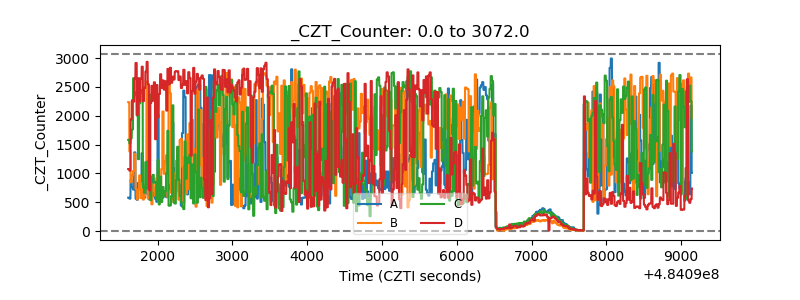 |
| +2.5 Volts monitor | 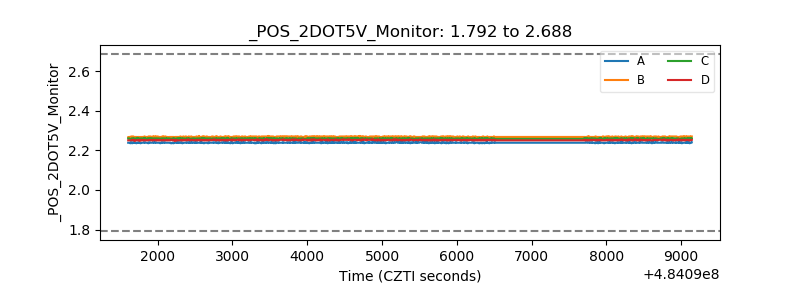 |
| +5 Volts monitor | 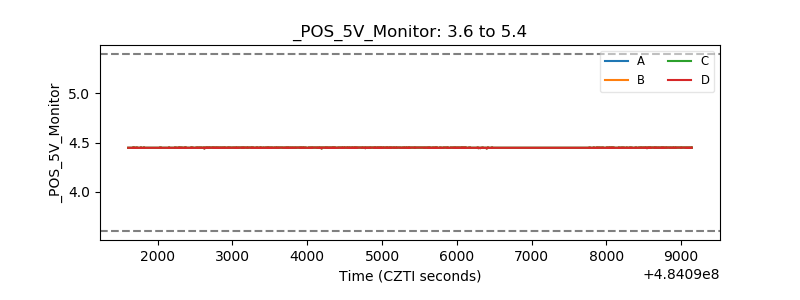 |
| _ROLL_ROT | 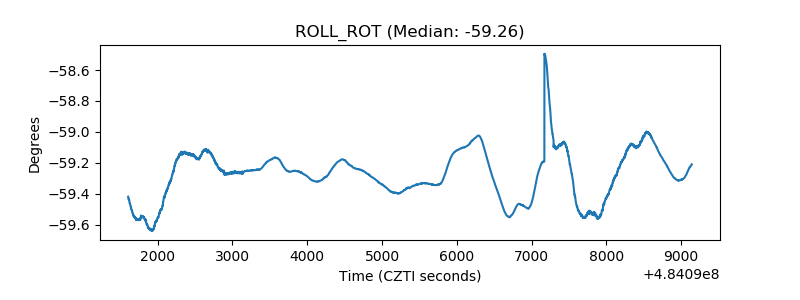 |
| _Roll_DEC | 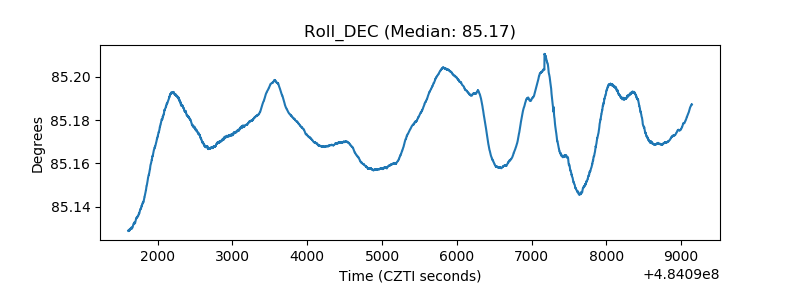 |
| _Roll_RA | 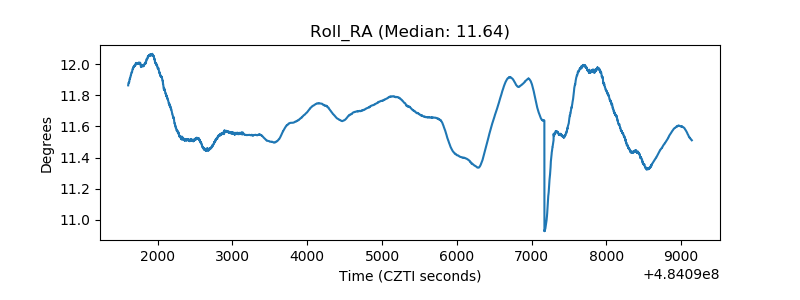 |
| Veto Counter | 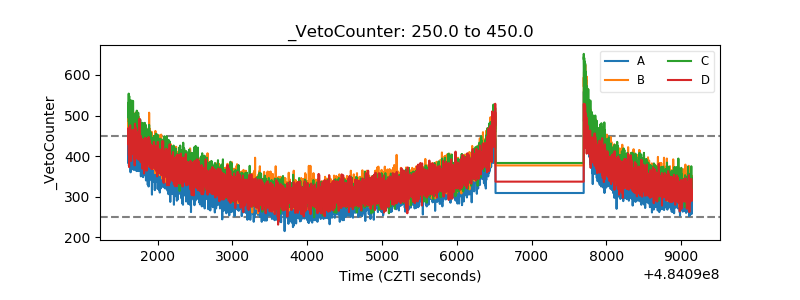 |