| Param | Original file | Final file |
|---|---|---|
| Filename | modeM0/AS1C09_011T05_9000006466_51932cztM0_level2.fits | modeM0/AS1C09_011T05_9000006466_51932cztM0_level2_quad_clean.evt |
| Size (bytes) | 1,110,444,480 | 73,627,200 |
| Size | 1.0 GB | 70.2 MB |
| Events in quadrant A | 6,689,162 | 587,897 |
| Events in quadrant B | 12,627,266 | 362,561 |
| Events in quadrant C | 12,012,351 | 353,672 |
| Events in quadrant D | 9,246,932 | 445,189 |
| Mode SS | |||
|---|---|---|---|
| Quadrant | BADHDUFLAG | Total packets | Discarded packets |
| A | 0 | 140 | 0 |
| B | 0 | 140 | 0 |
| C | 0 | 140 | 0 |
| D | 0 | 140 | 0 |
| Mode M0 | |||
|---|---|---|---|
| Quadrant | BADHDUFLAG | Total packets | Discarded packets |
| A | 0 | 24665 | 2 |
| B | 0 | 42316 | 2 |
| C | 0 | 40458 | 2 |
| D | 0 | 32258 | 2 |
| Mode M9 | |||
|---|---|---|---|
| Quadrant | BADHDUFLAG | Total packets | Discarded packets |
| A | 0 | 17 | 0 |
| B | 0 | 18 | 0 |
| C | 0 | 18 | 0 |
| D | 0 | 18 | 0 |
| Quadrant | Total seconds | Saturated seconds | Saturation percentage |
|---|---|---|---|
| A | 6875 | 776 | 11.287273% |
| B | 6875 | 3846 | 55.941818% |
| C | 6874 | 3439 | 50.029095% |
| D | 6874 | 1972 | 28.687809% |
Noise dominated data is calculated using 1-second bins in cleaned event files. If a bin has >2000 counts, and if more than 50% of those come from <1% of pixels, then it is considered to be noise-dominated and hence unusable.
| Quadrant | # 1 sec bins | Bins with >0 counts | Bins with >2000 counts | High rate bins dominated by noise | Noise dominated (total time) | Noise dominated (detector-on time) | Marked lightcurve |
|---|---|---|---|---|---|---|---|
| A | 7905 | 6877 | 674 | 674 | 8.53% | 9.80% | 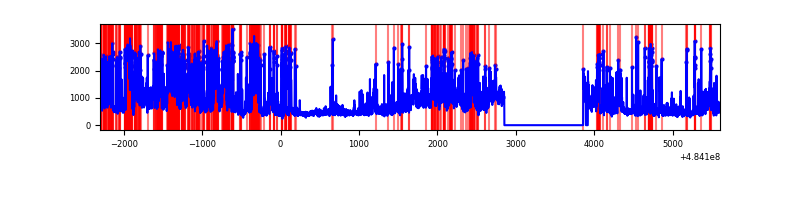 |
| B | 7905 | 6876 | 3474 | 3474 | 43.95% | 50.52% | 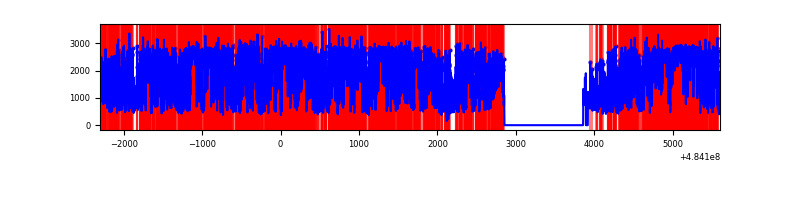 |
| C | 7903 | 6873 | 3173 | 3173 | 40.15% | 46.17% | 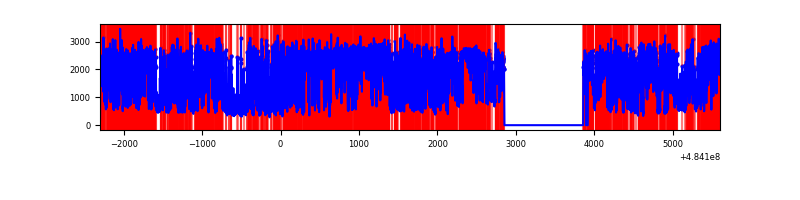 |
| D | 7904 | 6875 | 2010 | 2010 | 25.43% | 29.24% |  |
Top three noisy pixels from each quadrant. If the there are fewer than three noisy pixels in the level2.evt file, extra rows are filled as -1
| Pixel properties | Quadrant properties | ||||||
|---|---|---|---|---|---|---|---|
| Quadrant | DetID | PixID | Counts | Sigma | Mean | Median | Sigma |
| A | 7 | 64 | 1509119 | 8929.55 | 678 | 662 | 168.9 |
| A | 12 | 3 | 936354 | 5538.98 | 678 | 662 | 168.9 |
| A | 4 | 175 | 229498 | 1354.63 | 678 | 662 | 168.9 |
| B | 12 | 32 | 9066741 | 82420.88 | 521 | 504 | 110.0 |
| B | 4 | 171 | 332547 | 3018.59 | 521 | 504 | 110.0 |
| B | 4 | 206 | 233278 | 2116.14 | 521 | 504 | 110.0 |
| C | 15 | 224 | 5599362 | 38472.21 | 518 | 513 | 145.5 |
| C | 15 | 218 | 1395147 | 9583.16 | 518 | 513 | 145.5 |
| C | 9 | 38 | 1137927 | 7815.68 | 518 | 513 | 145.5 |
| D | 6 | 42 | 4282177 | 24785.25 | 605 | 578 | 172.7 |
| D | 12 | 17 | 723069 | 4182.34 | 605 | 578 | 172.7 |
| D | 3 | 12 | 421781 | 2438.25 | 605 | 578 | 172.7 |
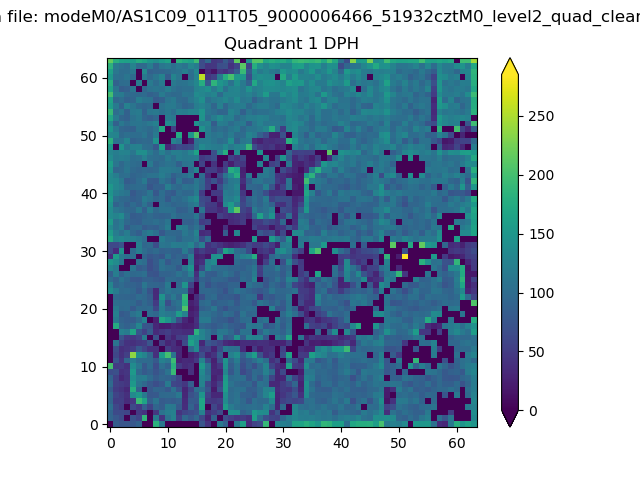
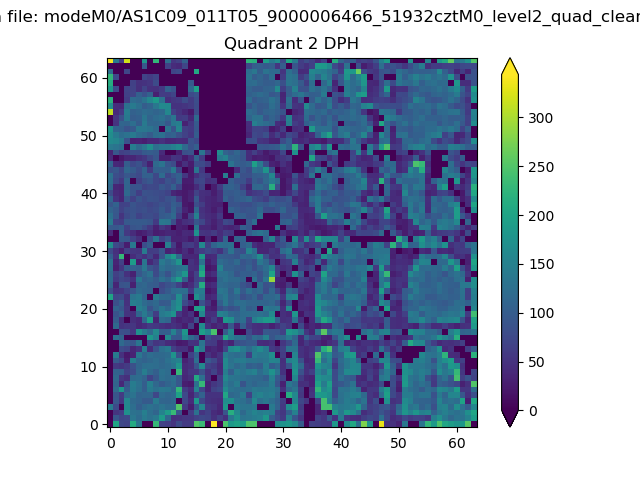
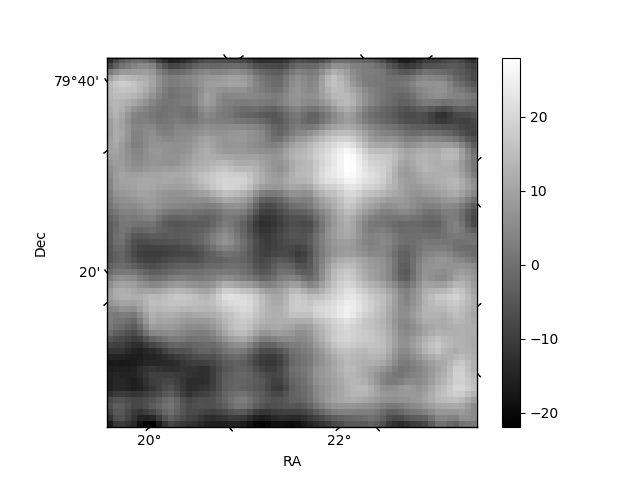
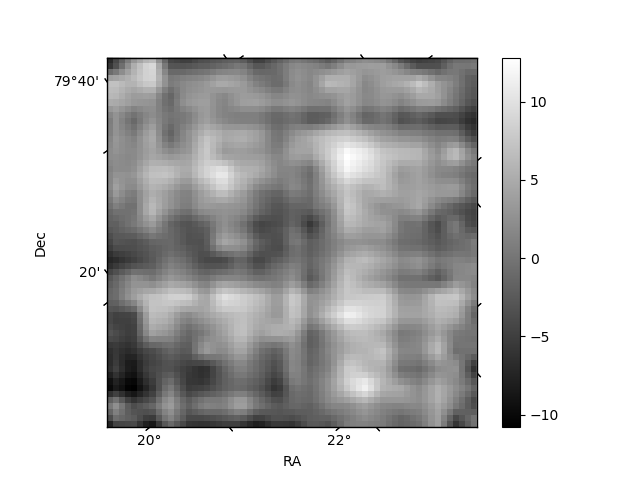
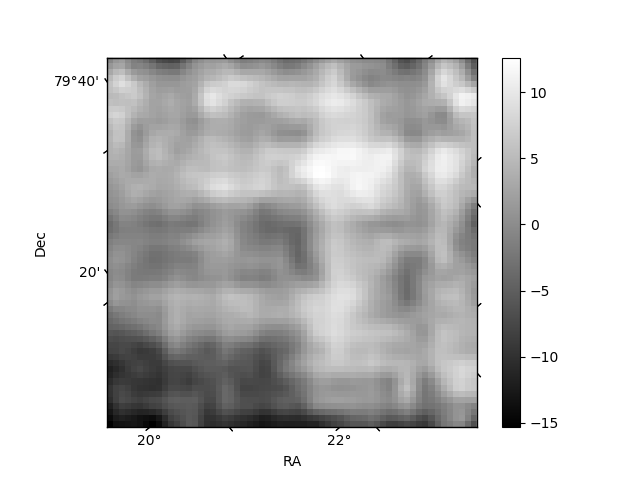
Histogram calculated using DETX and DETY for each event in the final _common_clean file
| Quadrant A | 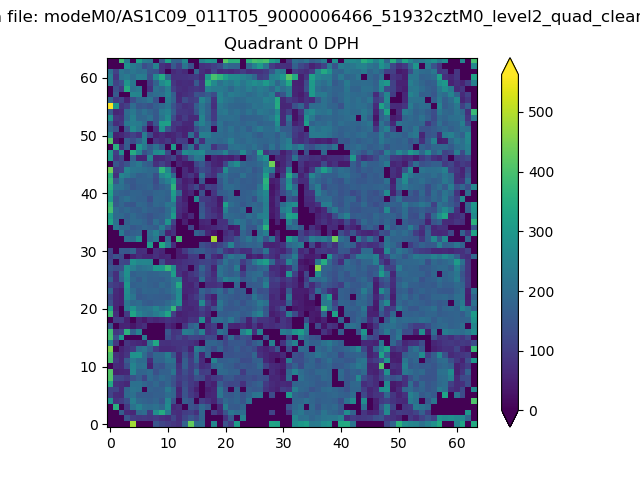 |
 |
Quadrant B |
|---|---|---|---|
| Quadrant D | 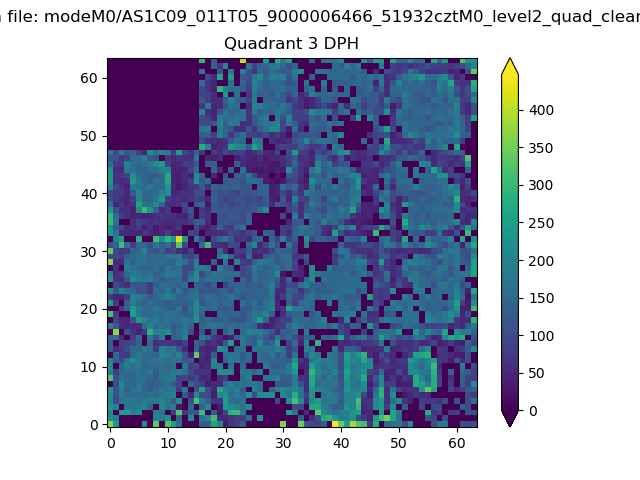 |
 |
Quadrant C |
| Plot type | Count rate plots | Images |
|---|---|---|
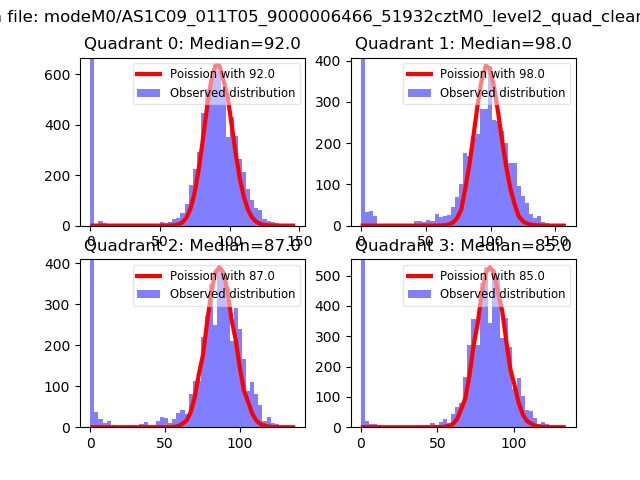
| Comparison with Poisson distribution Blue bars denote a histogram of data divided into 1 sec bins. Red curve is a Poisson curve with rate = median count rate of data. |
 |
 |
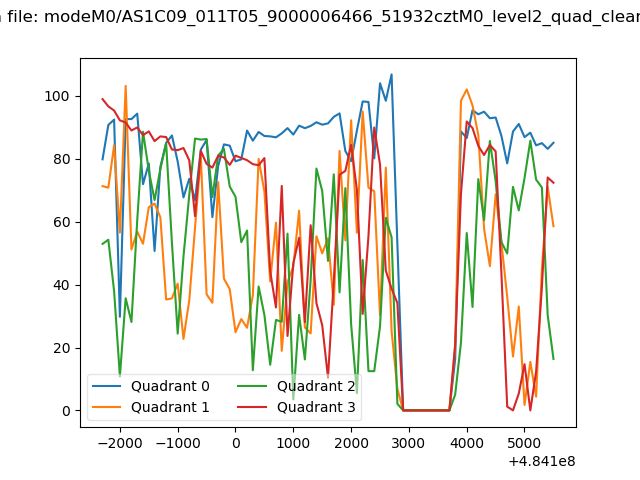
| Quadrant-wise count rates Data is divided into 100 sec bins |
 |
|
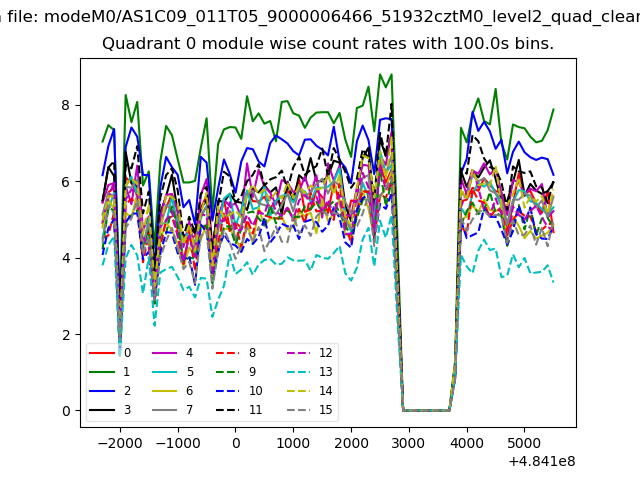
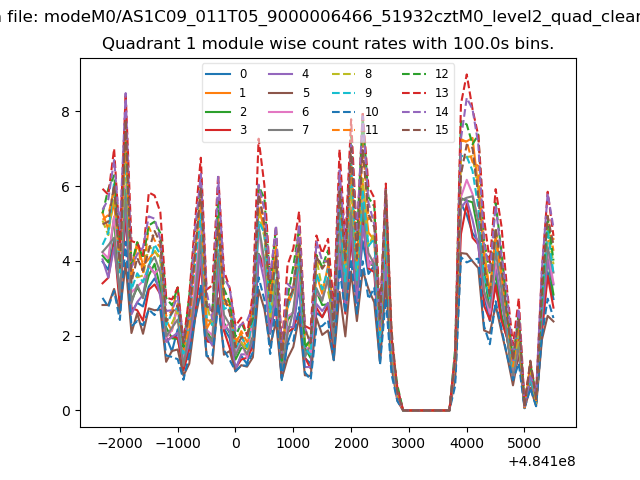
| Module-wise count rates for Quadrant A Data is divided into 100 sec bins |
 |
 |
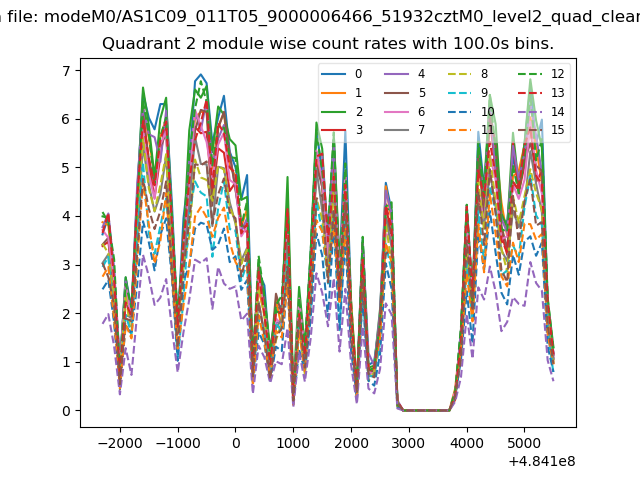
| Module-wise count rates for Quadrant B Data is divided into 100 sec bins |
 |
 |
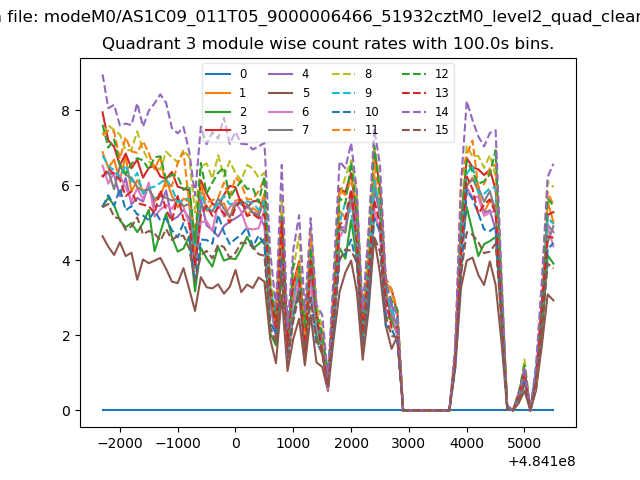
| Module-wise count rates for Quadrant C Data is divided into 100 sec bins |
 |
 |
| Module-wise count rates for Quadrant D Data is divided into 100 sec bins |
 |
 |
| Parameter | Plot |
|---|---|
| CZT HV Monitor | 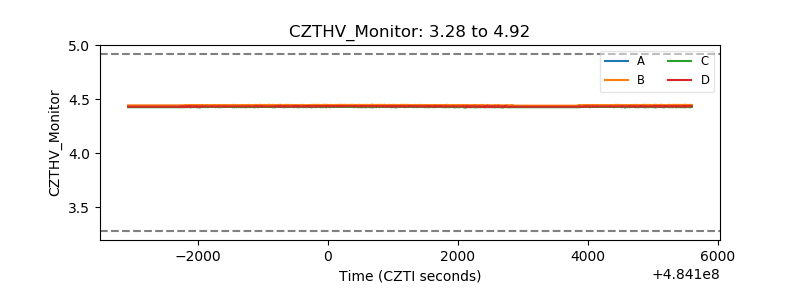 |
| D_VDD | 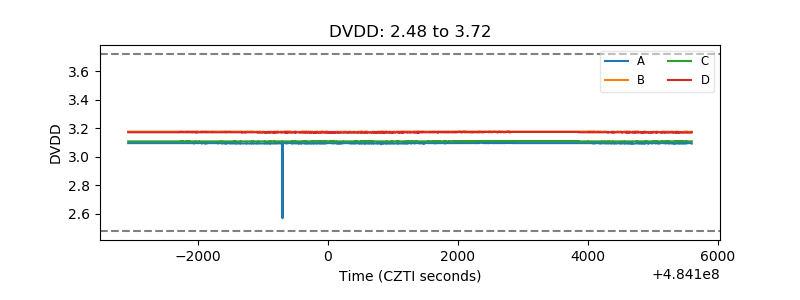 |
| Temperature 1 | 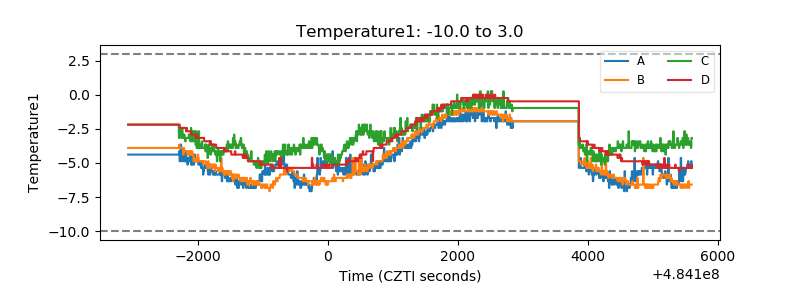 |
| Veto HV Monitor | 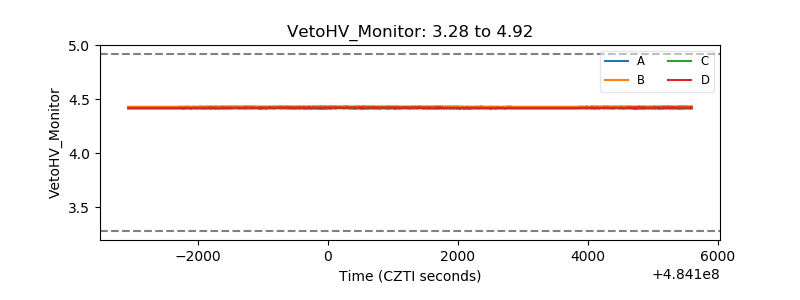 |
| Veto LLD | 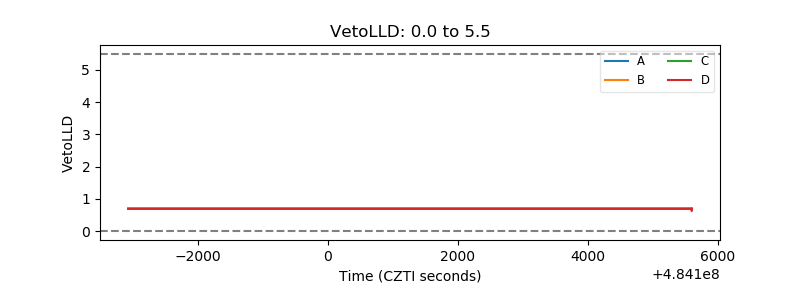 |
| Alpha Counter | 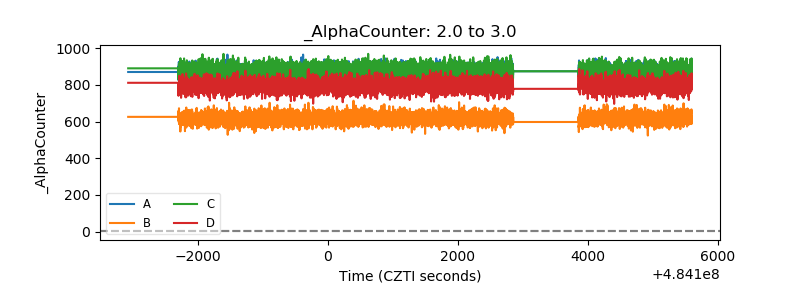 |
| _CPM_Rate | 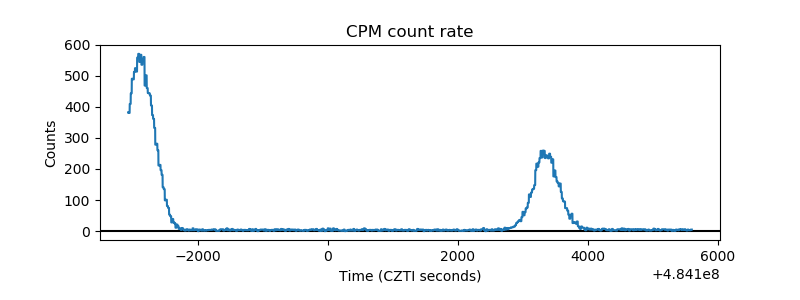 |
| CZT Counter | 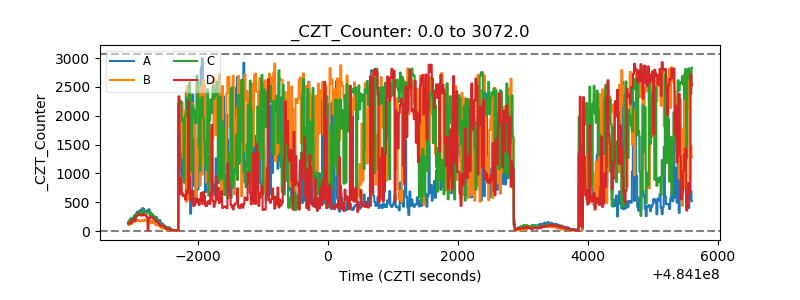 |
| +2.5 Volts monitor | 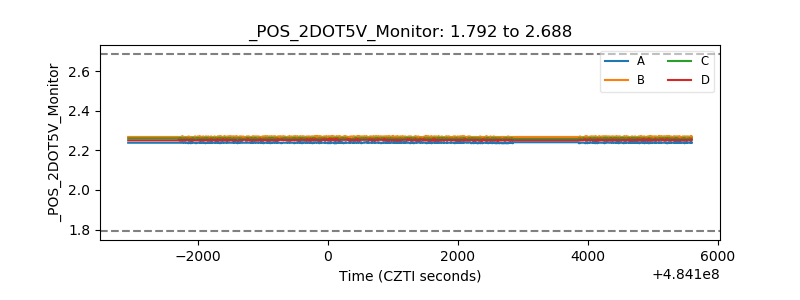 |
| +5 Volts monitor | 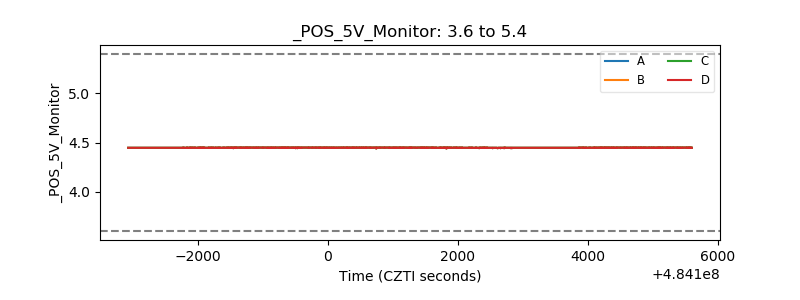 |
| _ROLL_ROT | 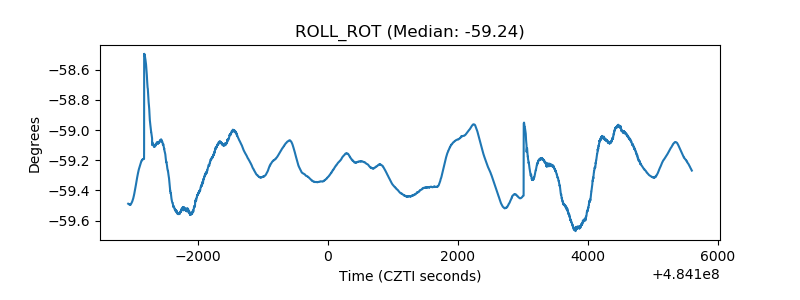 |
| _Roll_DEC | 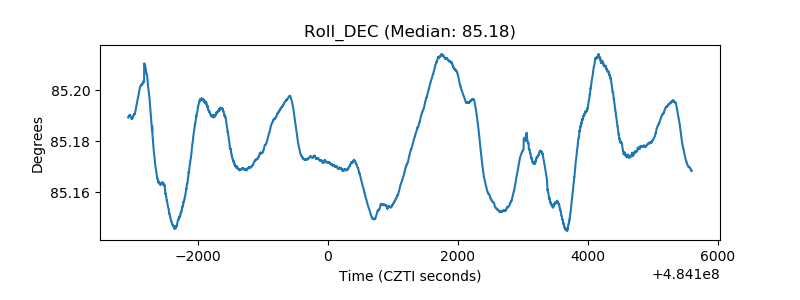 |
| _Roll_RA | 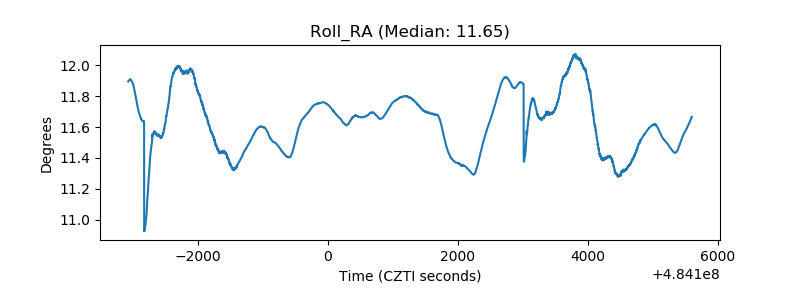 |
| Veto Counter | 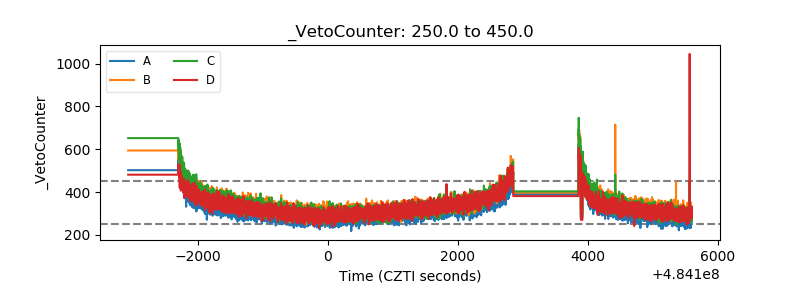 |