| Param | Original file | Final file |
|---|---|---|
| Filename | modeM0/AS1C09_011T05_9000006466_51933cztM0_level2.fits | modeM0/AS1C09_011T05_9000006466_51933cztM0_level2_quad_clean.evt |
| Size (bytes) | 838,609,920 | 59,322,240 |
| Size | 799.8 MB | 56.6 MB |
| Events in quadrant A | 4,912,937 | 449,622 |
| Events in quadrant B | 6,190,763 | 454,391 |
| Events in quadrant C | 7,973,251 | 346,788 |
| Events in quadrant D | 11,552,881 | 170,828 |
| Mode SS | |||
|---|---|---|---|
| Quadrant | BADHDUFLAG | Total packets | Discarded packets |
| A | 0 | 110 | 2 |
| B | 0 | 109 | 1 |
| C | 0 | 108 | 0 |
| D | 0 | 109 | 1 |
| Mode M0 | |||
|---|---|---|---|
| Quadrant | BADHDUFLAG | Total packets | Discarded packets |
| A | 0 | 18468 | 76 |
| B | 0 | 22145 | 28 |
| C | 0 | 27491 | 84 |
| D | 0 | 38186 | 178 |
| Mode M9 | |||
|---|---|---|---|
| Quadrant | BADHDUFLAG | Total packets | Discarded packets |
| A | 0 | 8 | 0 |
| B | 0 | 8 | 0 |
| C | 0 | 8 | 0 |
| D | 0 | 8 | 0 |
| Quadrant | Total seconds | Saturated seconds | Saturation percentage |
|---|---|---|---|
| A | 5346 | 591 | 11.054994% |
| B | 5351 | 1139 | 21.285741% |
| C | 5345 | 1844 | 34.499532% |
| D | 5342 | 3612 | 67.615125% |
Noise dominated data is calculated using 1-second bins in cleaned event files. If a bin has >2000 counts, and if more than 50% of those come from <1% of pixels, then it is considered to be noise-dominated and hence unusable.
| Quadrant | # 1 sec bins | Bins with >0 counts | Bins with >2000 counts | High rate bins dominated by noise | Noise dominated (total time) | Noise dominated (detector-on time) | Marked lightcurve |
|---|---|---|---|---|---|---|---|
| A | 6151 | 5349 | 491 | 491 | 7.98% | 9.18% | 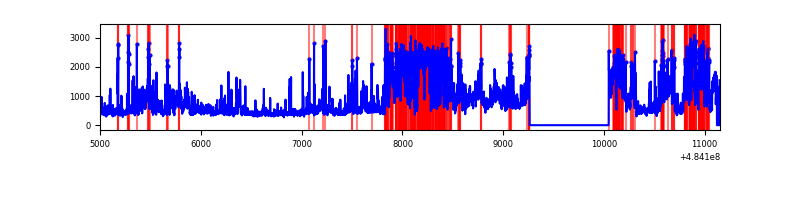 |
| B | 6151 | 5353 | 995 | 995 | 16.18% | 18.59% | 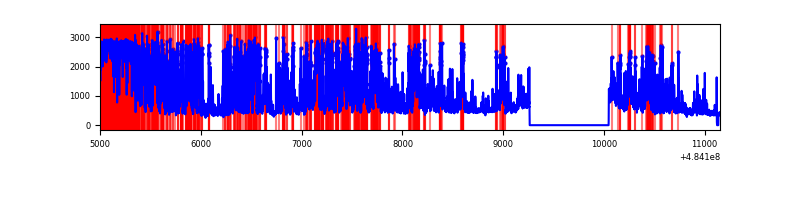 |
| C | 6154 | 5349 | 1757 | 1757 | 28.55% | 32.85% | 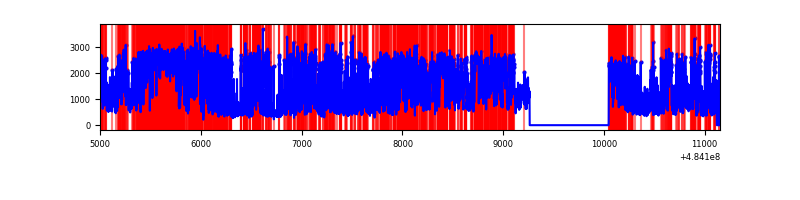 |
| D | 6152 | 5344 | 3740 | 3740 | 60.79% | 69.99% | 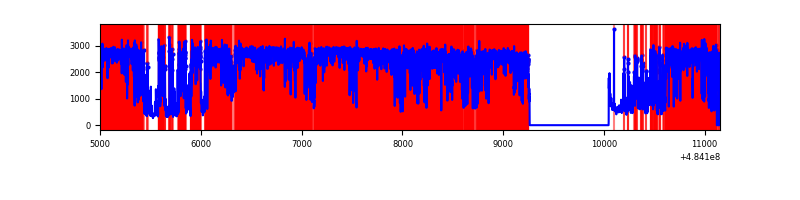 |
Top three noisy pixels from each quadrant. If the there are fewer than three noisy pixels in the level2.evt file, extra rows are filled as -1
| Pixel properties | Quadrant properties | ||||||
|---|---|---|---|---|---|---|---|
| Quadrant | DetID | PixID | Counts | Sigma | Mean | Median | Sigma |
| A | 7 | 64 | 1236521 | 9551.52 | 520 | 507 | 129.4 |
| A | 12 | 3 | 756143 | 5839.31 | 520 | 507 | 129.4 |
| A | 4 | 249 | 109576 | 842.85 | 520 | 507 | 129.4 |
| B | 12 | 32 | 3438259 | 31436.96 | 502 | 484 | 109.4 |
| B | 4 | 206 | 184422 | 1682.03 | 502 | 484 | 109.4 |
| B | 10 | 247 | 118745 | 1081.45 | 502 | 484 | 109.4 |
| C | 15 | 224 | 4072584 | 32453.71 | 449 | 444 | 125.5 |
| C | 9 | 38 | 863309 | 6876.77 | 449 | 444 | 125.5 |
| C | 15 | 189 | 260728 | 2074.38 | 449 | 444 | 125.5 |
| D | 6 | 42 | 7622935 | 76324.49 | 346 | 331 | 99.9 |
| D | 12 | 17 | 2041494 | 20437.99 | 346 | 331 | 99.9 |
| D | 3 | 12 | 239566 | 2395.44 | 346 | 331 | 99.9 |
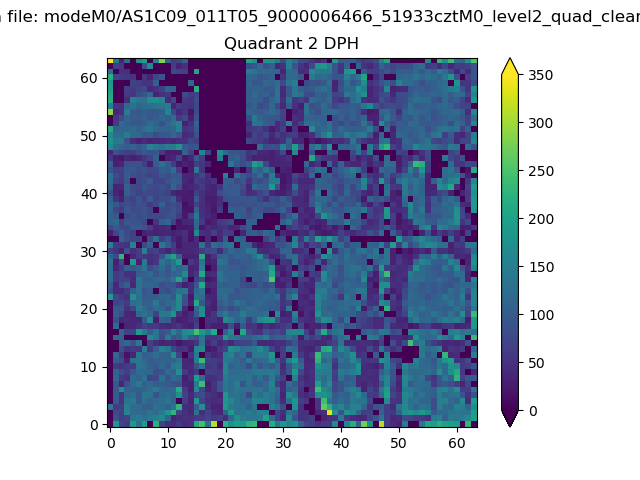
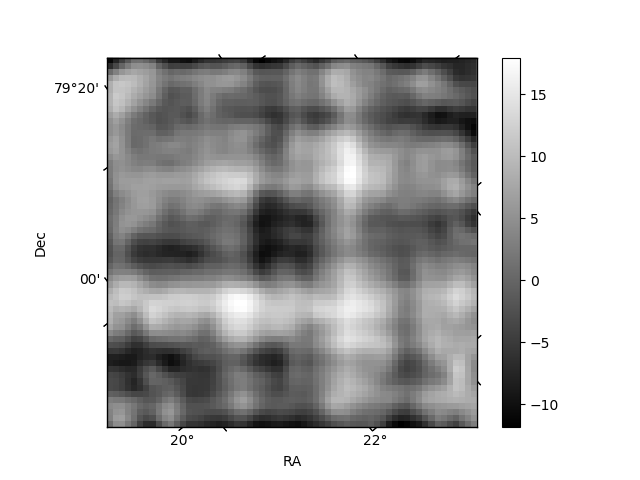
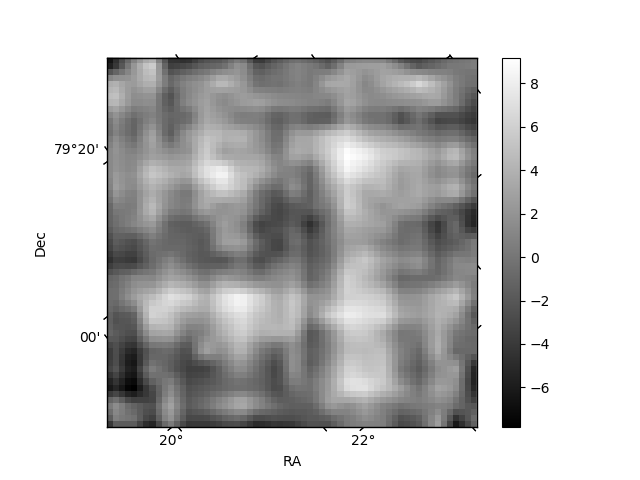
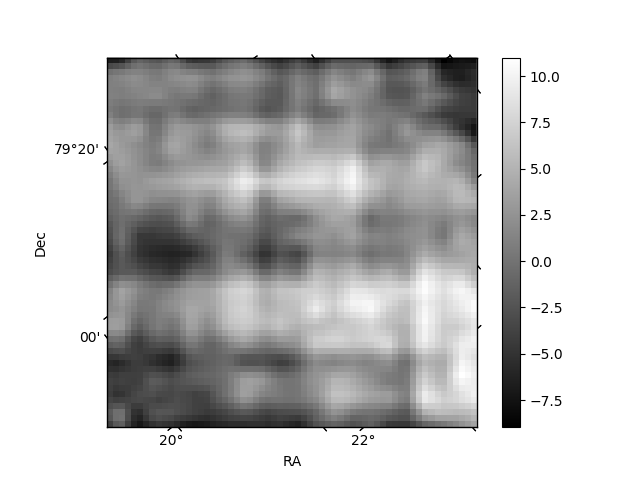
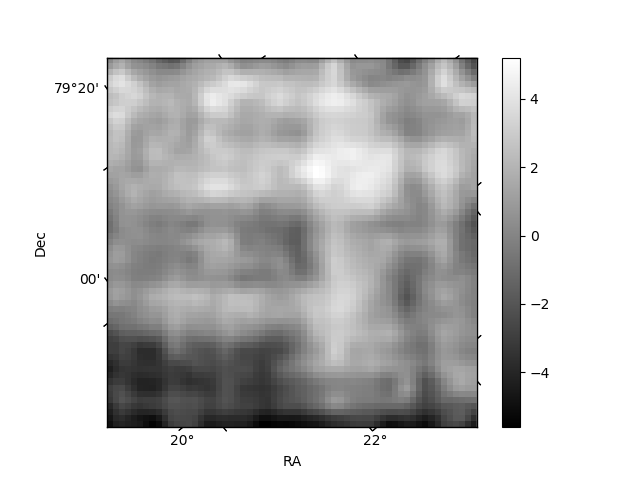
Histogram calculated using DETX and DETY for each event in the final _common_clean file
| Quadrant A | 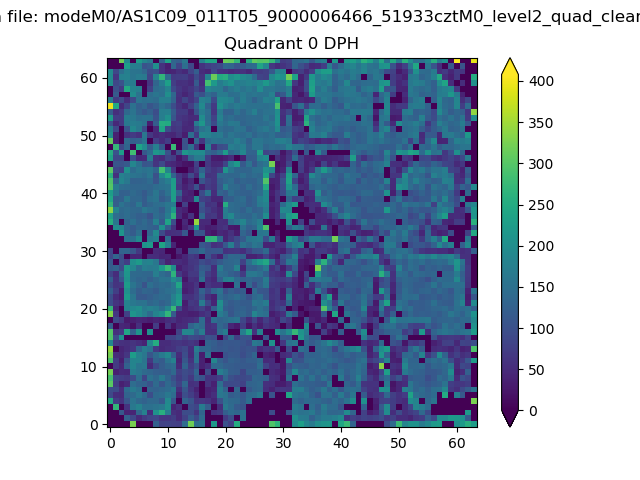 |
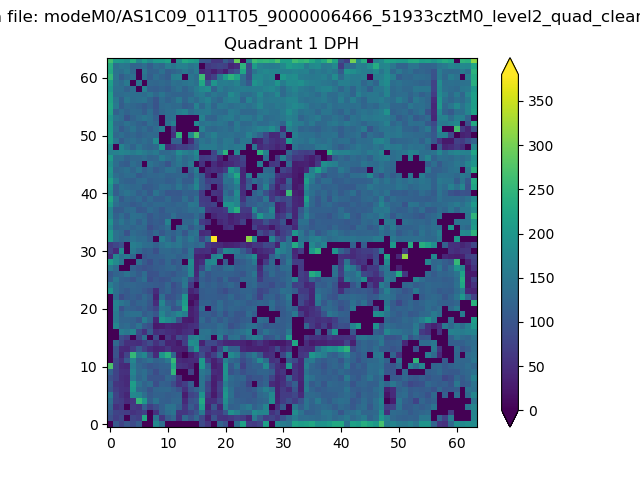 |
Quadrant B |
|---|---|---|---|
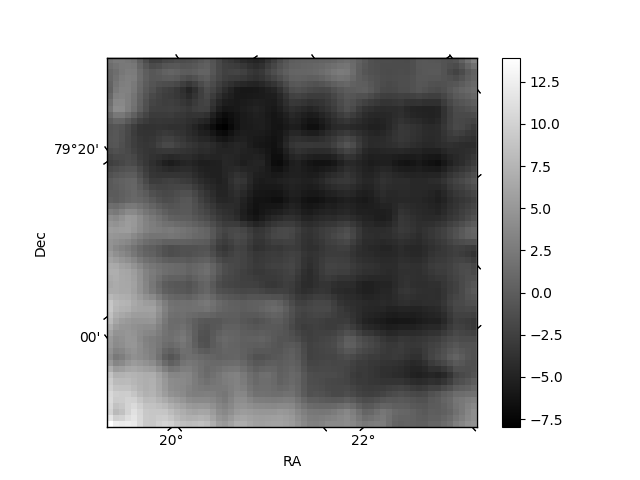
| Quadrant D | 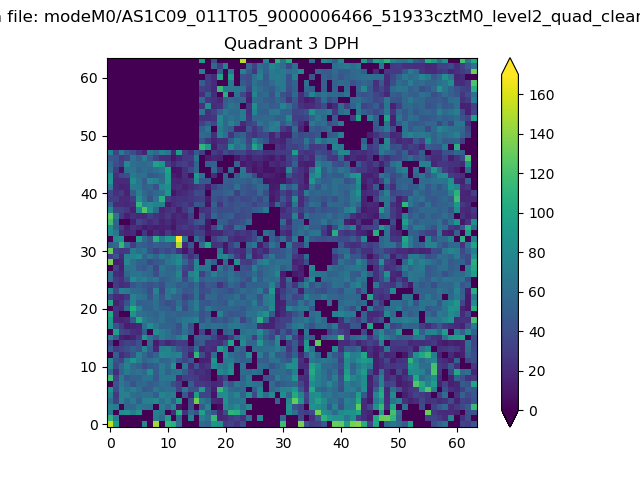 |
 |
Quadrant C |
| Plot type | Count rate plots | Images |
|---|---|---|
| Comparison with Poisson distribution Blue bars denote a histogram of data divided into 1 sec bins. Red curve is a Poisson curve with rate = median count rate of data. |
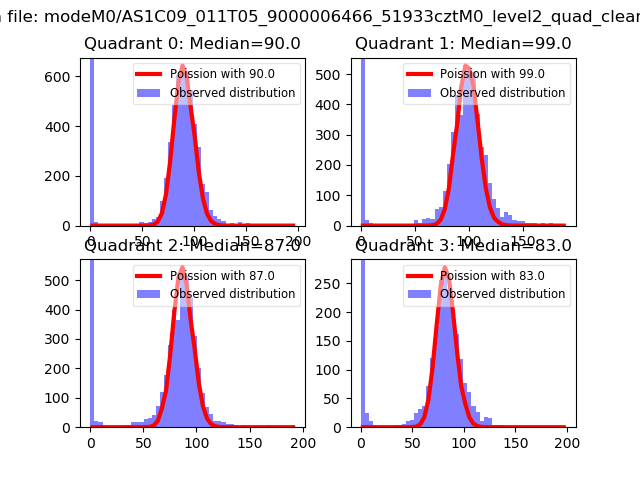 |
 |
| Quadrant-wise count rates Data is divided into 100 sec bins |
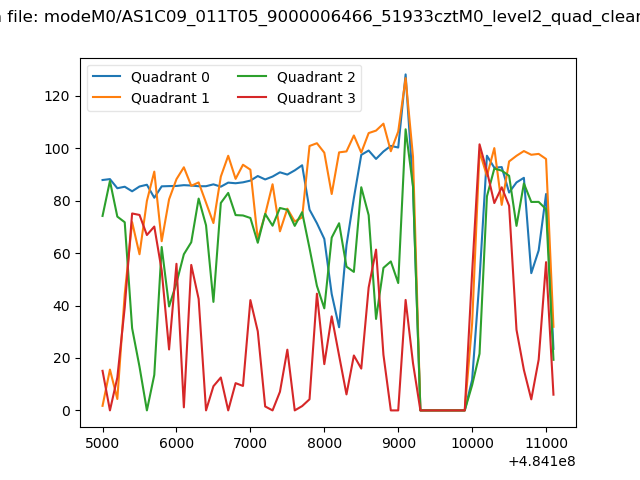 |
|
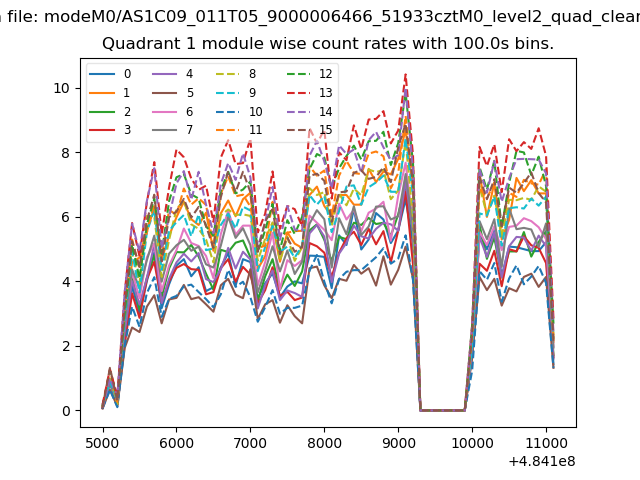
| Module-wise count rates for Quadrant A Data is divided into 100 sec bins |
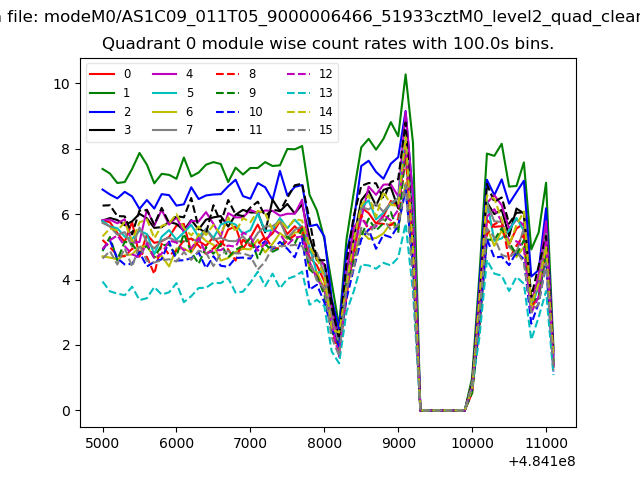 |
 |
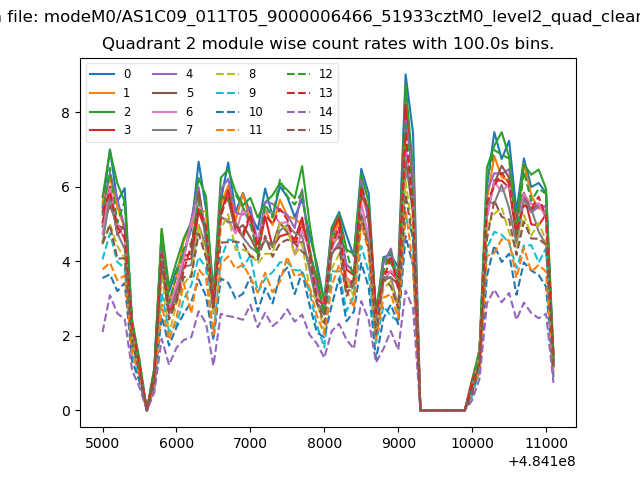
| Module-wise count rates for Quadrant B Data is divided into 100 sec bins |
 |
 |
| Module-wise count rates for Quadrant C Data is divided into 100 sec bins |
 |
 |
| Module-wise count rates for Quadrant D Data is divided into 100 sec bins |
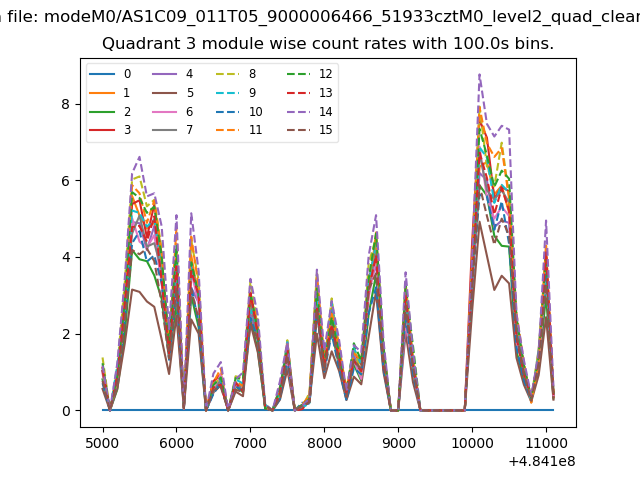 |
 |
| Parameter | Plot |
|---|---|
| CZT HV Monitor | 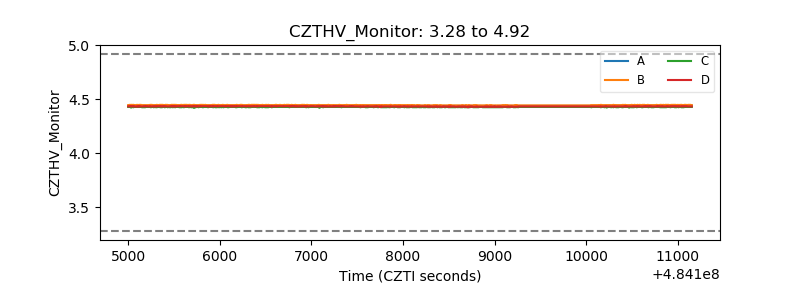 |
| D_VDD | 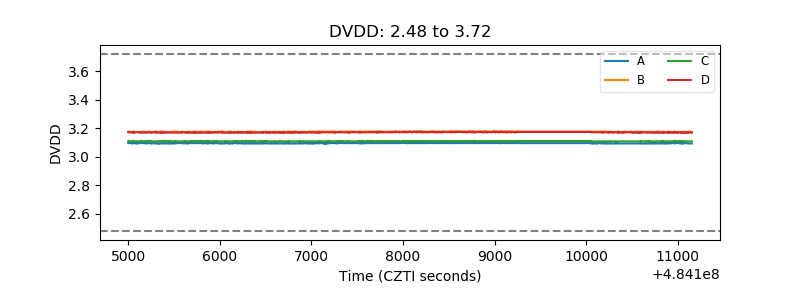 |
| Temperature 1 | 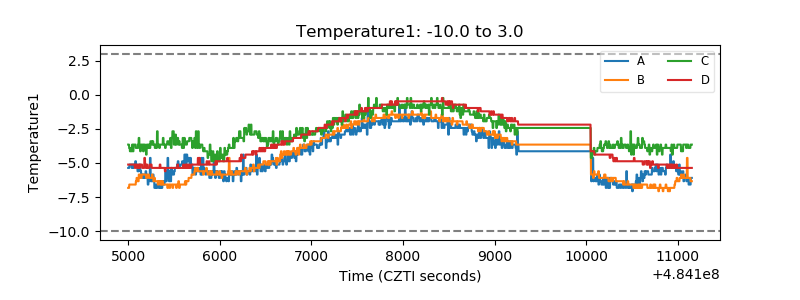 |
| Veto HV Monitor | 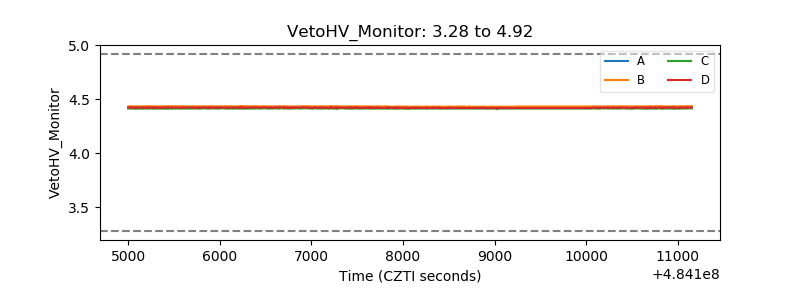 |
| Veto LLD | 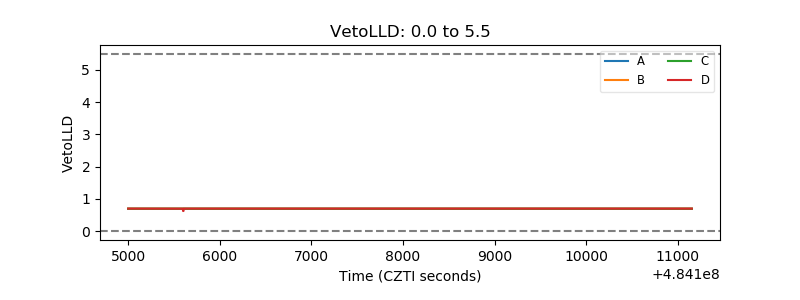 |
| Alpha Counter | 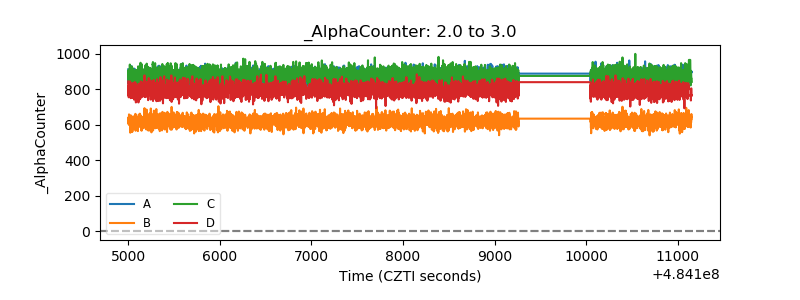 |
| _CPM_Rate | 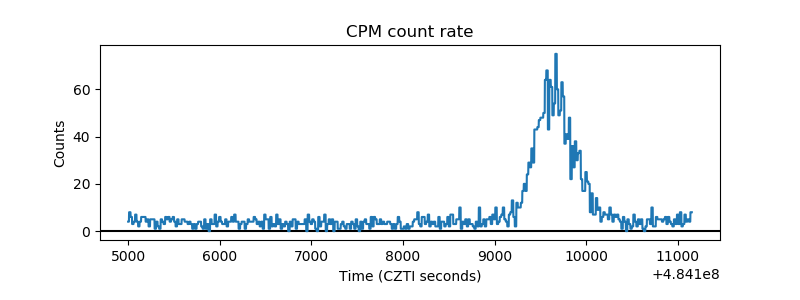 |
| CZT Counter | 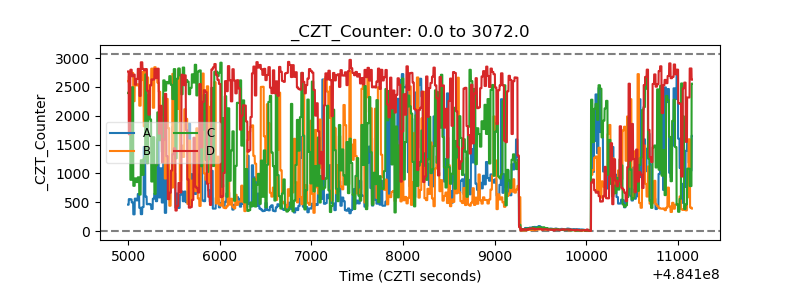 |
| +2.5 Volts monitor | 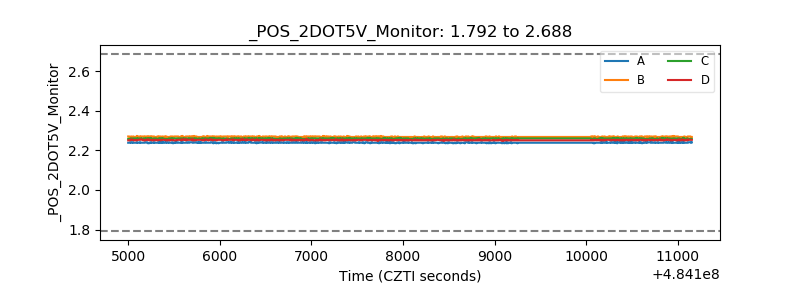 |
| +5 Volts monitor |  |
| _ROLL_ROT | 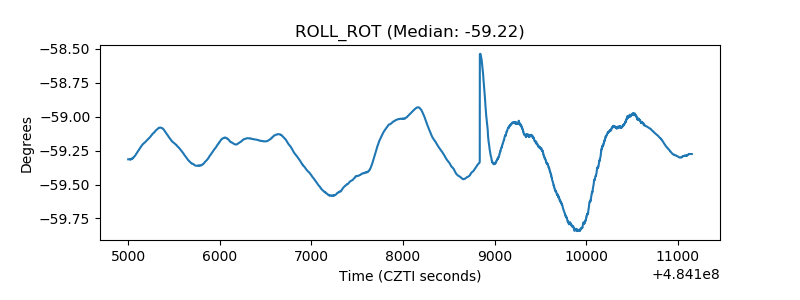 |
| _Roll_DEC | 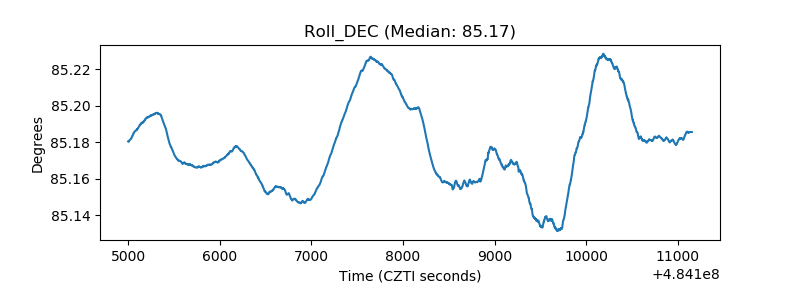 |
| _Roll_RA | 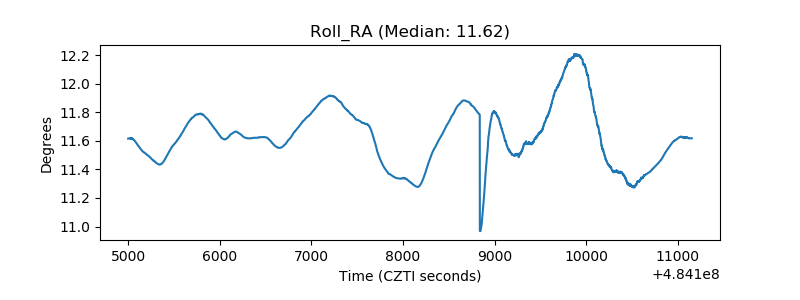 |
| Veto Counter | 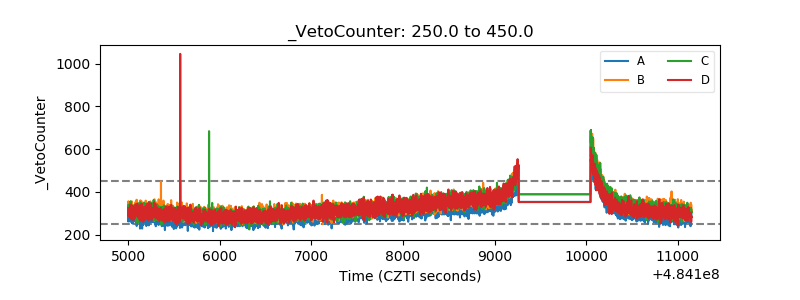 |