| Param | Original file | Final file |
|---|---|---|
| Filename | modeM0/AS1C09_011T05_9000006466_51934cztM0_level2.fits | modeM0/AS1C09_011T05_9000006466_51934cztM0_level2_quad_clean.evt |
| Size (bytes) | 1,058,883,840 | 79,833,600 |
| Size | 1009.8 MB | 76.1 MB |
| Events in quadrant A | 8,092,630 | 590,718 |
| Events in quadrant B | 4,836,545 | 683,064 |
| Events in quadrant C | 12,896,184 | 343,914 |
| Events in quadrant D | 12,811,112 | 293,976 |
| Mode SS | |||
|---|---|---|---|
| Quadrant | BADHDUFLAG | Total packets | Discarded packets |
| A | 0 | 146 | 0 |
| B | 0 | 146 | 0 |
| C | 0 | 146 | 0 |
| D | 0 | 146 | 0 |
| Mode M0 | |||
|---|---|---|---|
| Quadrant | BADHDUFLAG | Total packets | Discarded packets |
| A | 0 | 29145 | 1 |
| B | 0 | 19617 | 1 |
| C | 0 | 43342 | 1 |
| D | 0 | 43186 | 1 |
| Mode M9 | |||
|---|---|---|---|
| Quadrant | BADHDUFLAG | Total packets | Discarded packets |
| A | 0 | 1 | 0 |
| B | 0 | 1 | 0 |
| C | 0 | 1 | 0 |
| D | 0 | 1 | 0 |
| Quadrant | Total seconds | Saturated seconds | Saturation percentage |
|---|---|---|---|
| A | 7258 | 1053 | 14.508129% |
| B | 7258 | 514 | 7.081841% |
| C | 7258 | 3767 | 51.901350% |
| D | 7259 | 3919 | 53.988153% |
Noise dominated data is calculated using 1-second bins in cleaned event files. If a bin has >2000 counts, and if more than 50% of those come from <1% of pixels, then it is considered to be noise-dominated and hence unusable.
| Quadrant | # 1 sec bins | Bins with >0 counts | Bins with >2000 counts | High rate bins dominated by noise | Noise dominated (total time) | Noise dominated (detector-on time) | Marked lightcurve |
|---|---|---|---|---|---|---|---|
| A | 7348 | 7258 | 832 | 832 | 11.32% | 11.46% | 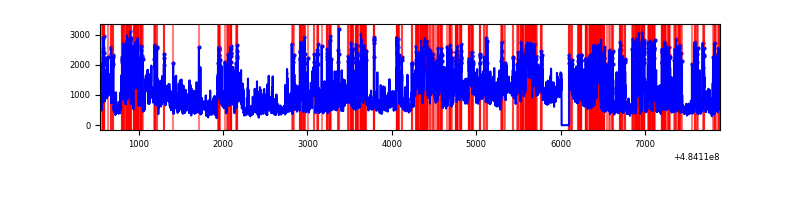 |
| B | 7347 | 7257 | 234 | 234 | 3.18% | 3.22% | 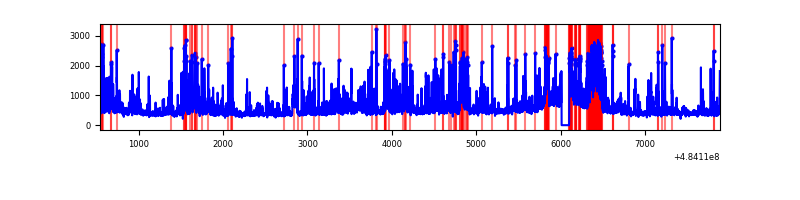 |
| C | 7348 | 7258 | 3584 | 3584 | 48.78% | 49.38% | 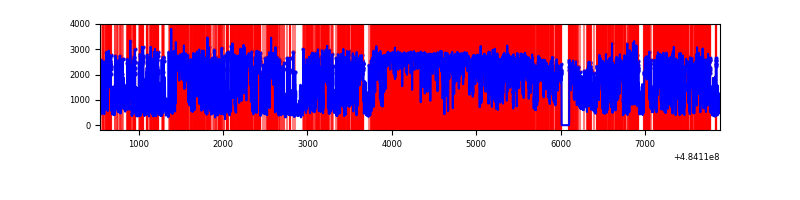 |
| D | 7349 | 7259 | 3716 | 3716 | 50.56% | 51.19% | 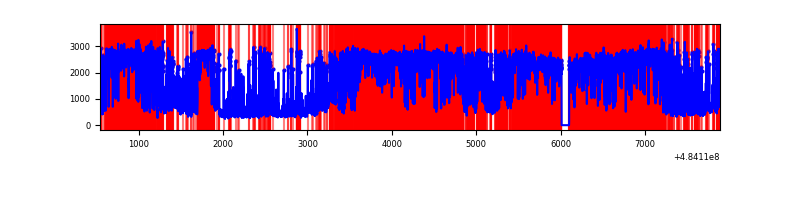 |
Top three noisy pixels from each quadrant. If the there are fewer than three noisy pixels in the level2.evt file, extra rows are filled as -1
| Pixel properties | Quadrant properties | ||||||
|---|---|---|---|---|---|---|---|
| Quadrant | DetID | PixID | Counts | Sigma | Mean | Median | Sigma |
| A | 12 | 3 | 1251647 | 7038.89 | 716 | 697 | 177.7 |
| A | 4 | 159 | 1217058 | 6844.27 | 716 | 697 | 177.7 |
| A | 7 | 64 | 840310 | 4724.37 | 716 | 697 | 177.7 |
| B | 12 | 32 | 509238 | 3254.28 | 730 | 704 | 156.3 |
| B | 4 | 171 | 294296 | 1878.8 | 730 | 704 | 156.3 |
| B | 4 | 206 | 209730 | 1337.63 | 730 | 704 | 156.3 |
| C | 15 | 224 | 4936879 | 32988.32 | 530 | 524 | 149.6 |
| C | 9 | 38 | 2977685 | 19895.56 | 530 | 524 | 149.6 |
| C | 0 | 193 | 1011551 | 6756.42 | 530 | 524 | 149.6 |
| D | 15 | 94 | 4653059 | 35687.58 | 454 | 435 | 130.4 |
| D | 12 | 17 | 3850653 | 29532.79 | 454 | 435 | 130.4 |
| D | 2 | 172 | 1578811 | 12106.81 | 454 | 435 | 130.4 |
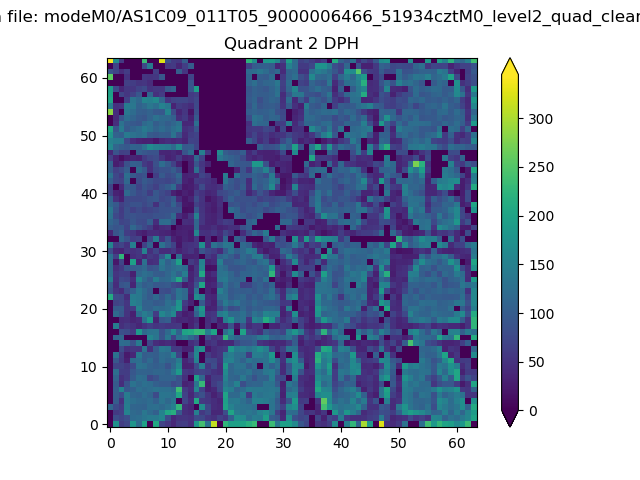
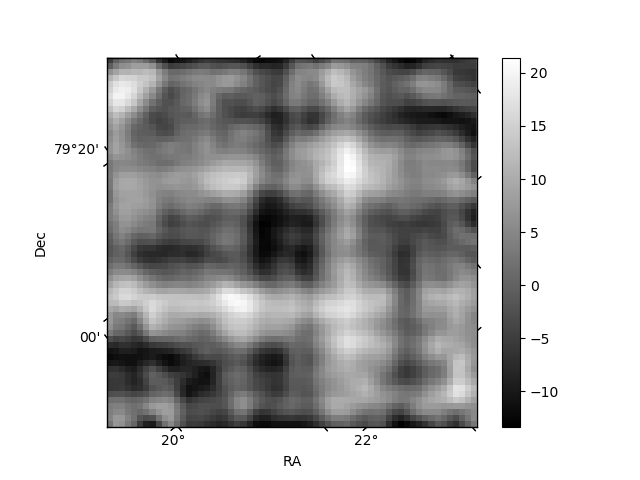
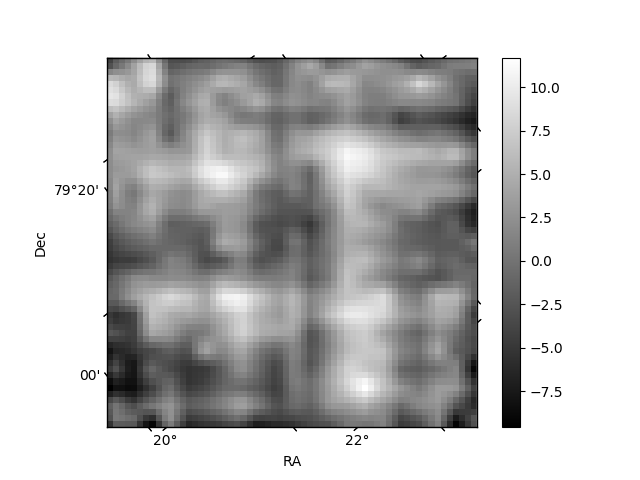
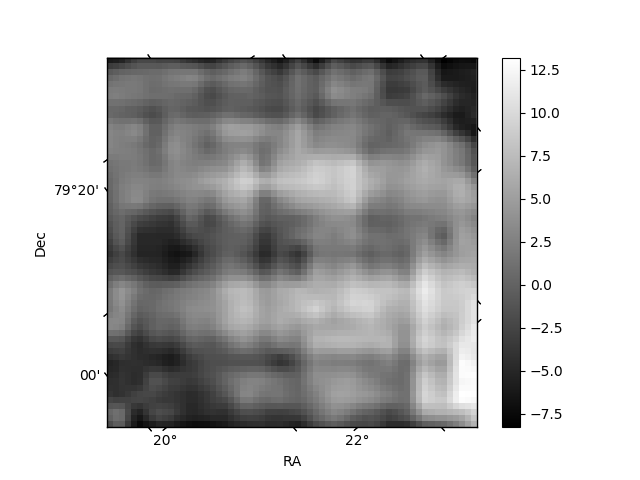
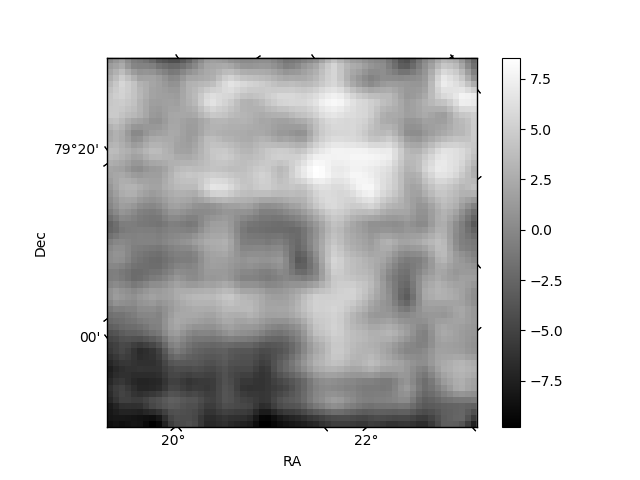
Histogram calculated using DETX and DETY for each event in the final _common_clean file
| Quadrant A | 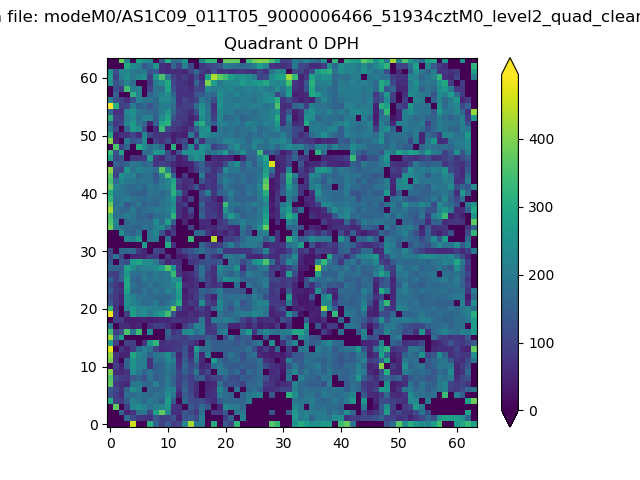 |
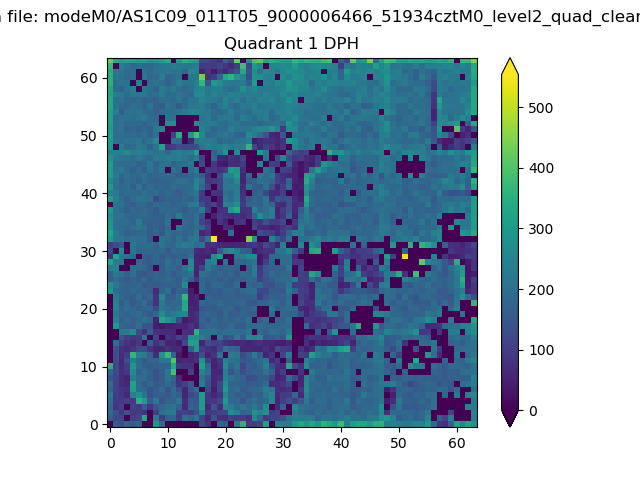 |
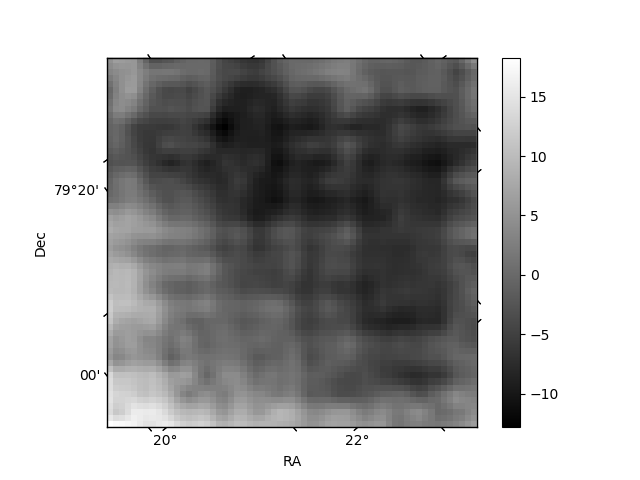
Quadrant B |
|---|---|---|---|
| Quadrant D | 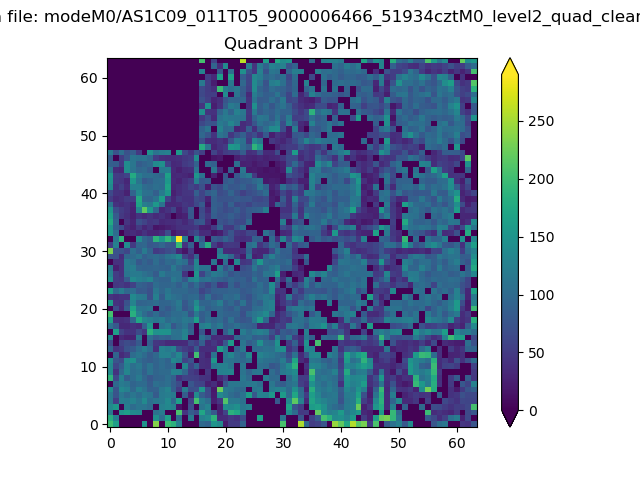 |
 |
Quadrant C |
| Plot type | Count rate plots | Images |
|---|---|---|
| Comparison with Poisson distribution Blue bars denote a histogram of data divided into 1 sec bins. Red curve is a Poisson curve with rate = median count rate of data. |
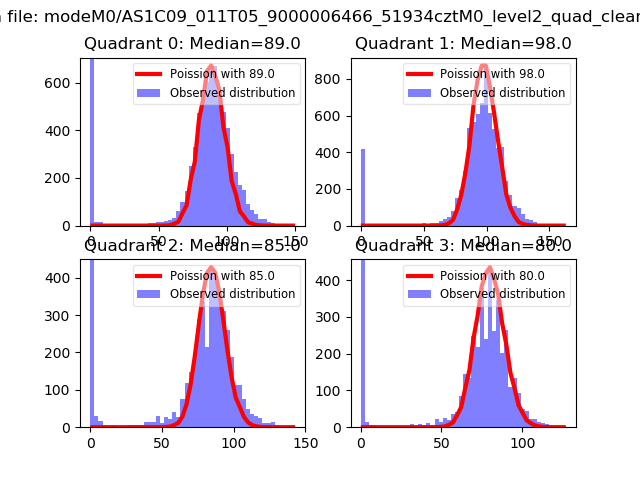 |
 |
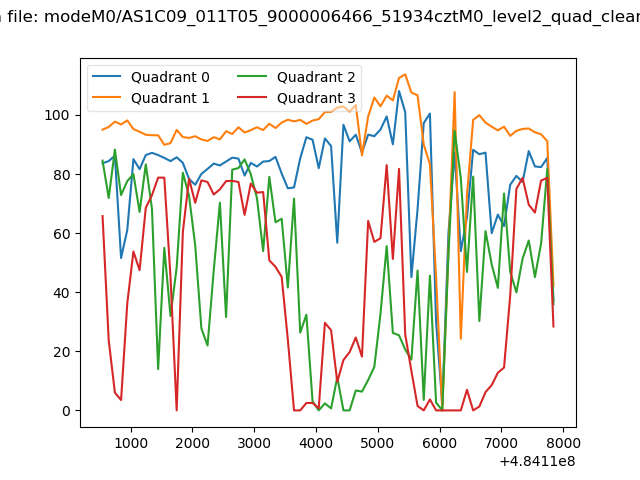
| Quadrant-wise count rates Data is divided into 100 sec bins |
 |
|
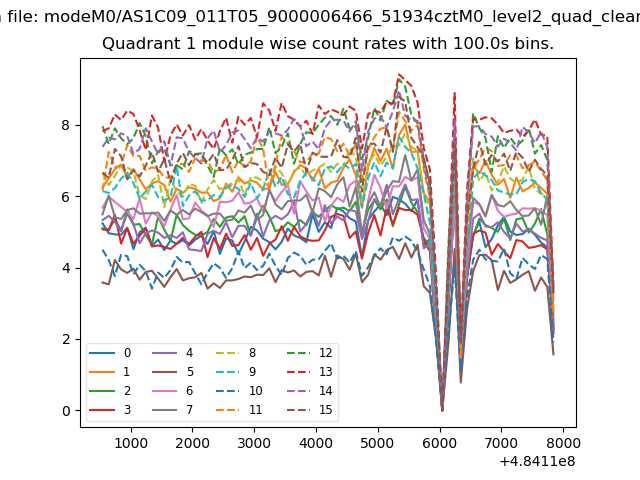
| Module-wise count rates for Quadrant A Data is divided into 100 sec bins |
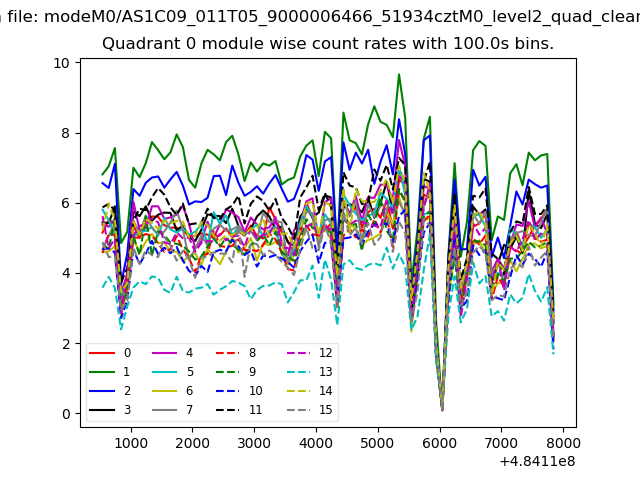 |
 |
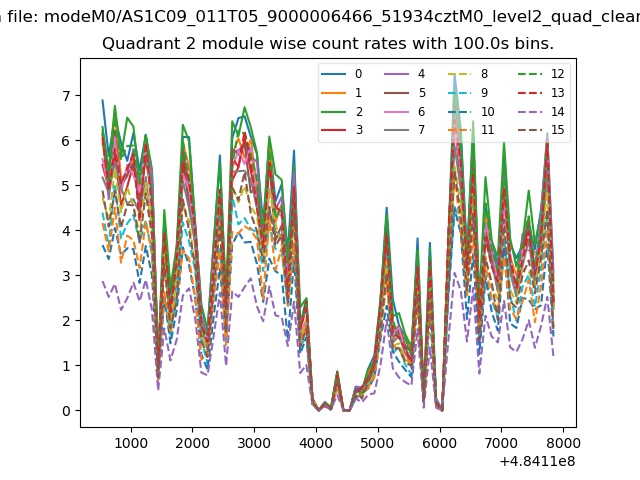
| Module-wise count rates for Quadrant B Data is divided into 100 sec bins |
 |
 |
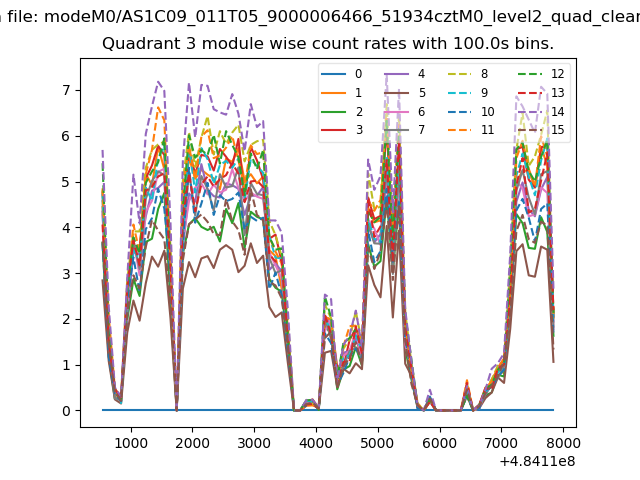
| Module-wise count rates for Quadrant C Data is divided into 100 sec bins |
 |
 |
| Module-wise count rates for Quadrant D Data is divided into 100 sec bins |
 |
 |
| Parameter | Plot |
|---|---|
| CZT HV Monitor | 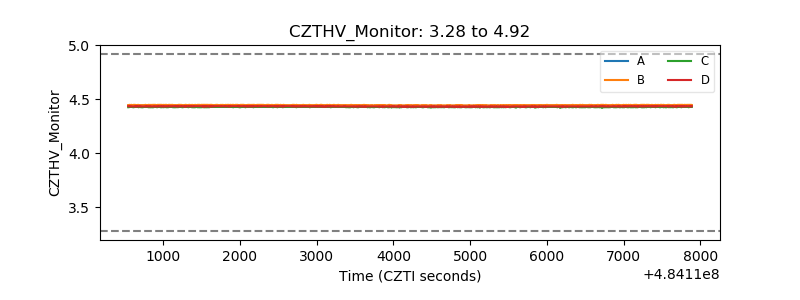 |
| D_VDD | 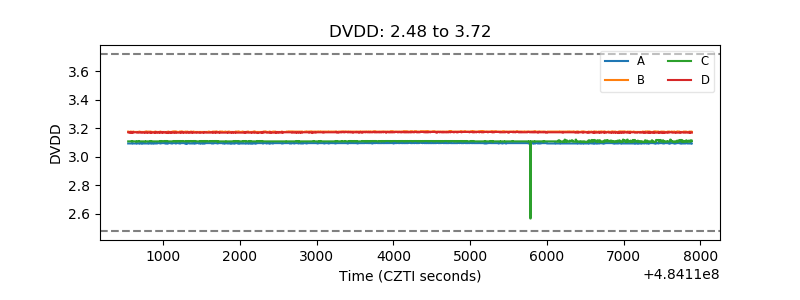 |
| Temperature 1 | 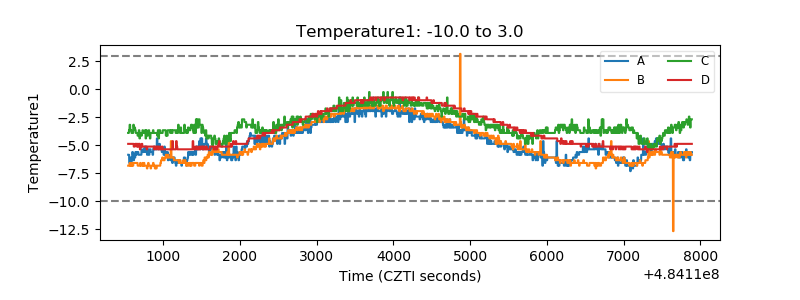 |
| Veto HV Monitor | 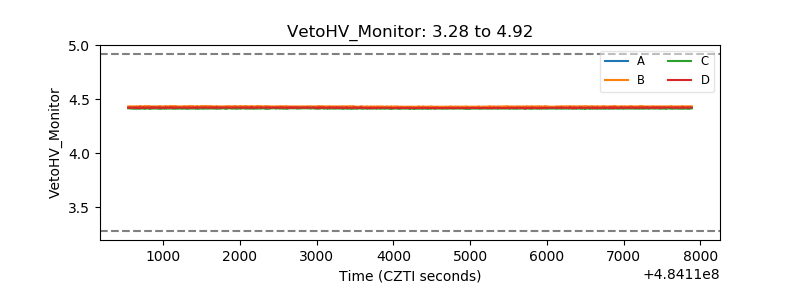 |
| Veto LLD | 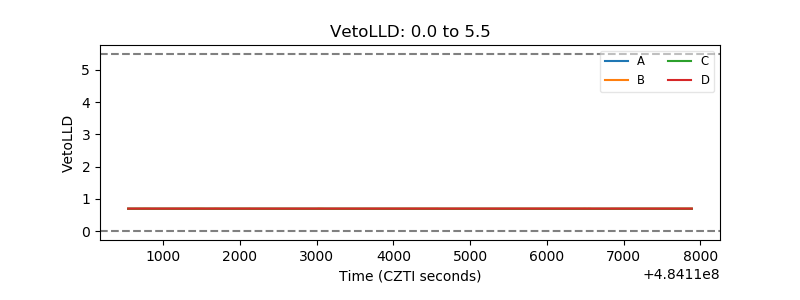 |
| Alpha Counter | 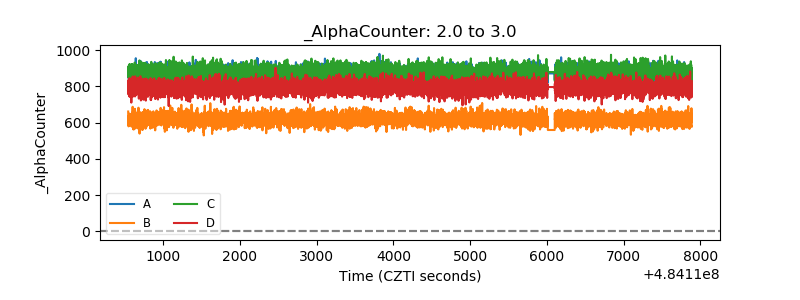 |
| _CPM_Rate | 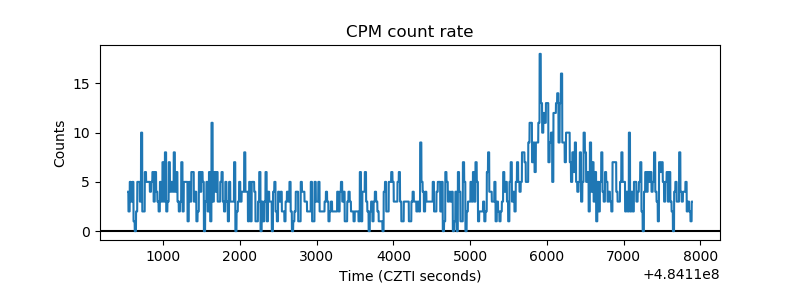 |
| CZT Counter | 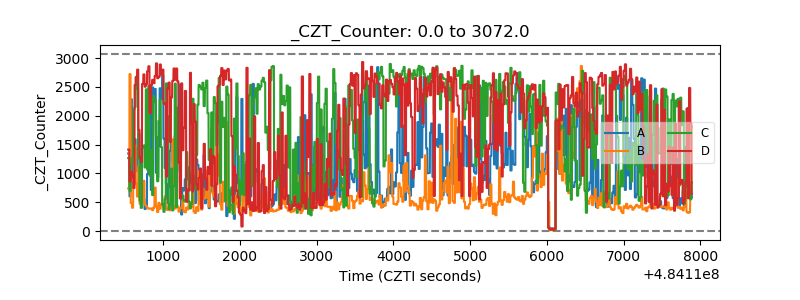 |
| +2.5 Volts monitor | 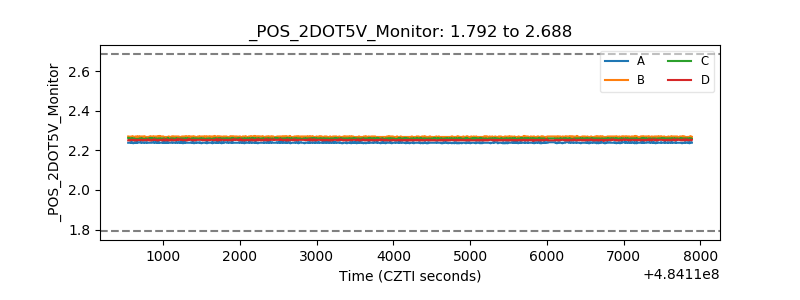 |
| +5 Volts monitor | 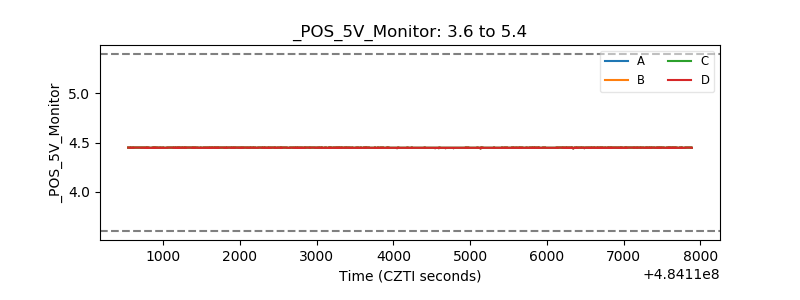 |
| _ROLL_ROT | 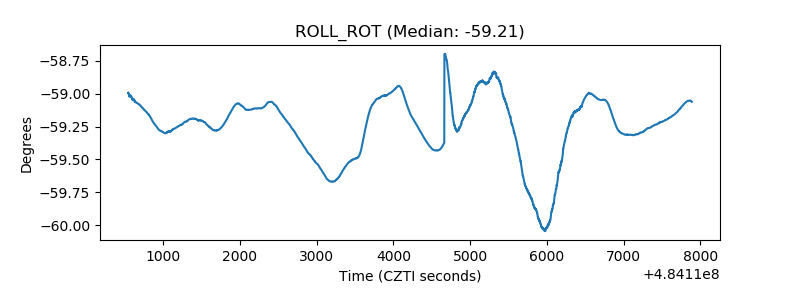 |
| _Roll_DEC | 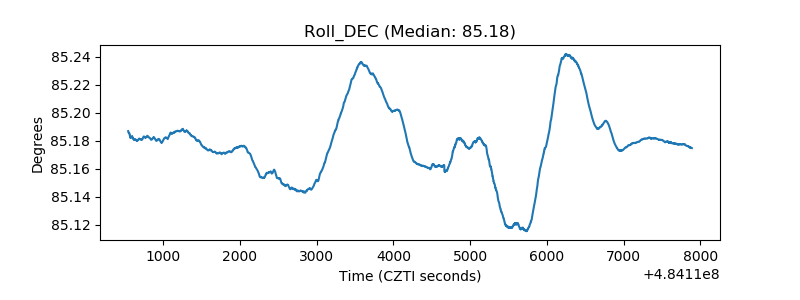 |
| _Roll_RA | 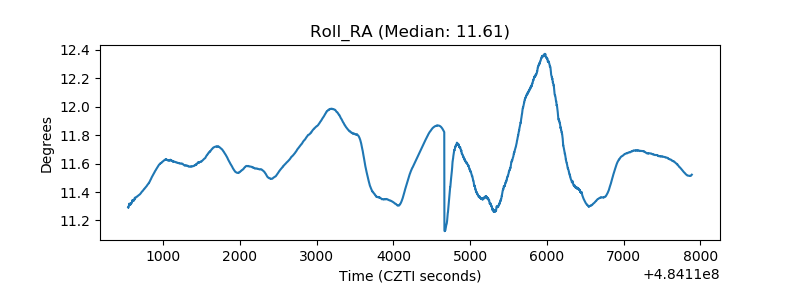 |
| Veto Counter | 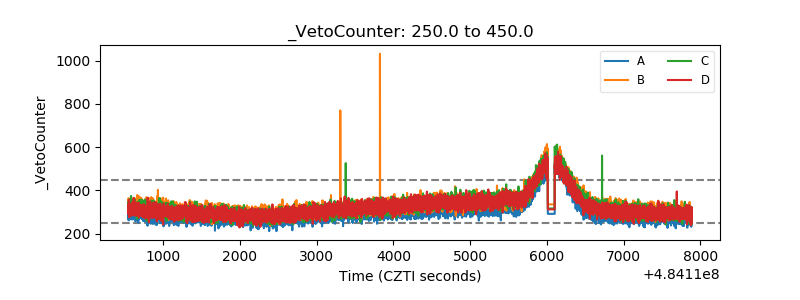 |