| Param | Original file | Final file |
|---|---|---|
| Filename | modeM0/AS1C09_011T05_9000006466_51935cztM0_level2.fits | modeM0/AS1C09_011T05_9000006466_51935cztM0_level2_quad_clean.evt |
| Size (bytes) | 1,072,877,760 | 82,673,280 |
| Size | 1023.2 MB | 78.8 MB |
| Events in quadrant A | 8,188,392 | 591,635 |
| Events in quadrant B | 4,611,997 | 713,175 |
| Events in quadrant C | 12,661,305 | 365,487 |
| Events in quadrant D | 13,685,574 | 320,065 |
| Mode SS | |||
|---|---|---|---|
| Quadrant | BADHDUFLAG | Total packets | Discarded packets |
| A | 0 | 148 | 0 |
| B | 0 | 148 | 0 |
| C | 0 | 148 | 0 |
| D | 0 | 148 | 0 |
| Mode M0 | |||
|---|---|---|---|
| Quadrant | BADHDUFLAG | Total packets | Discarded packets |
| A | 0 | 29454 | 0 |
| B | 0 | 18953 | 0 |
| C | 0 | 42730 | 0 |
| D | 0 | 45698 | 0 |
| Quadrant | Total seconds | Saturated seconds | Saturation percentage |
|---|---|---|---|
| A | 7354 | 1158 | 15.746532% |
| B | 7355 | 277 | 3.766145% |
| C | 7355 | 3678 | 50.006798% |
| D | 7355 | 3842 | 52.236574% |
Noise dominated data is calculated using 1-second bins in cleaned event files. If a bin has >2000 counts, and if more than 50% of those come from <1% of pixels, then it is considered to be noise-dominated and hence unusable.
| Quadrant | # 1 sec bins | Bins with >0 counts | Bins with >2000 counts | High rate bins dominated by noise | Noise dominated (total time) | Noise dominated (detector-on time) | Marked lightcurve |
|---|---|---|---|---|---|---|---|
| A | 7354 | 7354 | 1052 | 1052 | 14.31% | 14.31% | 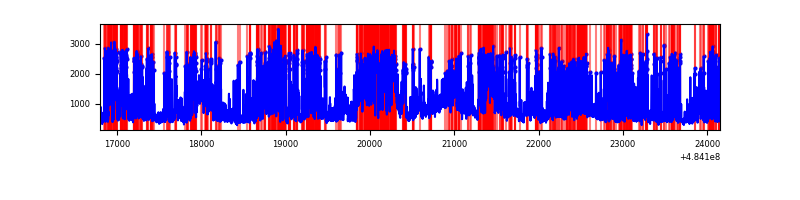 |
| B | 7355 | 7355 | 223 | 223 | 3.03% | 3.03% | 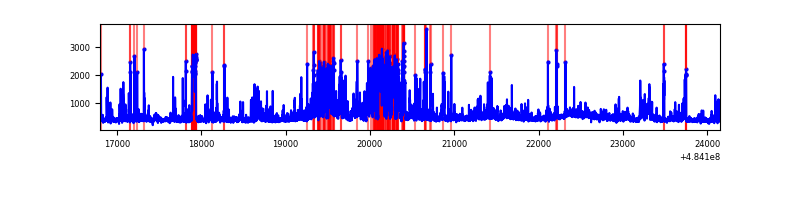 |
| C | 7355 | 7355 | 3459 | 3459 | 47.03% | 47.03% | 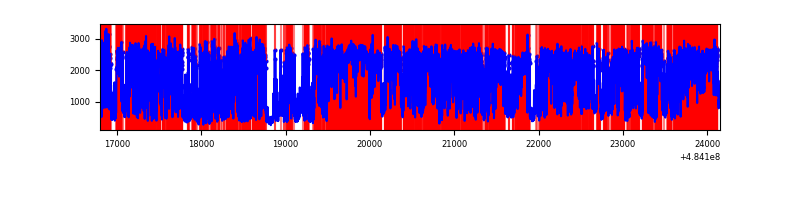 |
| D | 7354 | 7354 | 3851 | 3851 | 52.37% | 52.37% | 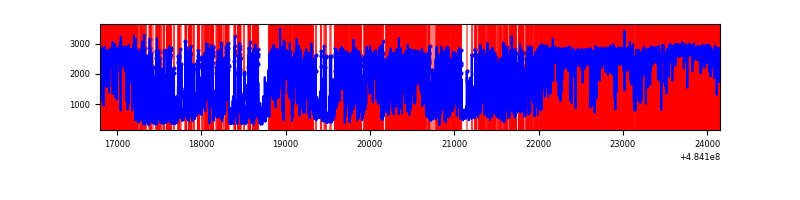 |
Top three noisy pixels from each quadrant. If the there are fewer than three noisy pixels in the level2.evt file, extra rows are filled as -1
| Pixel properties | Quadrant properties | ||||||
|---|---|---|---|---|---|---|---|
| Quadrant | DetID | PixID | Counts | Sigma | Mean | Median | Sigma |
| A | 4 | 159 | 1910578 | 10933.74 | 703 | 684 | 174.7 |
| A | 7 | 64 | 1003440 | 5740.56 | 703 | 684 | 174.7 |
| A | 12 | 3 | 929992 | 5320.09 | 703 | 684 | 174.7 |
| B | 4 | 206 | 608579 | 3869.41 | 736 | 712 | 157.1 |
| B | 10 | 44 | 190159 | 1205.94 | 736 | 712 | 157.1 |
| B | 4 | 171 | 153977 | 975.62 | 736 | 712 | 157.1 |
| C | 15 | 224 | 6622528 | 42327.7 | 554 | 550 | 156.4 |
| C | 15 | 230 | 1636820 | 10459.04 | 554 | 550 | 156.4 |
| C | 0 | 193 | 767706 | 4903.66 | 554 | 550 | 156.4 |
| D | 12 | 17 | 4011493 | 27183.21 | 509 | 486 | 147.6 |
| D | 15 | 94 | 2092351 | 14176.89 | 509 | 486 | 147.6 |
| D | 0 | 33 | 1951369 | 13221.43 | 509 | 486 | 147.6 |
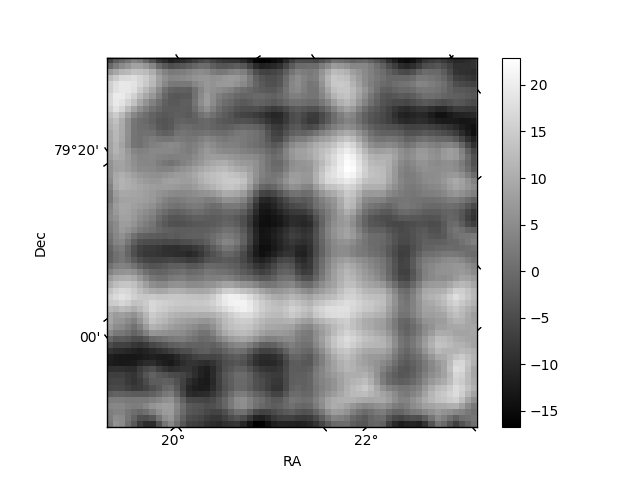
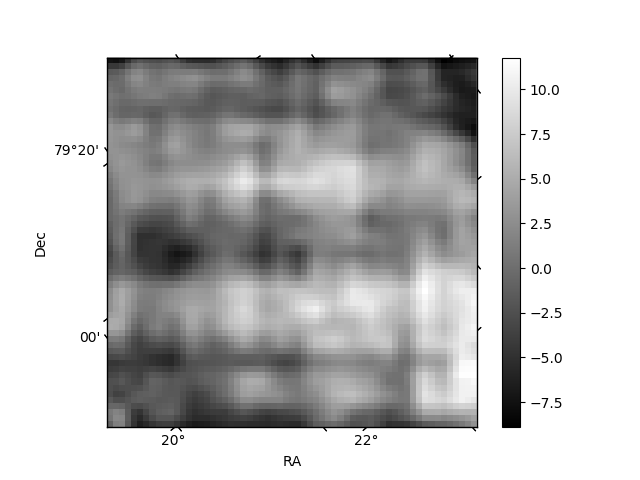
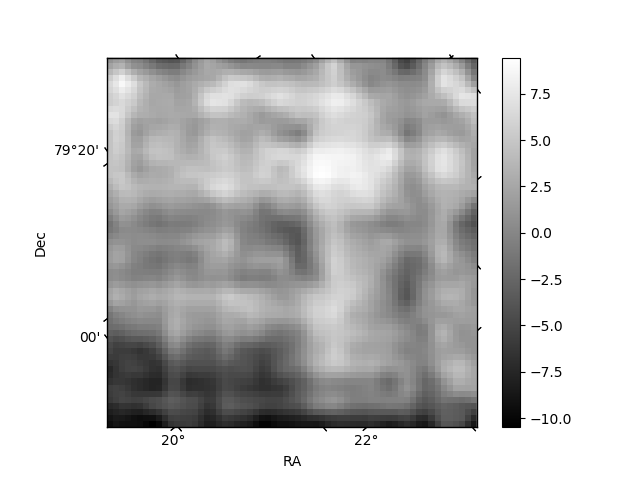
Histogram calculated using DETX and DETY for each event in the final _common_clean file
| Quadrant A | 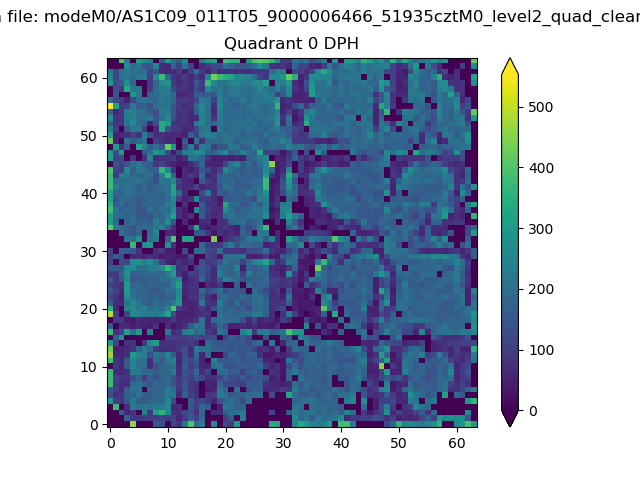 |
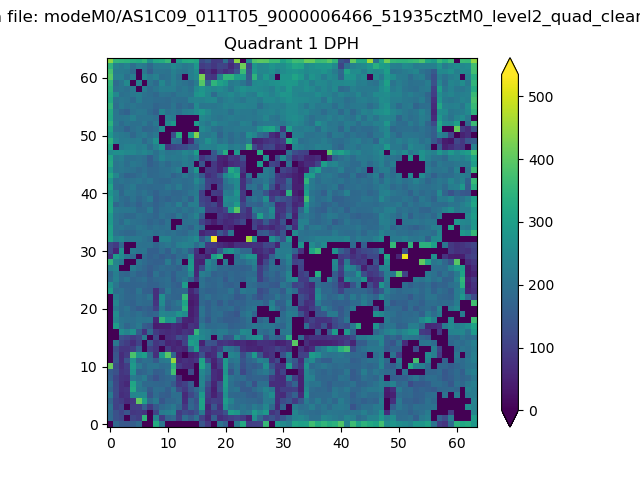 |
Quadrant B |
|---|---|---|---|
| Quadrant D | 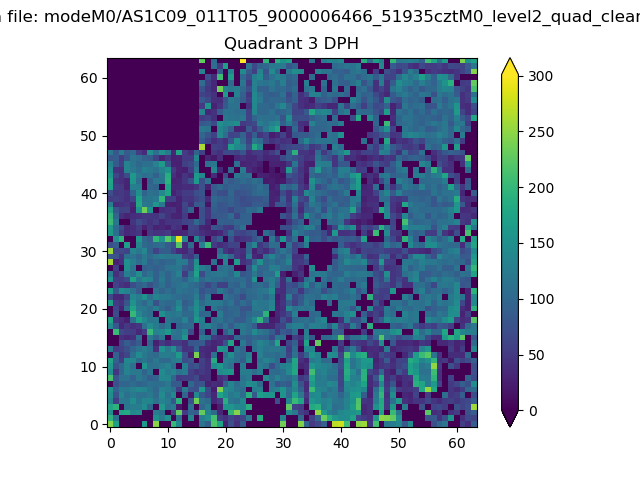 |
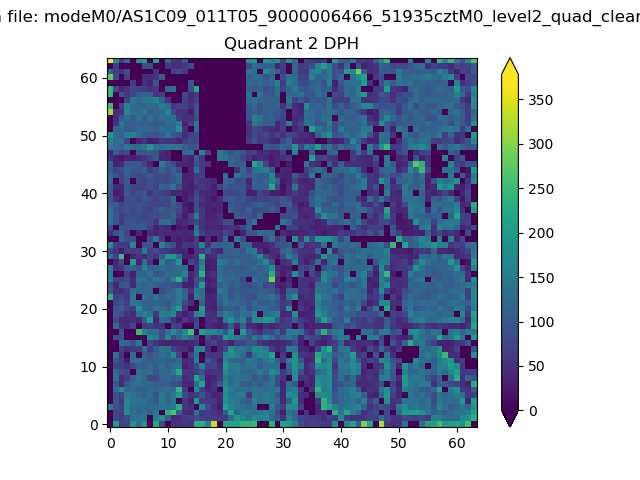 |
Quadrant C |
| Plot type | Count rate plots | Images |
|---|---|---|
| Comparison with Poisson distribution Blue bars denote a histogram of data divided into 1 sec bins. Red curve is a Poisson curve with rate = median count rate of data. |
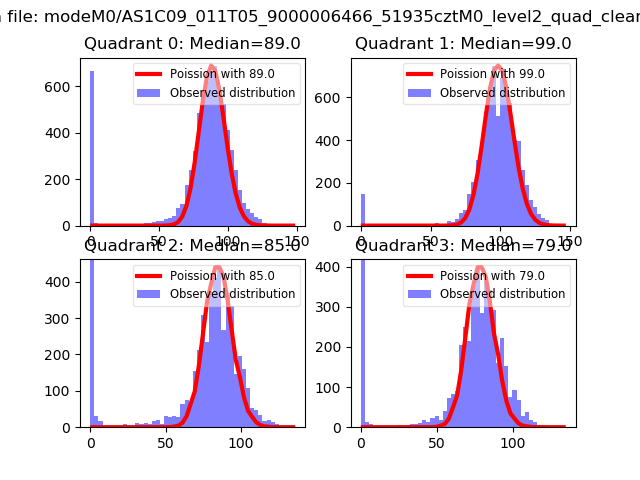 |
 |
| Quadrant-wise count rates Data is divided into 100 sec bins |
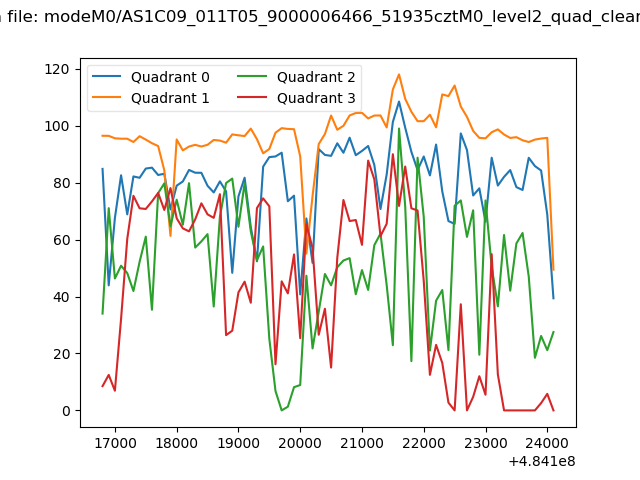 |
|
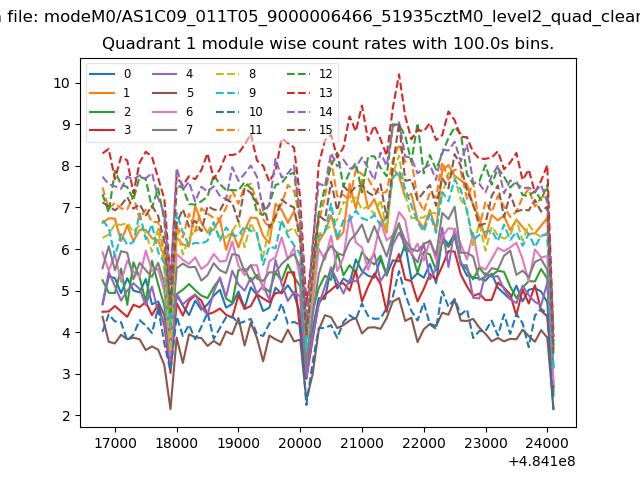
| Module-wise count rates for Quadrant A Data is divided into 100 sec bins |
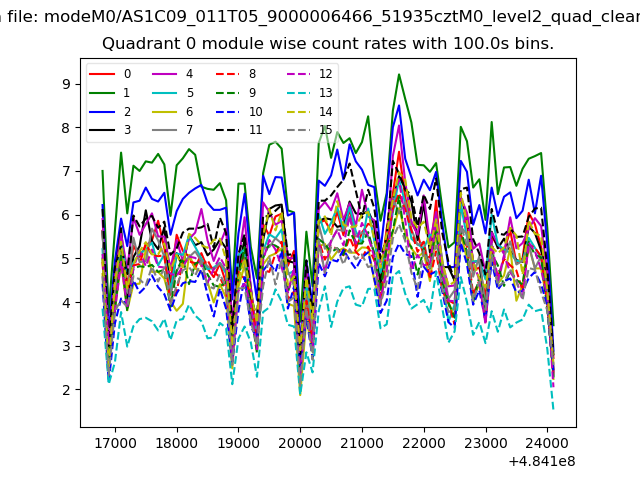 |
 |
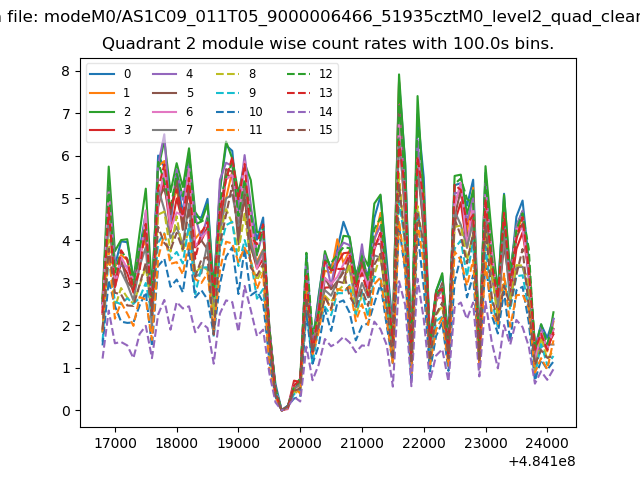
| Module-wise count rates for Quadrant B Data is divided into 100 sec bins |
 |
 |
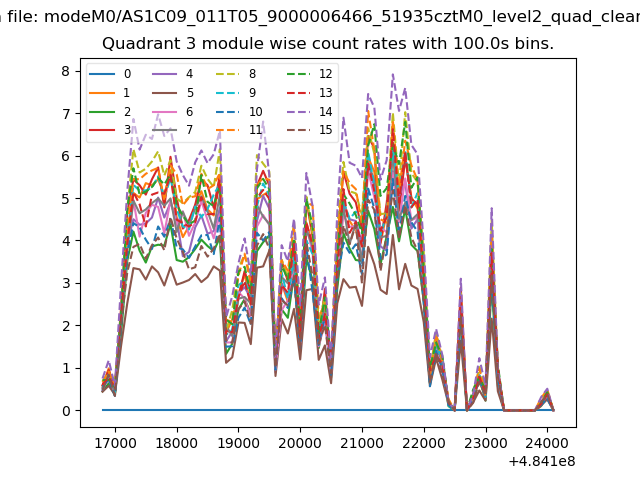
| Module-wise count rates for Quadrant C Data is divided into 100 sec bins |
 |
 |
| Module-wise count rates for Quadrant D Data is divided into 100 sec bins |
 |
 |
| Parameter | Plot |
|---|---|
| CZT HV Monitor |  |
| D_VDD | 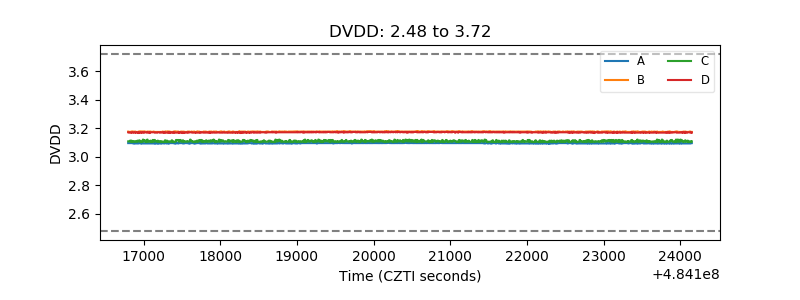 |
| Temperature 1 | 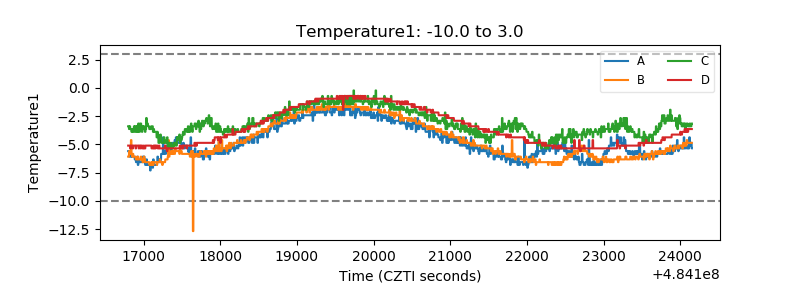 |
| Veto HV Monitor | 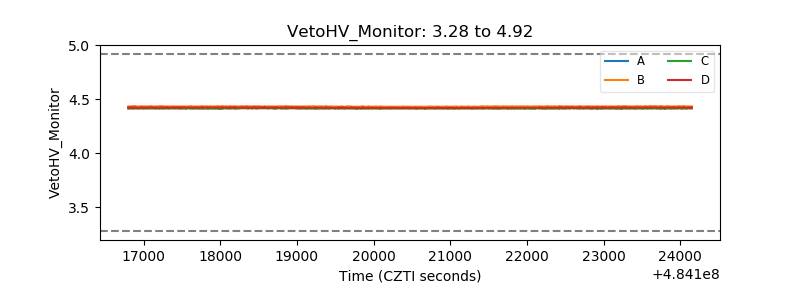 |
| Veto LLD | 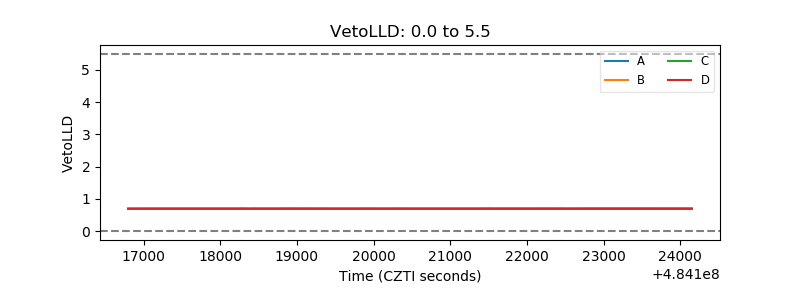 |
| Alpha Counter | 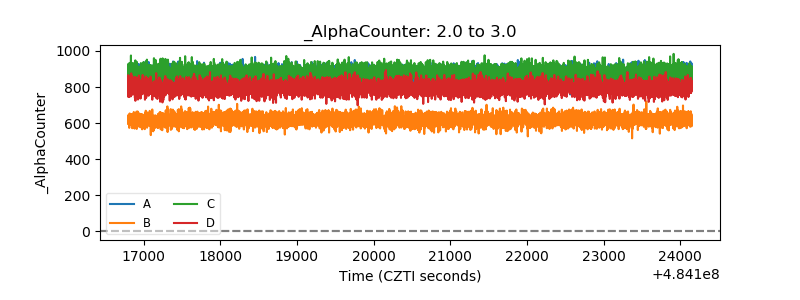 |
| _CPM_Rate | 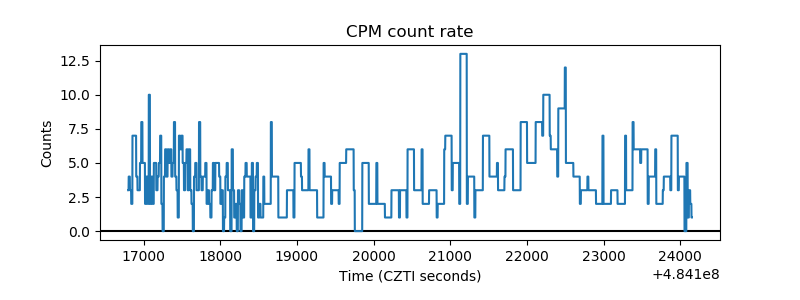 |
| CZT Counter | 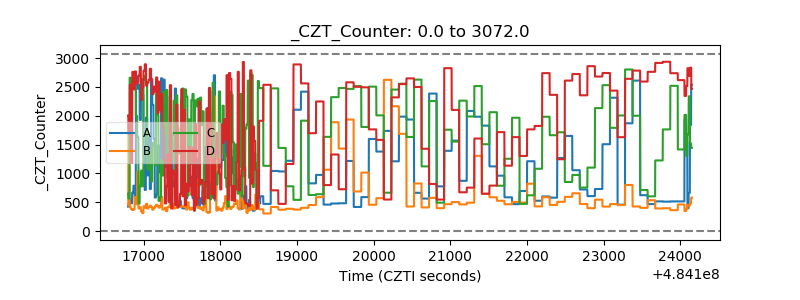 |
| +2.5 Volts monitor | 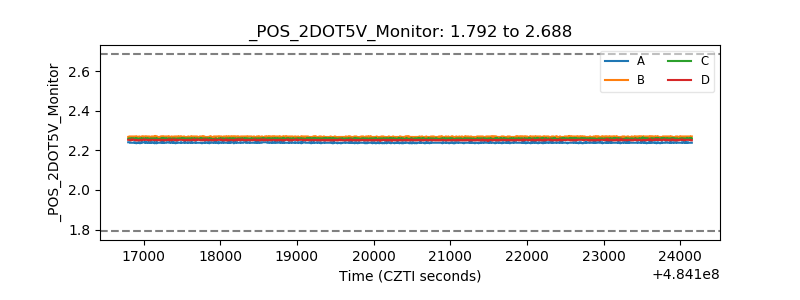 |
| +5 Volts monitor | 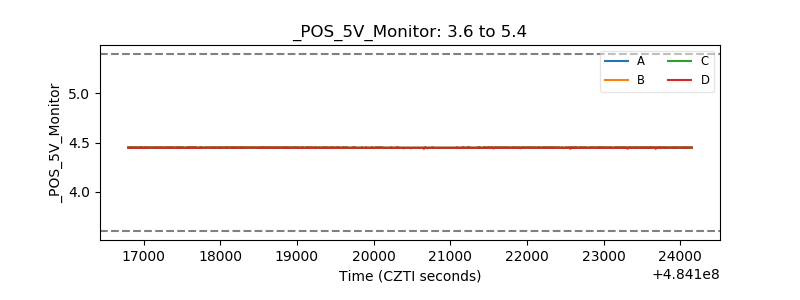 |
| _ROLL_ROT | 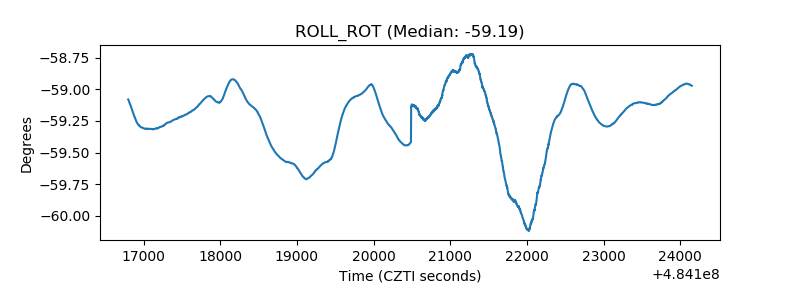 |
| _Roll_DEC | 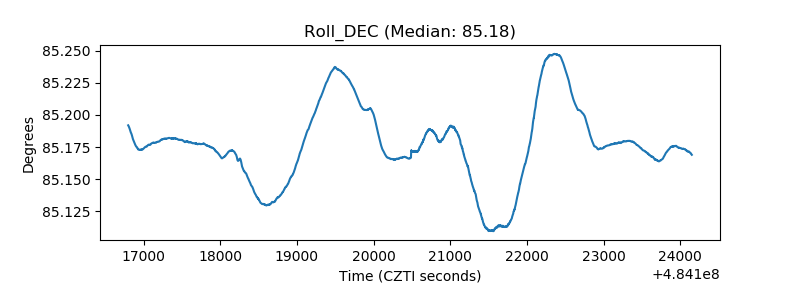 |
| _Roll_RA | 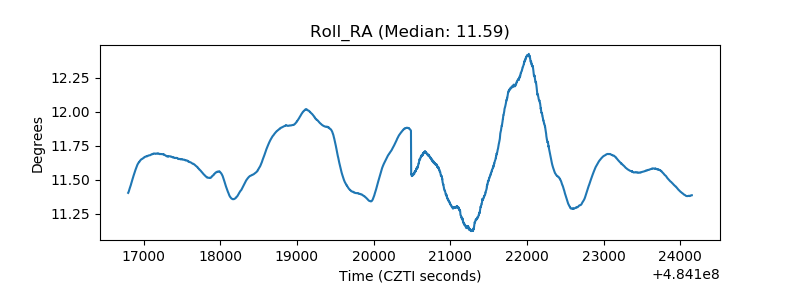 |
| Veto Counter | 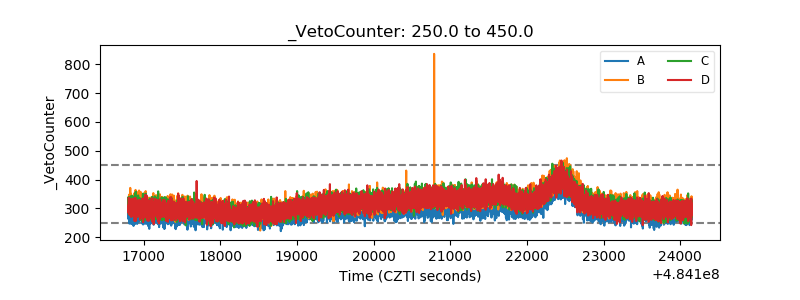 |