| Param | Original file | Final file |
|---|---|---|
| Filename | modeM0/AS1C09_011T05_9000006466_51936cztM0_level2.fits | modeM0/AS1C09_011T05_9000006466_51936cztM0_level2_quad_clean.evt |
| Size (bytes) | 1,063,696,320 | 85,397,760 |
| Size | 1014.4 MB | 81.4 MB |
| Events in quadrant A | 7,693,084 | 619,733 |
| Events in quadrant B | 7,760,992 | 611,611 |
| Events in quadrant C | 11,897,156 | 426,991 |
| Events in quadrant D | 11,443,534 | 403,528 |
| Mode SS | |||
|---|---|---|---|
| Quadrant | BADHDUFLAG | Total packets | Discarded packets |
| A | 0 | 150 | 0 |
| B | 0 | 150 | 0 |
| C | 0 | 150 | 0 |
| D | 0 | 150 | 0 |
| Mode M0 | |||
|---|---|---|---|
| Quadrant | BADHDUFLAG | Total packets | Discarded packets |
| A | 0 | 28136 | 0 |
| B | 0 | 28328 | 7 |
| C | 0 | 40519 | 0 |
| D | 0 | 39068 | 0 |
| Quadrant | Total seconds | Saturated seconds | Saturation percentage |
|---|---|---|---|
| A | 7517 | 923 | 12.278835% |
| B | 7516 | 1498 | 19.930814% |
| C | 7516 | 3092 | 41.138904% |
| D | 7516 | 2932 | 39.010112% |
Noise dominated data is calculated using 1-second bins in cleaned event files. If a bin has >2000 counts, and if more than 50% of those come from <1% of pixels, then it is considered to be noise-dominated and hence unusable.
| Quadrant | # 1 sec bins | Bins with >0 counts | Bins with >2000 counts | High rate bins dominated by noise | Noise dominated (total time) | Noise dominated (detector-on time) | Marked lightcurve |
|---|---|---|---|---|---|---|---|
| A | 7516 | 7516 | 822 | 822 | 10.94% | 10.94% | 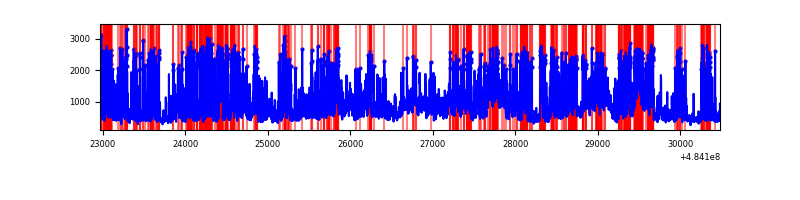 |
| B | 7515 | 7515 | 1252 | 1252 | 16.66% | 16.66% |  |
| C | 7516 | 7516 | 2916 | 2916 | 38.80% | 38.80% | 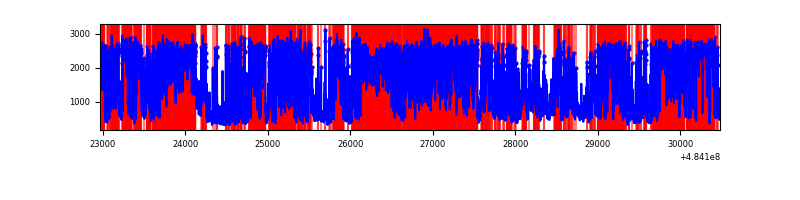 |
| D | 7515 | 7515 | 2885 | 2885 | 38.39% | 38.39% | 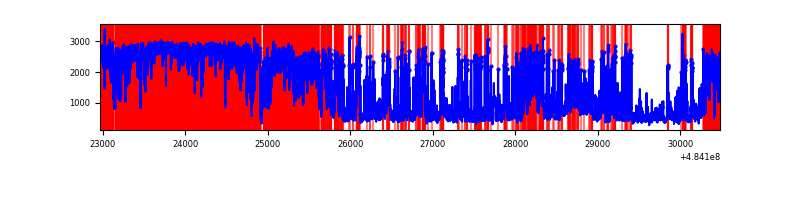 |
Top three noisy pixels from each quadrant. If the there are fewer than three noisy pixels in the level2.evt file, extra rows are filled as -1
| Pixel properties | Quadrant properties | ||||||
|---|---|---|---|---|---|---|---|
| Quadrant | DetID | PixID | Counts | Sigma | Mean | Median | Sigma |
| A | 4 | 159 | 1777714 | 9752.62 | 727 | 710 | 182.2 |
| A | 12 | 3 | 1108568 | 6080.19 | 727 | 710 | 182.2 |
| A | 7 | 64 | 659684 | 3616.61 | 727 | 710 | 182.2 |
| B | 12 | 32 | 3345717 | 22820.69 | 685 | 662 | 146.6 |
| B | 4 | 81 | 482466 | 3286.97 | 685 | 662 | 146.6 |
| B | 4 | 206 | 437717 | 2981.68 | 685 | 662 | 146.6 |
| C | 15 | 224 | 5183655 | 30756.99 | 600 | 594 | 168.5 |
| C | 15 | 230 | 976986 | 5794.04 | 600 | 594 | 168.5 |
| C | 12 | 249 | 917848 | 5443.11 | 600 | 594 | 168.5 |
| D | 0 | 33 | 3178266 | 18840.05 | 588 | 561 | 168.7 |
| D | 2 | 172 | 1128894 | 6689.69 | 588 | 561 | 168.7 |
| D | 6 | 42 | 1083522 | 6420.68 | 588 | 561 | 168.7 |
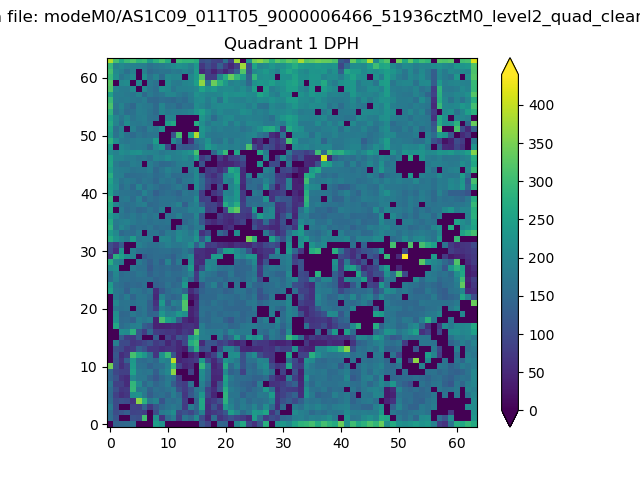
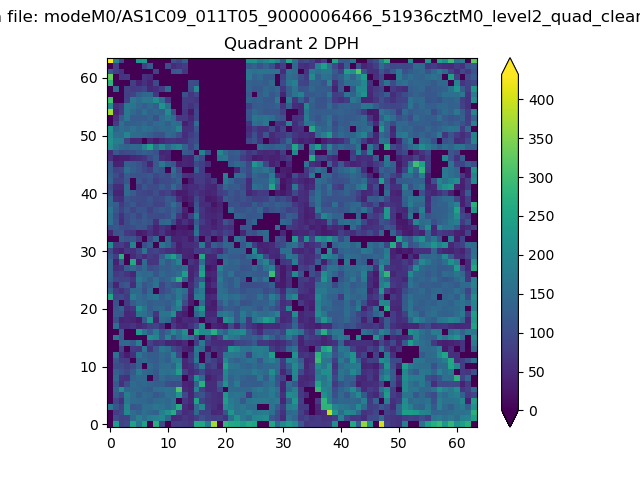
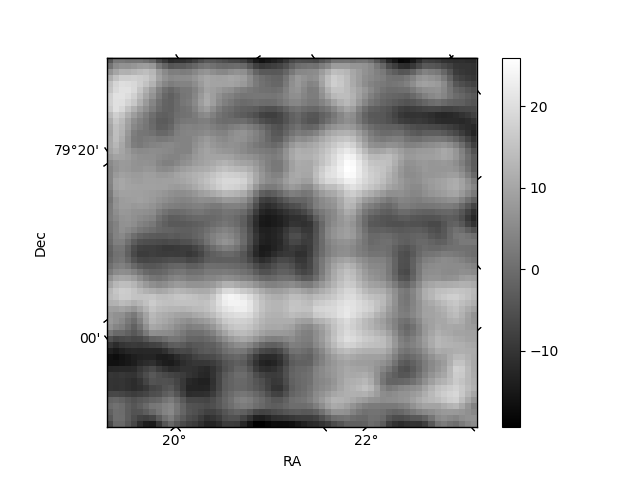
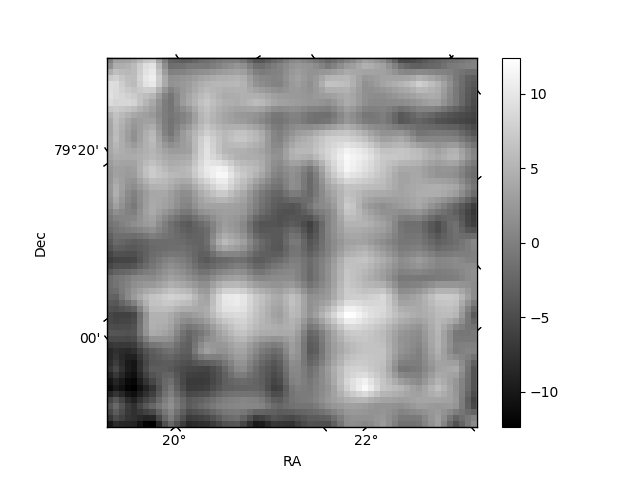
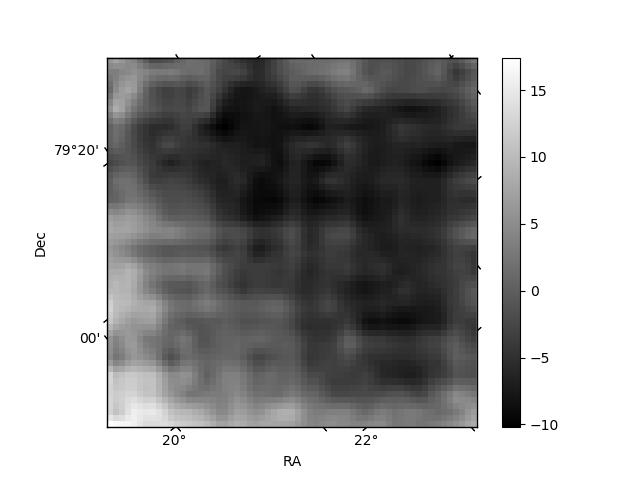
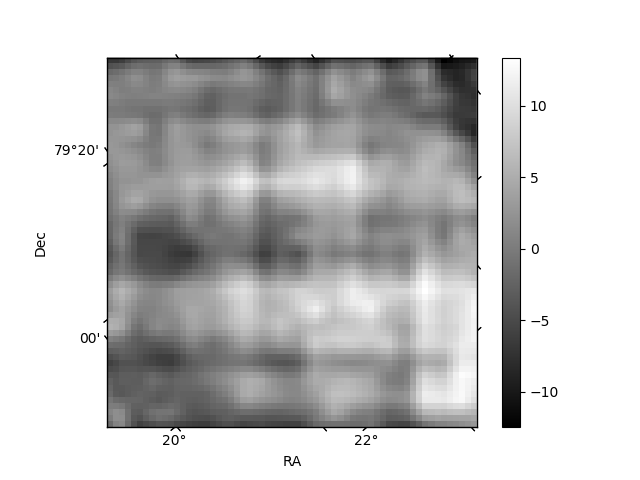
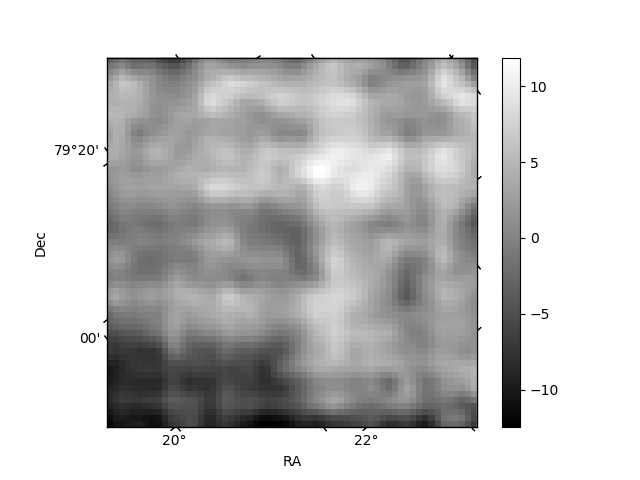
Histogram calculated using DETX and DETY for each event in the final _common_clean file
| Quadrant A | 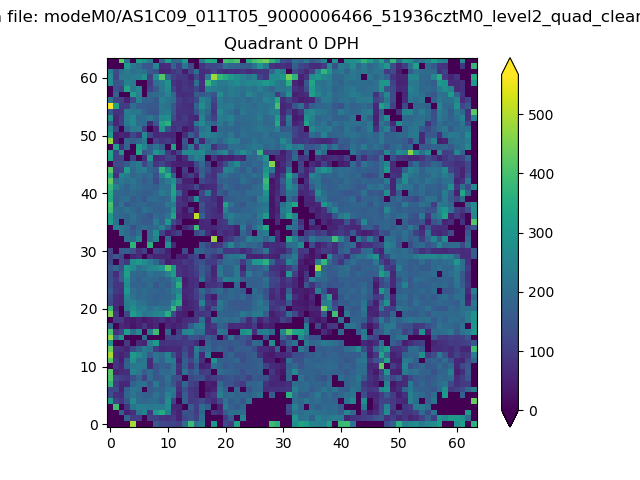 |
 |
Quadrant B |
|---|---|---|---|
| Quadrant D | 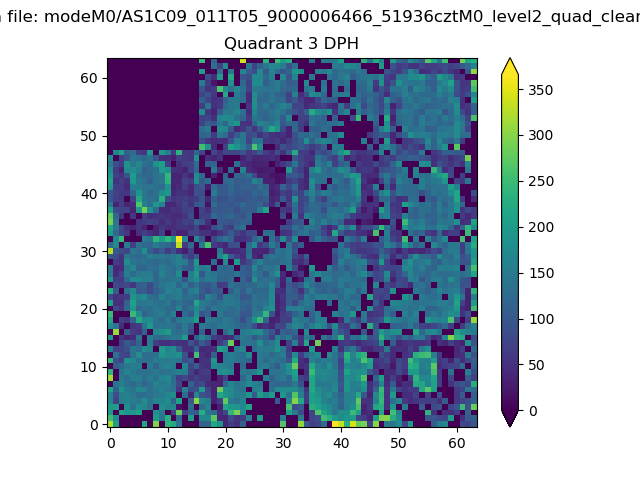 |
 |
Quadrant C |
| Plot type | Count rate plots | Images |
|---|---|---|
| Comparison with Poisson distribution Blue bars denote a histogram of data divided into 1 sec bins. Red curve is a Poisson curve with rate = median count rate of data. |
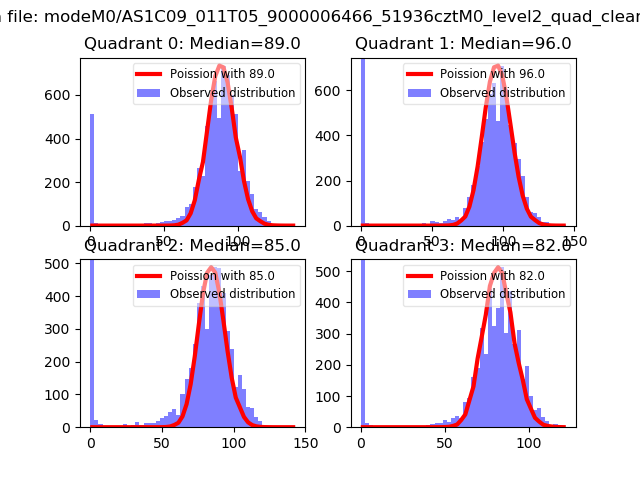 |
 |
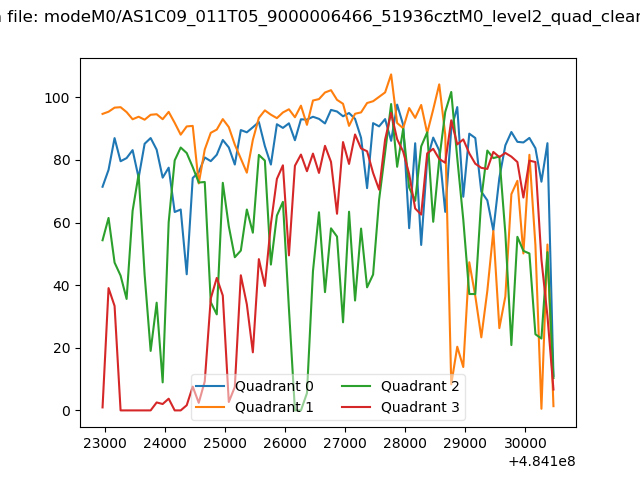
| Quadrant-wise count rates Data is divided into 100 sec bins |
 |
|
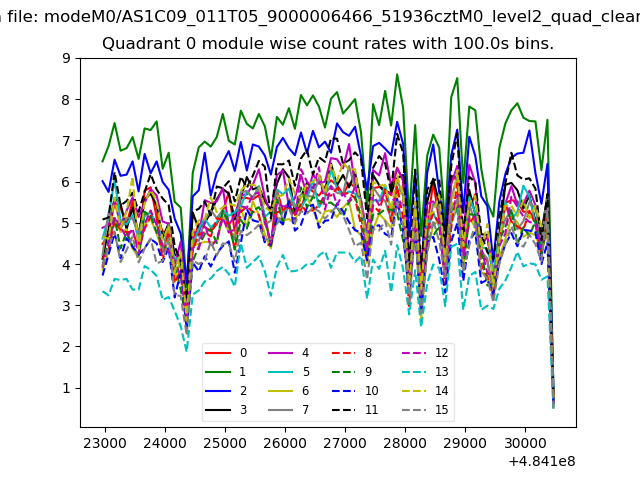
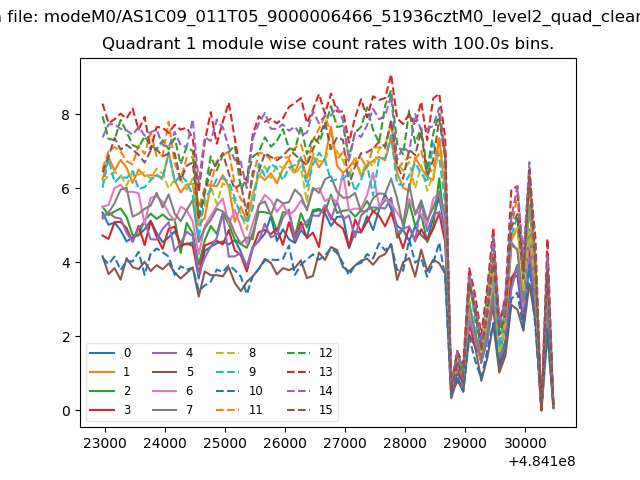
| Module-wise count rates for Quadrant A Data is divided into 100 sec bins |
 |
 |
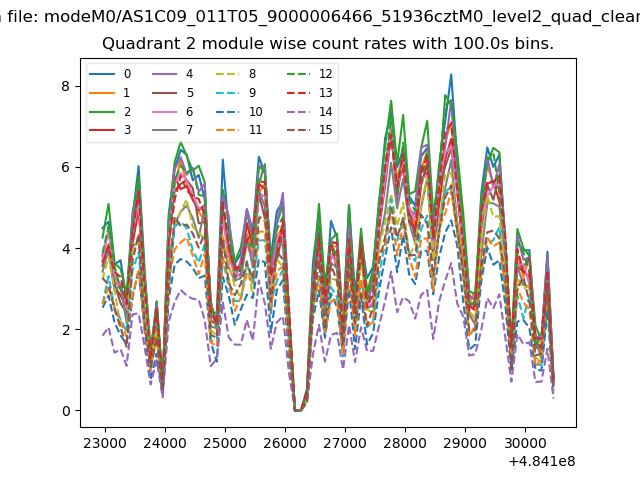
| Module-wise count rates for Quadrant B Data is divided into 100 sec bins |
 |
 |
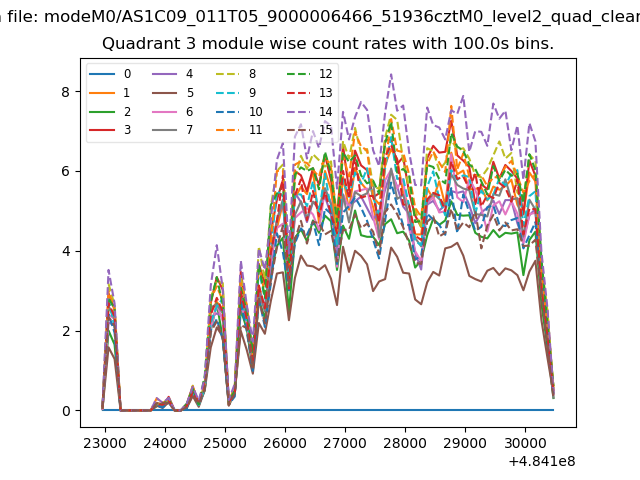
| Module-wise count rates for Quadrant C Data is divided into 100 sec bins |
 |
 |
| Module-wise count rates for Quadrant D Data is divided into 100 sec bins |
 |
 |
| Parameter | Plot |
|---|---|
| CZT HV Monitor |  |
| D_VDD | 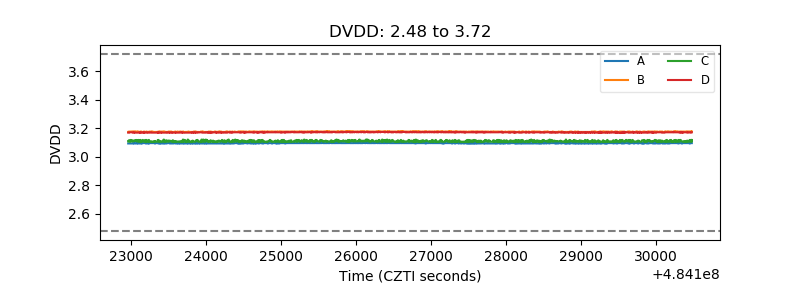 |
| Temperature 1 | 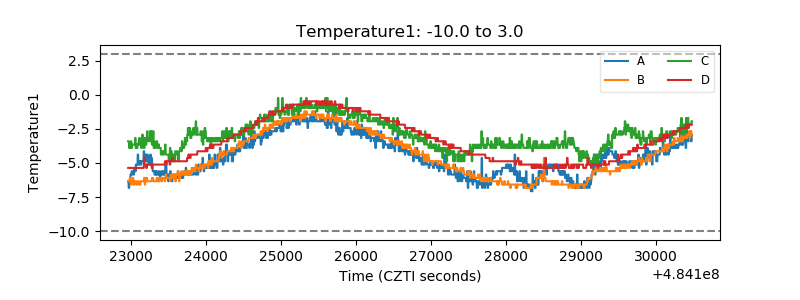 |
| Veto HV Monitor | 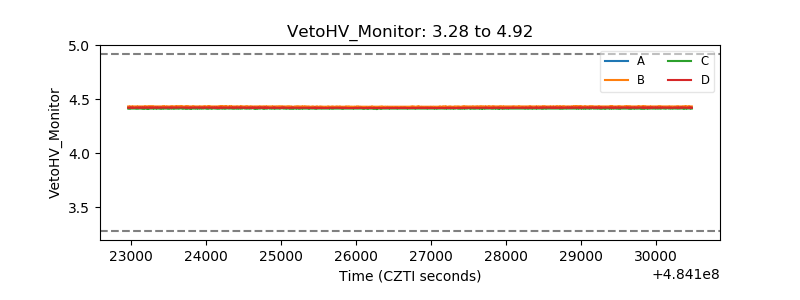 |
| Veto LLD | 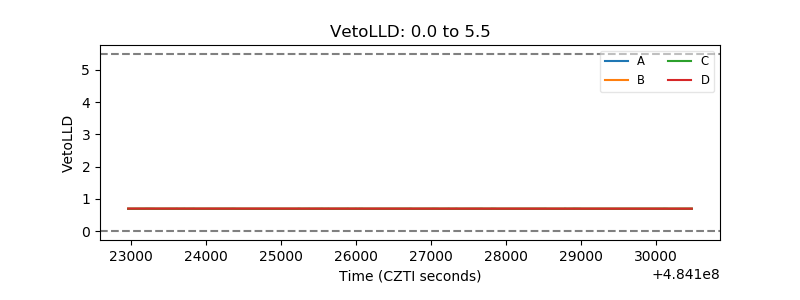 |
| Alpha Counter | 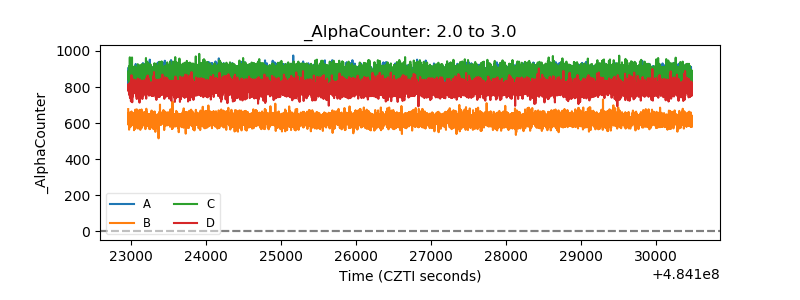 |
| _CPM_Rate | 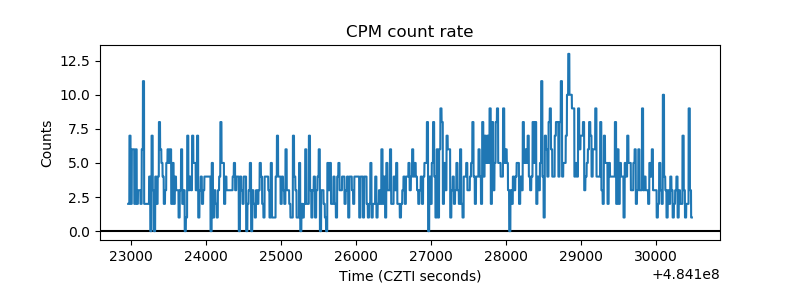 |
| CZT Counter | 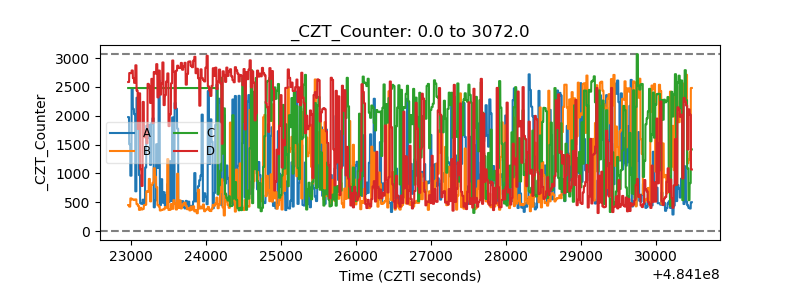 |
| +2.5 Volts monitor | 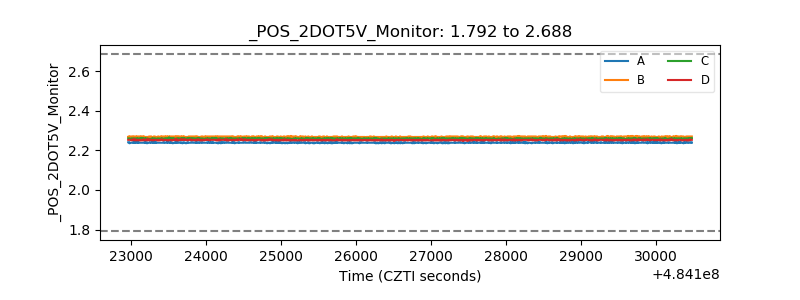 |
| +5 Volts monitor |  |
| _ROLL_ROT | 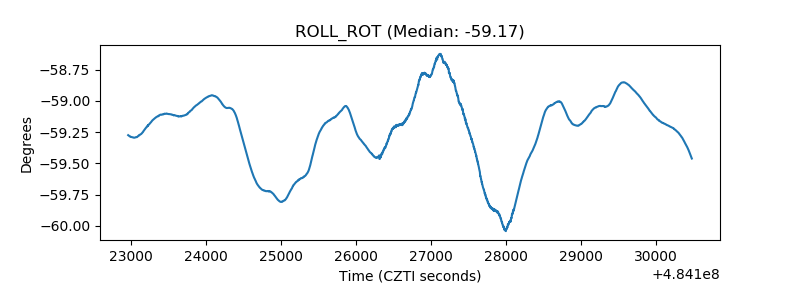 |
| _Roll_DEC | 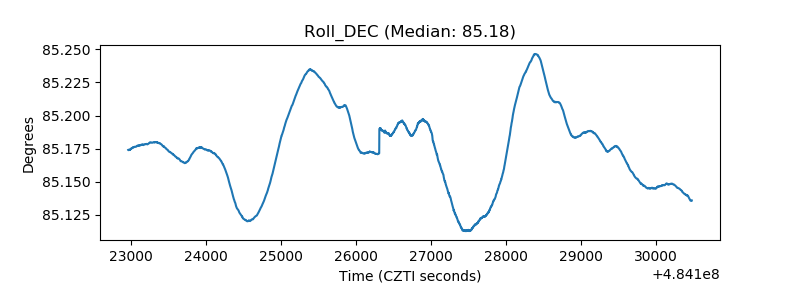 |
| _Roll_RA | 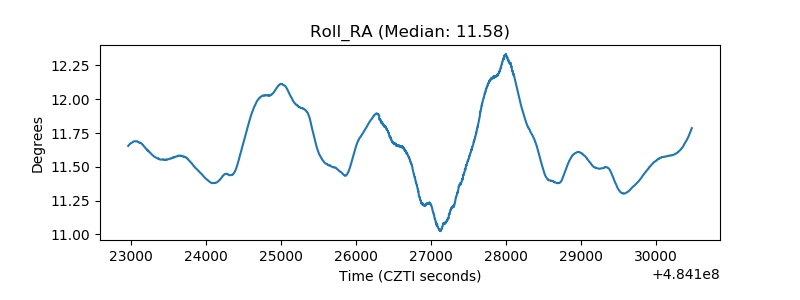 |
| Veto Counter | 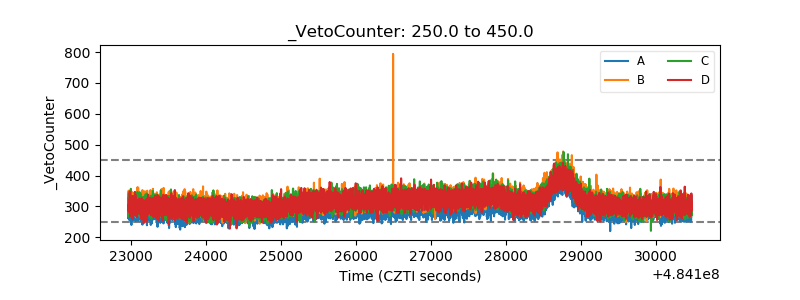 |