| Param | Original file | Final file |
|---|---|---|
| Filename | modeM0/AS1C09_011T06_9000006468cztM0_level2.fits | modeM0/AS1C09_011T06_9000006468cztM0_level2_quad_clean.evt |
| Size (bytes) | 3,735,915,840 | 2,104,467,840 |
| Size | 3.5 GB | 2.0 GB |
| Events in quadrant A | 22,376,536 | 8,173,272 |
| Events in quadrant B | 20,223,516 | 8,622,994 |
| Events in quadrant C | 20,610,842 | 6,700,422 |
| Events in quadrant D | 14,189,184 | 4,736,499 |
| Mode M0 | |||
|---|---|---|---|
| Quadrant | BADHDUFLAG | Total packets | Discarded packets |
| A | 0 | 1801636 | 0 |
| B | 0 | 1915305 | 0 |
| C | 0 | 2228304 | 0 |
| D | 0 | 3088775 | 0 |
| Mode M9 | |||
|---|---|---|---|
| Quadrant | BADHDUFLAG | Total packets | Discarded packets |
| A | 0 | 596 | 0 |
| B | 0 | 596 | 0 |
| C | 0 | 596 | 0 |
| D | 0 | 596 | 0 |
| Mode SS | |||
|---|---|---|---|
| Quadrant | BADHDUFLAG | Total packets | Discarded packets |
| A | 0 | 10514 | 0 |
| B | 0 | 10512 | 0 |
| C | 0 | 10512 | 0 |
| D | 0 | 10514 | 0 |
| Quadrant | Total seconds | Saturated seconds | Saturation percentage |
|---|---|---|---|
| A | 517906 | 75447 | 14.567701% |
| B | 517787 | 108877 | 21.027372% |
| C | 517850 | 133319 | 25.744714% |
| D | 517775 | 253682 | 48.994641% |
Noise dominated data is calculated using 1-second bins in cleaned event files. If a bin has >2000 counts, and if more than 50% of those come from <1% of pixels, then it is considered to be noise-dominated and hence unusable.
| Quadrant | # 1 sec bins | Bins with >0 counts | Bins with >2000 counts | High rate bins dominated by noise | Noise dominated (total time) | Noise dominated (detector-on time) | Marked lightcurve |
|---|---|---|---|---|---|---|---|
| A | 772141 | 515447 | 0 | 0 | 0.00% | 0.00% | 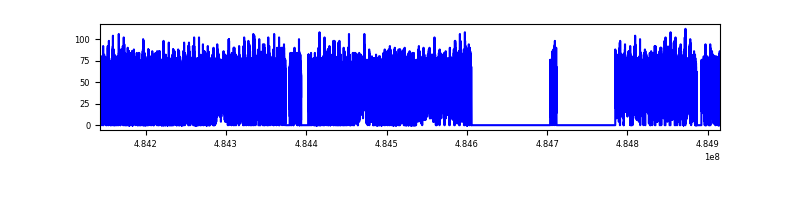 |
| B | 772141 | 502904 | 0 | 0 | 0.00% | 0.00% | 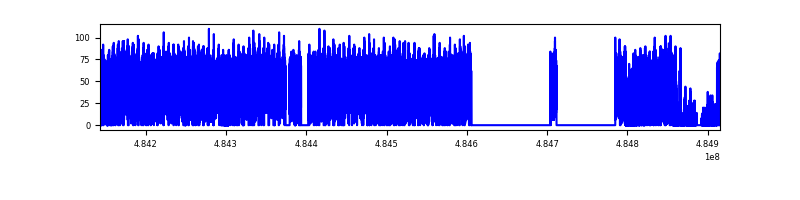 |
| C | 772139 | 512881 | 0 | 0 | 0.00% | 0.00% | 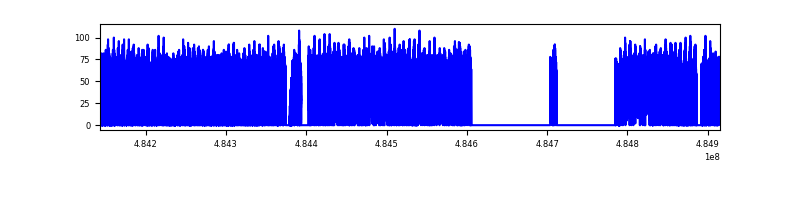 |
| D | 772140 | 491499 | 0 | 0 | 0.00% | 0.00% | 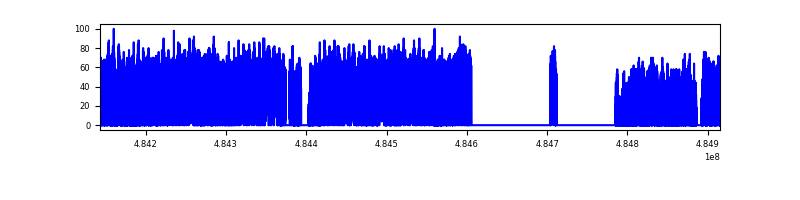 |
Top three noisy pixels from each quadrant. If the there are fewer than three noisy pixels in the level2.evt file, extra rows are filled as -1
| Pixel properties | Quadrant properties | ||||||
|---|---|---|---|---|---|---|---|
| Quadrant | DetID | PixID | Counts | Sigma | Mean | Median | Sigma |
| A | 14 | 188 | 25098 | 10.27 | 5960 | 5566 | 1902.5 |
| A | 9 | 255 | 23939 | 9.66 | 5960 | 5566 | 1902.5 |
| A | 14 | 204 | 20591 | 7.9 | 5960 | 5566 | 1902.5 |
| B | 2 | 9 | 23791 | 14.93 | 5404 | 5136 | 1249.1 |
| B | 2 | 8 | 21577 | 13.16 | 5404 | 5136 | 1249.1 |
| B | 9 | 173 | 16784 | 9.32 | 5404 | 5136 | 1249.1 |
| C | 2 | 31 | 17097 | 6.38 | 5586 | 5115 | 1878.2 |
| C | 7 | 221 | 16385 | 6.0 | 5586 | 5115 | 1878.2 |
| C | 3 | 202 | 16187 | 5.89 | 5586 | 5115 | 1878.2 |
| D | 6 | 218 | 18994 | 11.13 | 4095 | 3628 | 1380.9 |
| D | 3 | 30 | 14167 | 7.63 | 4095 | 3628 | 1380.9 |
| D | 15 | 11 | 14065 | 7.56 | 4095 | 3628 | 1380.9 |
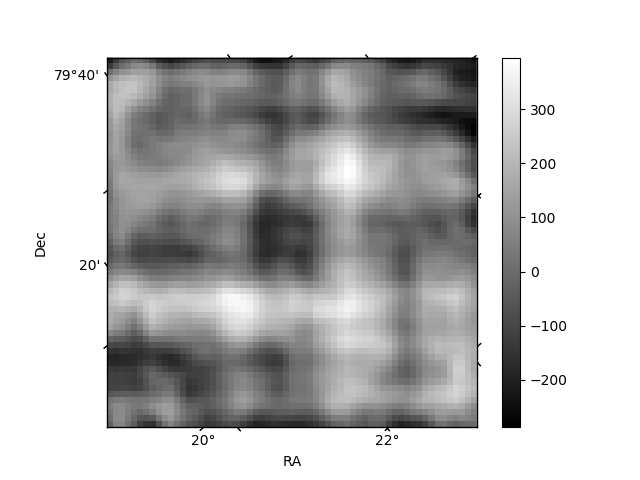
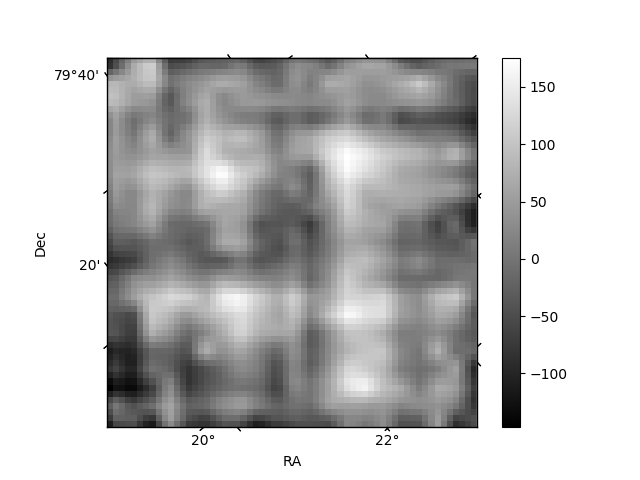
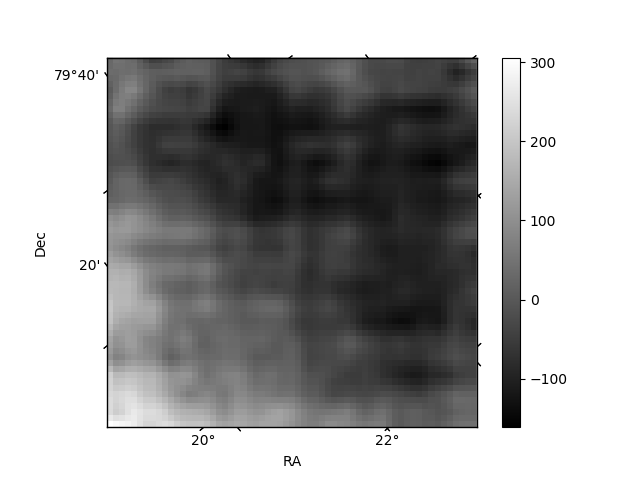
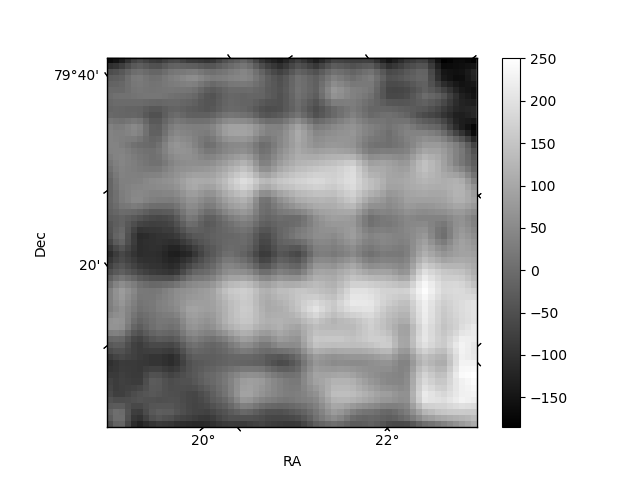
Histogram calculated using DETX and DETY for each event in the final _common_clean file
| Quadrant A | 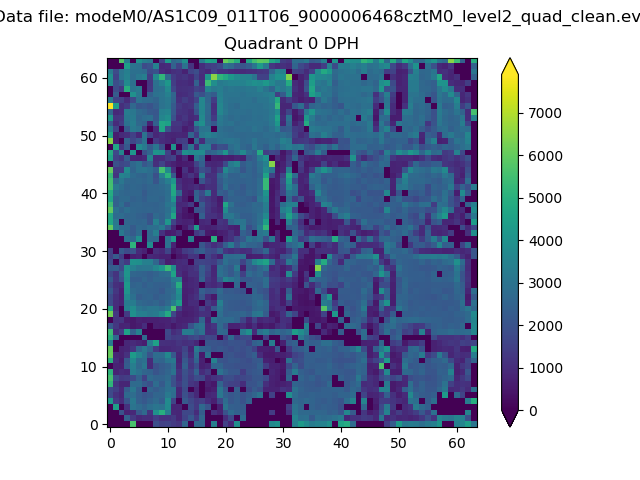 |
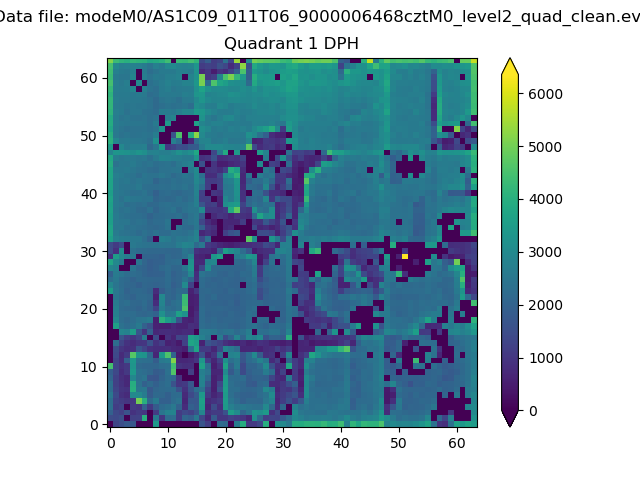 |
Quadrant B |
|---|---|---|---|
| Quadrant D | 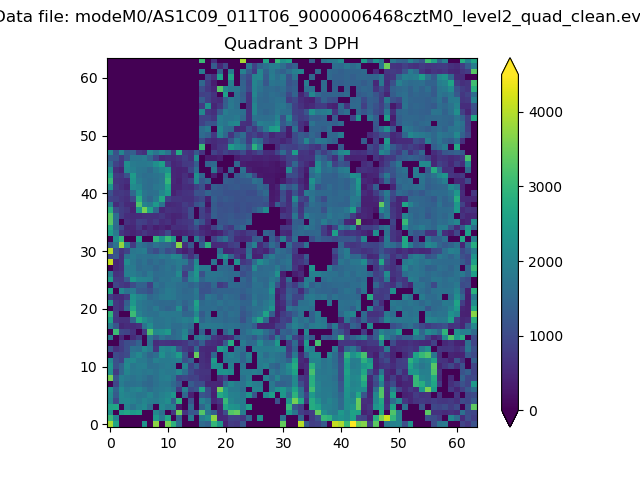 |
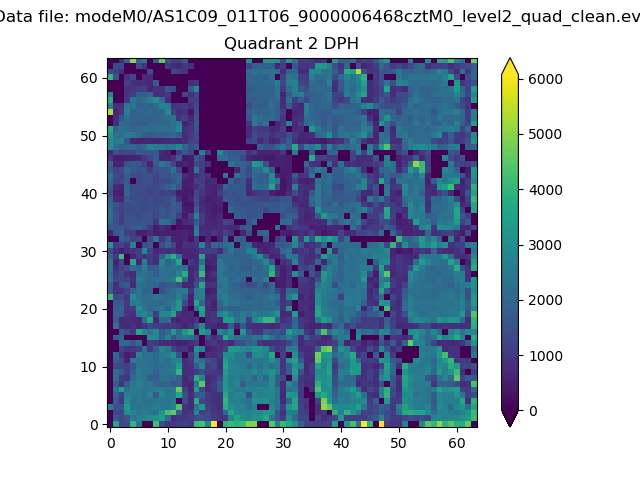 |
Quadrant C |
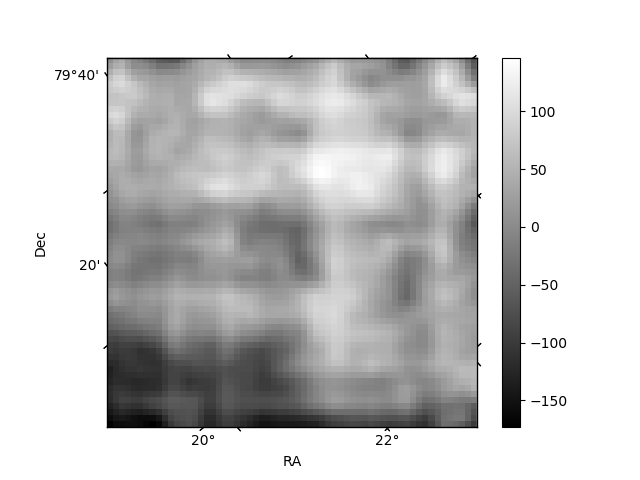
| Plot type | Count rate plots | Images |
|---|---|---|
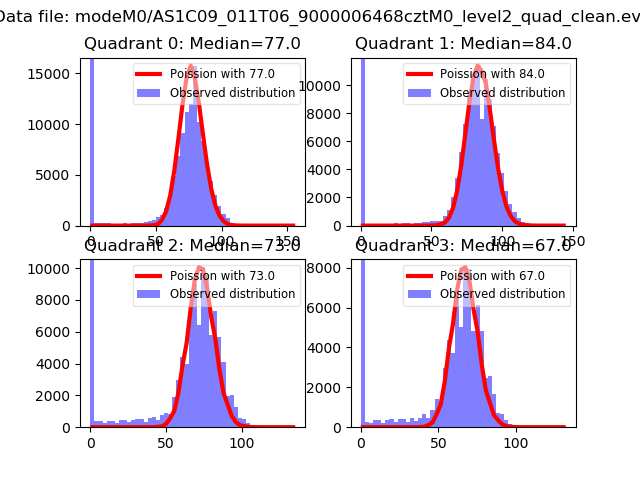
| Comparison with Poisson distribution Blue bars denote a histogram of data divided into 1 sec bins. Red curve is a Poisson curve with rate = median count rate of data. |
 |
 |
| Quadrant-wise count rates Data is divided into 100 sec bins |
 |
|
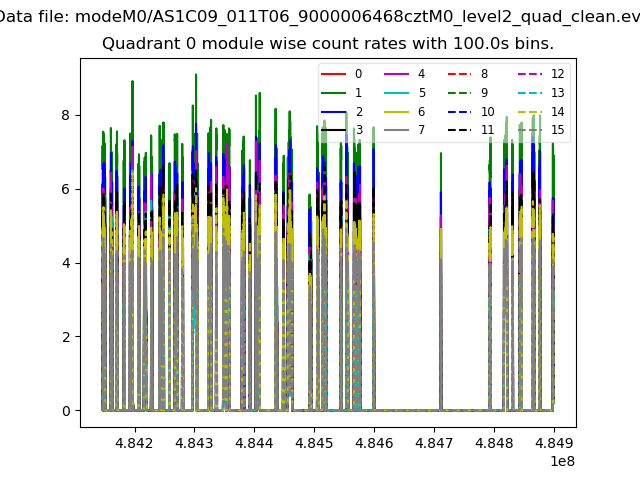
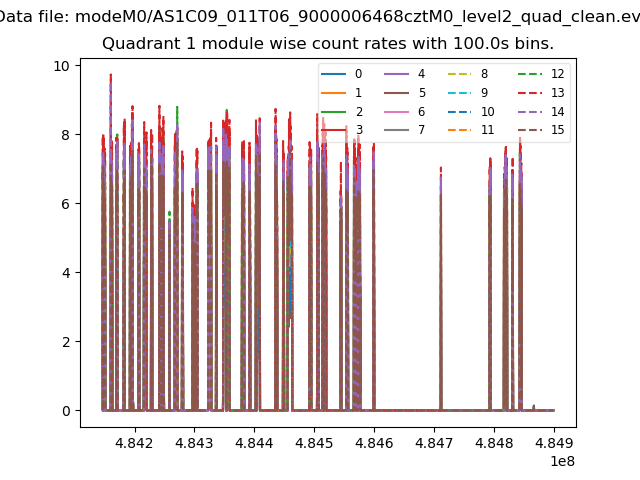
| Module-wise count rates for Quadrant A Data is divided into 100 sec bins |
 |
 |
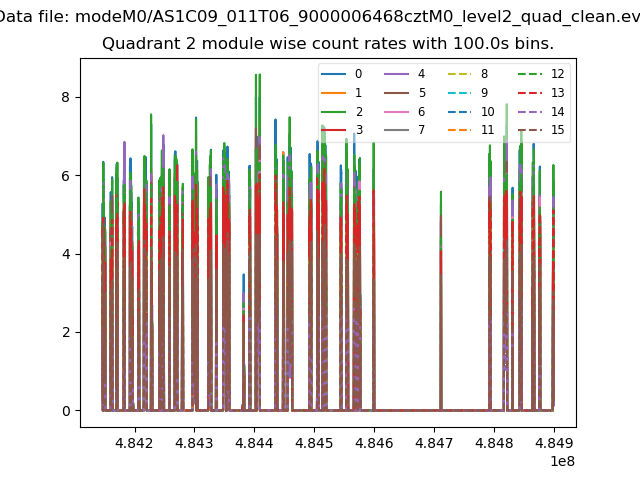
| Module-wise count rates for Quadrant B Data is divided into 100 sec bins |
 |
 |
| Module-wise count rates for Quadrant C Data is divided into 100 sec bins |
 |
 |
| Module-wise count rates for Quadrant D Data is divided into 100 sec bins |
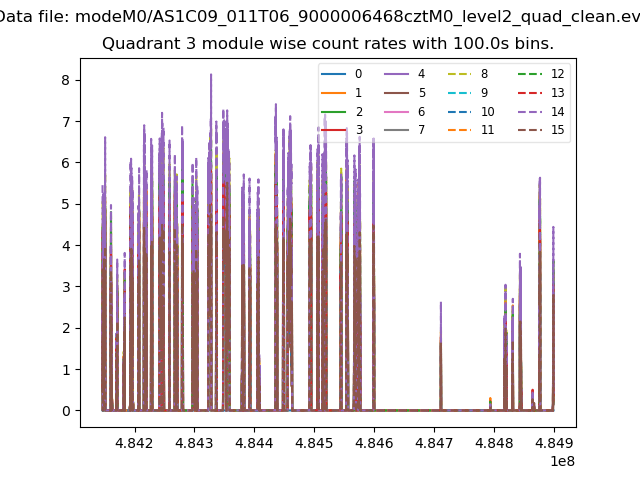 |
 |
| Parameter | Plot |
|---|---|
| CZT HV Monitor | 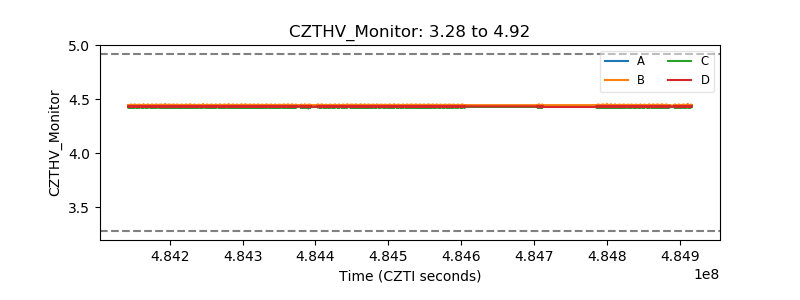 |
| D_VDD | 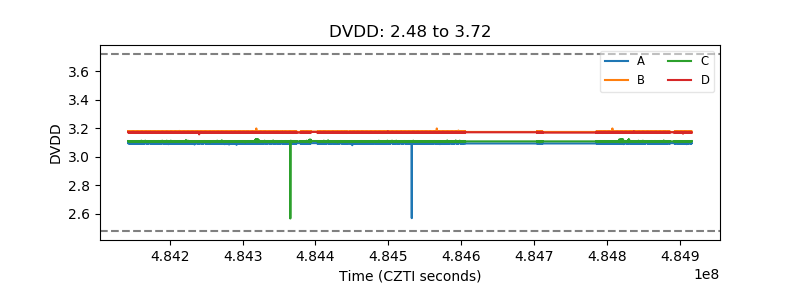 |
| Temperature 1 | 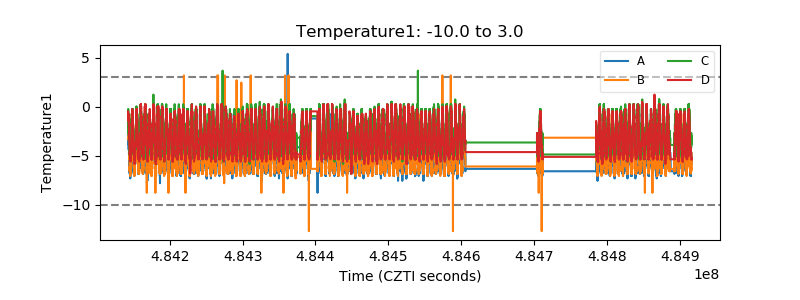 |
| Veto HV Monitor | 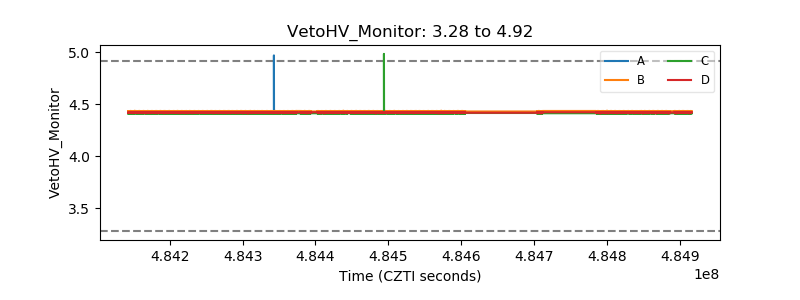 |
| Veto LLD | 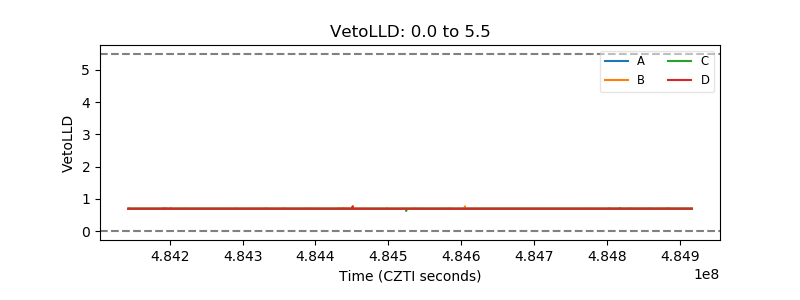 |
| Alpha Counter |  |
| _CPM_Rate |  |
| CZT Counter | 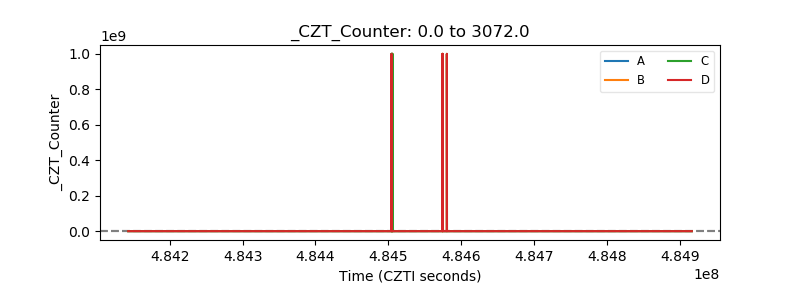 |
| +2.5 Volts monitor |  |
| +5 Volts monitor | 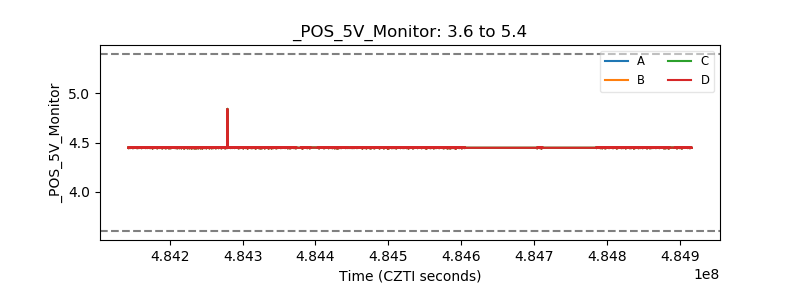 |
| _ROLL_ROT | 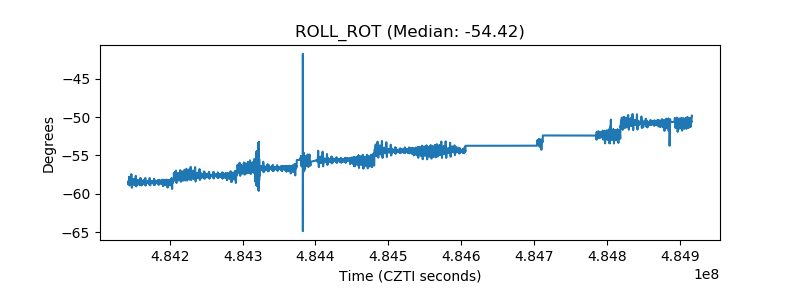 |
| _Roll_DEC | 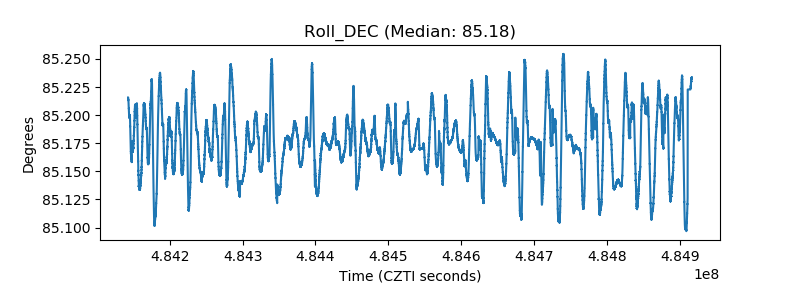 |
| _Roll_RA | 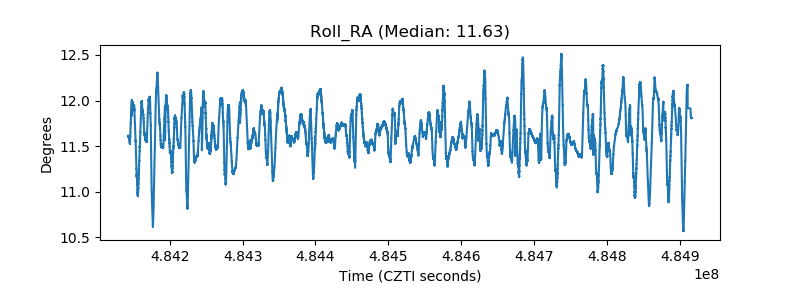 |
| Veto Counter | 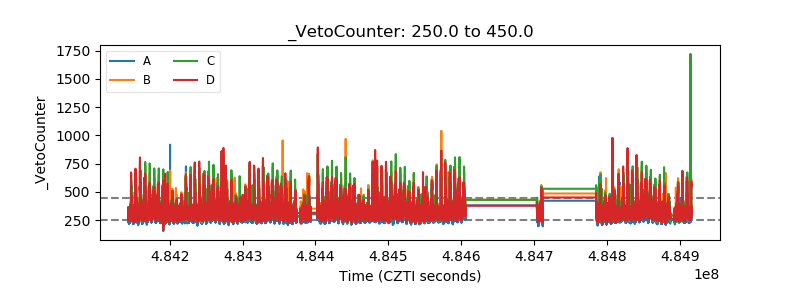 |