| Param | Original file | Final file |
|---|---|---|
| Filename | modeM0/AS1C09_011T06_9000006468_51940cztM0_level2.fits | modeM0/AS1C09_011T06_9000006468_51940cztM0_level2_quad_clean.evt |
| Size (bytes) | 1,540,932,480 | 123,189,120 |
| Size | 1.4 GB | 117.5 MB |
| Events in quadrant A | 8,961,514 | 951,833 |
| Events in quadrant B | 12,145,982 | 869,310 |
| Events in quadrant C | 17,437,889 | 574,437 |
| Events in quadrant D | 17,653,940 | 577,506 |
| Mode M0 | |||
|---|---|---|---|
| Quadrant | BADHDUFLAG | Total packets | Discarded packets |
| A | 0 | 34065 | 2 |
| B | 0 | 43648 | 2 |
| C | 0 | 59397 | 4 |
| D | 0 | 59962 | 2 |
| Mode M9 | |||
|---|---|---|---|
| Quadrant | BADHDUFLAG | Total packets | Discarded packets |
| A | 0 | 14 | 0 |
| B | 0 | 14 | 0 |
| C | 0 | 14 | 0 |
| D | 0 | 14 | 0 |
| Mode SS | |||
|---|---|---|---|
| Quadrant | BADHDUFLAG | Total packets | Discarded packets |
| A | 0 | 222 | 0 |
| B | 0 | 222 | 0 |
| C | 0 | 222 | 0 |
| D | 0 | 222 | 0 |
| Quadrant | Total seconds | Saturated seconds | Saturation percentage |
|---|---|---|---|
| A | 10915 | 827 | 7.576729% |
| B | 10915 | 2527 | 23.151626% |
| C | 10914 | 5098 | 46.710647% |
| D | 10914 | 4482 | 41.066520% |
Noise dominated data is calculated using 1-second bins in cleaned event files. If a bin has >2000 counts, and if more than 50% of those come from <1% of pixels, then it is considered to be noise-dominated and hence unusable.
| Quadrant | # 1 sec bins | Bins with >0 counts | Bins with >2000 counts | High rate bins dominated by noise | Noise dominated (total time) | Noise dominated (detector-on time) | Marked lightcurve |
|---|---|---|---|---|---|---|---|
| A | 12335 | 10914 | 621 | 621 | 5.03% | 5.69% | 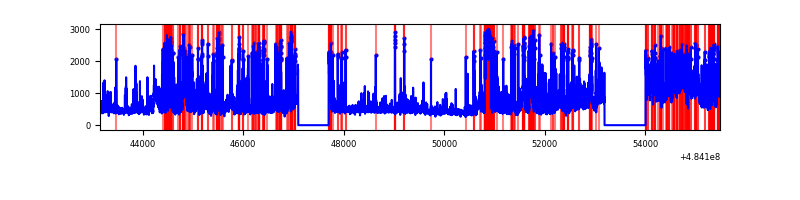 |
| B | 12335 | 10914 | 2031 | 2031 | 16.47% | 18.61% | 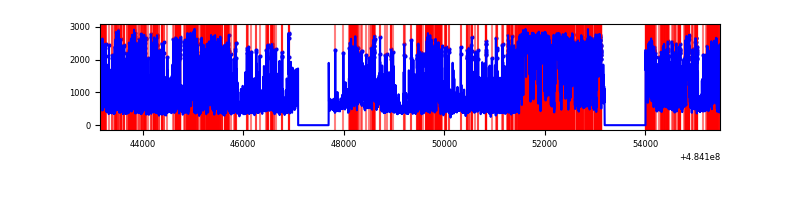 |
| C | 12334 | 10913 | 4397 | 4397 | 35.65% | 40.29% | 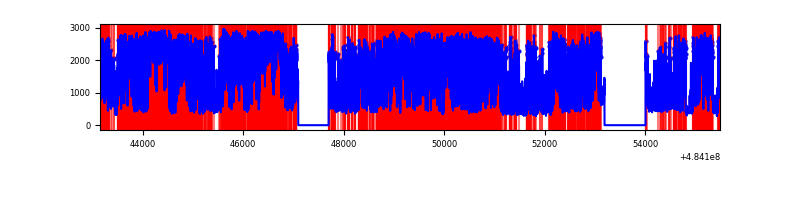 |
| D | 12334 | 10913 | 4569 | 4569 | 37.04% | 41.87% | 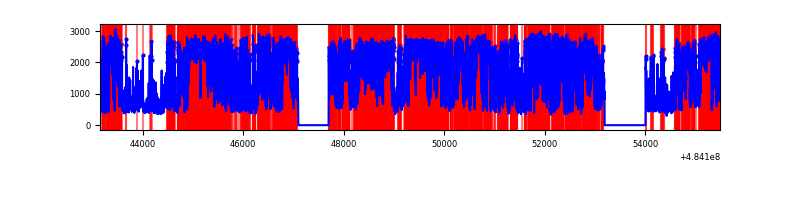 |
Top three noisy pixels from each quadrant. If the there are fewer than three noisy pixels in the level2.evt file, extra rows are filled as -1
| Pixel properties | Quadrant properties | ||||||
|---|---|---|---|---|---|---|---|
| Quadrant | DetID | PixID | Counts | Sigma | Mean | Median | Sigma |
| A | 7 | 64 | 1449435 | 5178.55 | 1113 | 1085 | 279.7 |
| A | 12 | 3 | 1300095 | 4644.59 | 1113 | 1085 | 279.7 |
| A | 15 | 239 | 369003 | 1315.49 | 1113 | 1085 | 279.7 |
| B | 12 | 32 | 6615799 | 30474.87 | 1019 | 985 | 217.1 |
| B | 10 | 254 | 216979 | 995.1 | 1019 | 985 | 217.1 |
| B | 4 | 206 | 171191 | 784.15 | 1019 | 985 | 217.1 |
| C | 15 | 224 | 9294714 | 39654.98 | 838 | 831 | 234.4 |
| C | 15 | 218 | 3033641 | 12940.34 | 838 | 831 | 234.4 |
| C | 15 | 209 | 882074 | 3760.07 | 838 | 831 | 234.4 |
| D | 12 | 17 | 8773137 | 32082.71 | 889 | 854 | 273.4 |
| D | 6 | 42 | 2639548 | 9650.45 | 889 | 854 | 273.4 |
| D | 2 | 172 | 1056057 | 3859.17 | 889 | 854 | 273.4 |
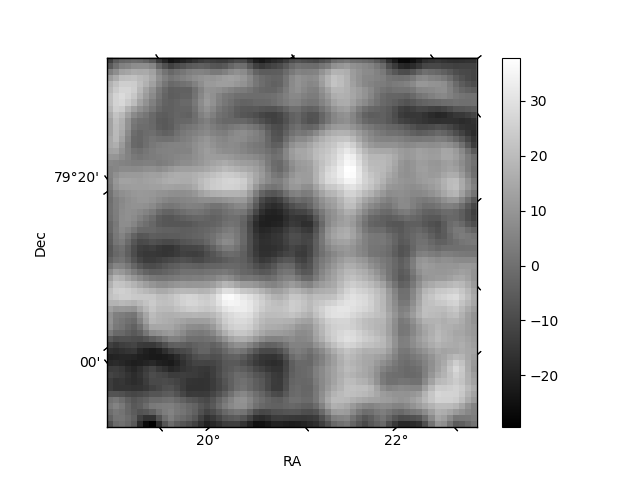
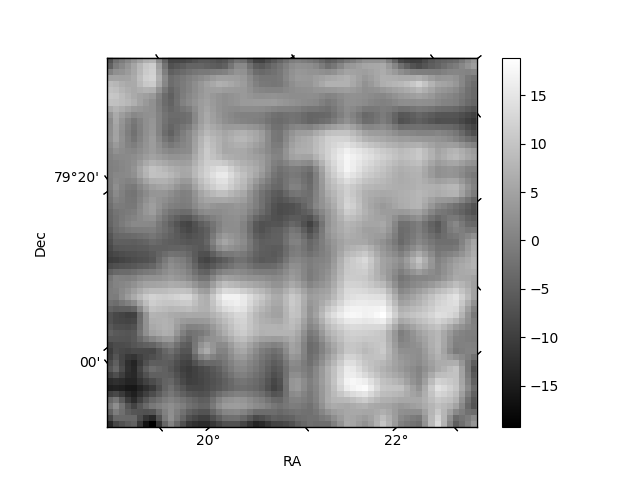
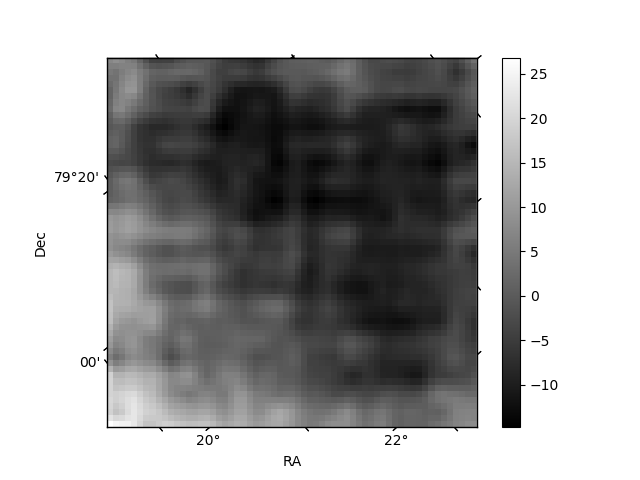
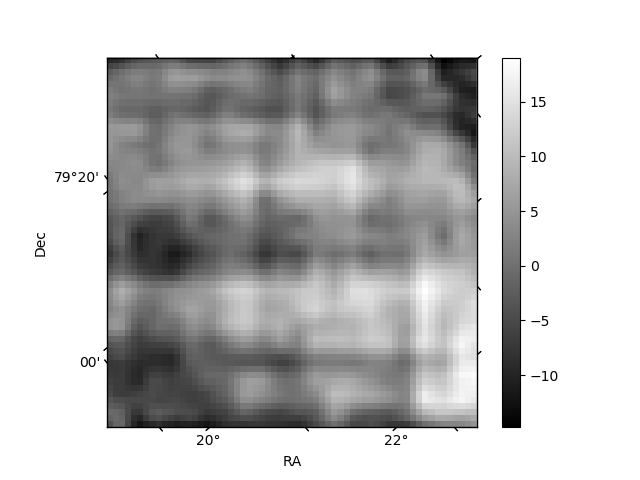
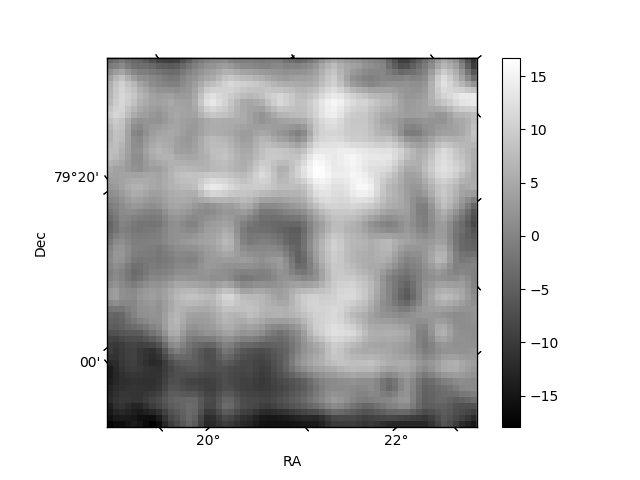
Histogram calculated using DETX and DETY for each event in the final _common_clean file
| Quadrant A | 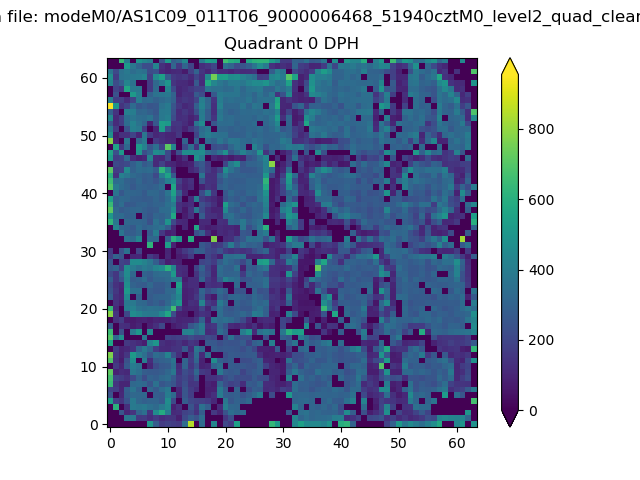 |
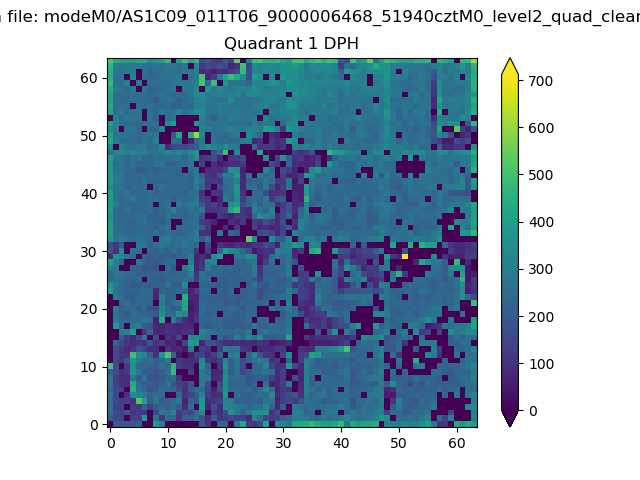 |
Quadrant B |
|---|---|---|---|
| Quadrant D | 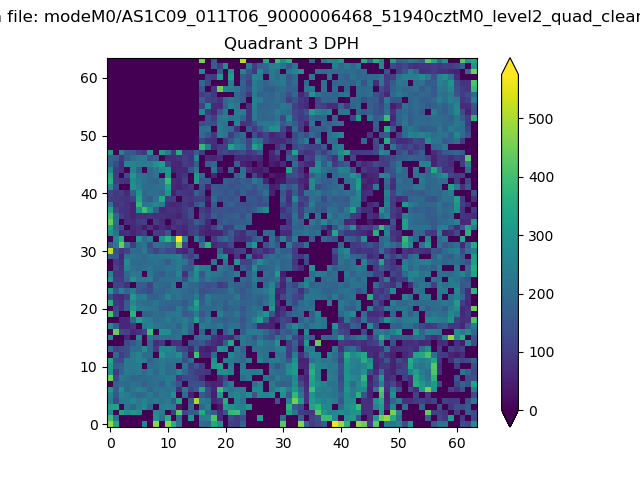 |
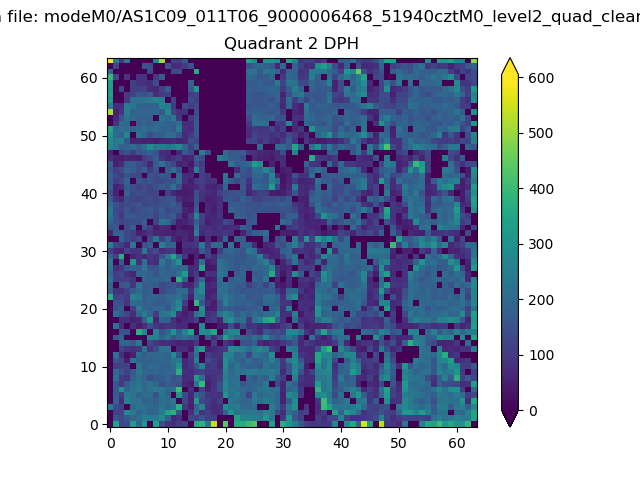 |
Quadrant C |
| Plot type | Count rate plots | Images |
|---|---|---|
| Comparison with Poisson distribution Blue bars denote a histogram of data divided into 1 sec bins. Red curve is a Poisson curve with rate = median count rate of data. |
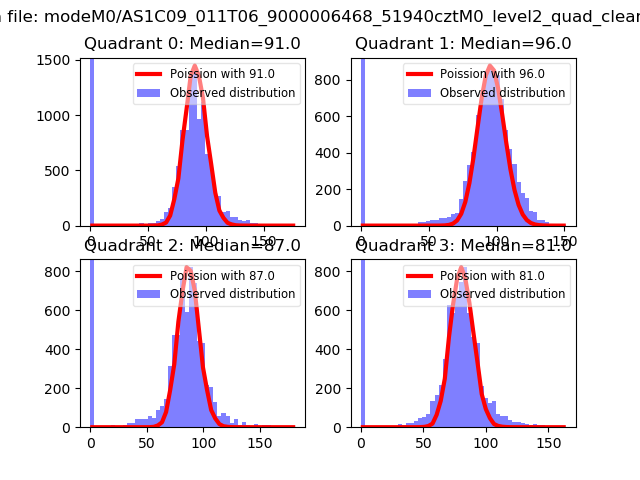 |
 |
| Quadrant-wise count rates Data is divided into 100 sec bins |
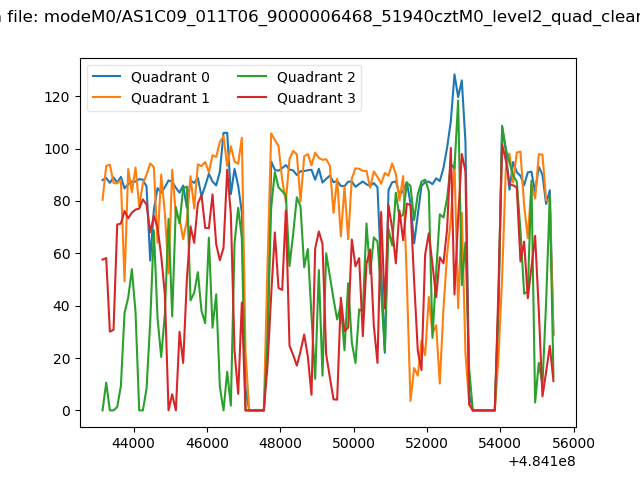 |
|
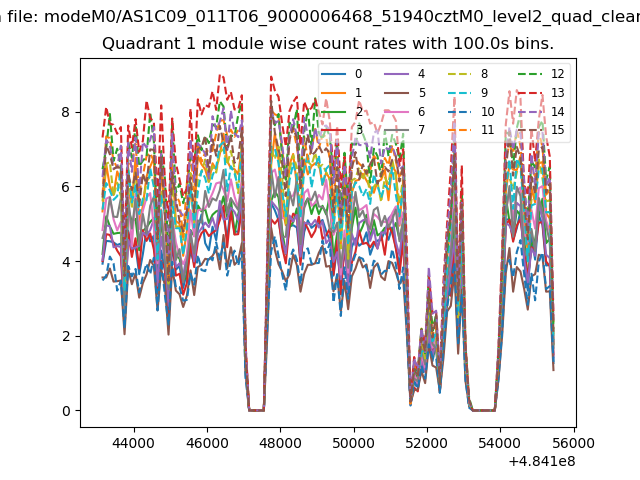
| Module-wise count rates for Quadrant A Data is divided into 100 sec bins |
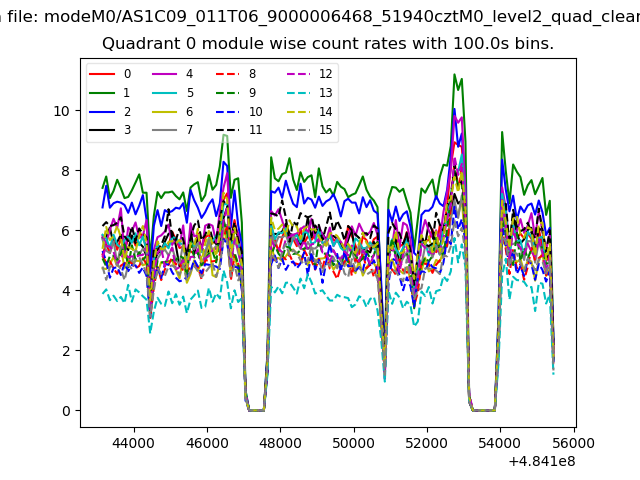 |
 |
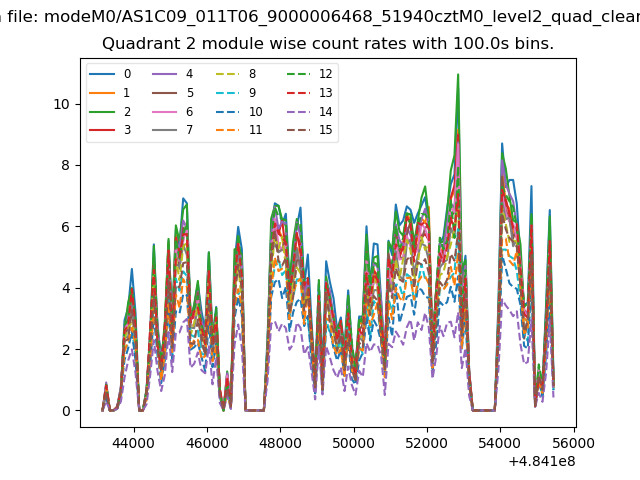
| Module-wise count rates for Quadrant B Data is divided into 100 sec bins |
 |
 |
| Module-wise count rates for Quadrant C Data is divided into 100 sec bins |
 |
 |
| Module-wise count rates for Quadrant D Data is divided into 100 sec bins |
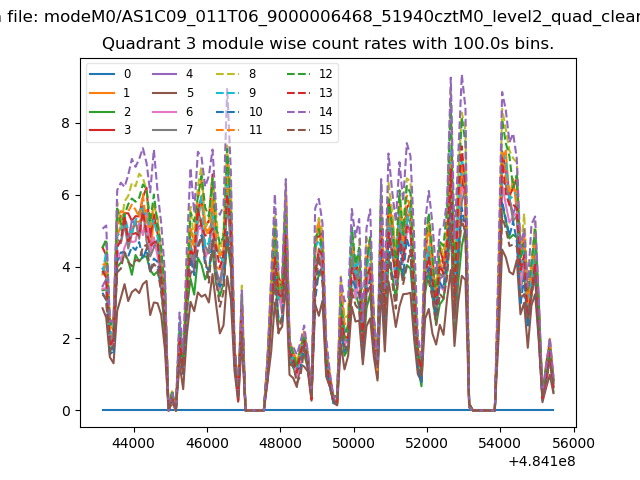 |
 |
| Parameter | Plot |
|---|---|
| CZT HV Monitor | 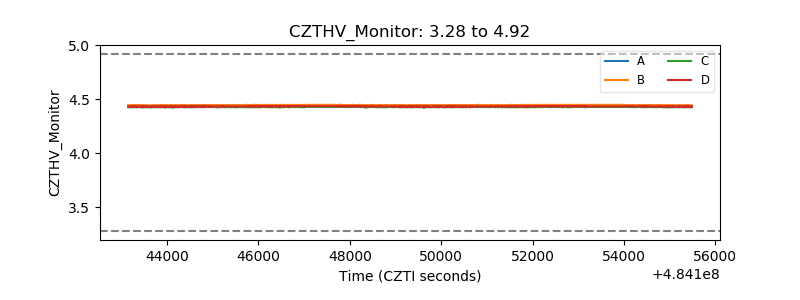 |
| D_VDD | 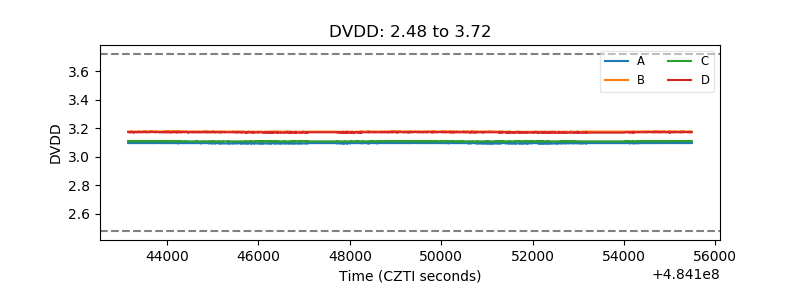 |
| Temperature 1 | 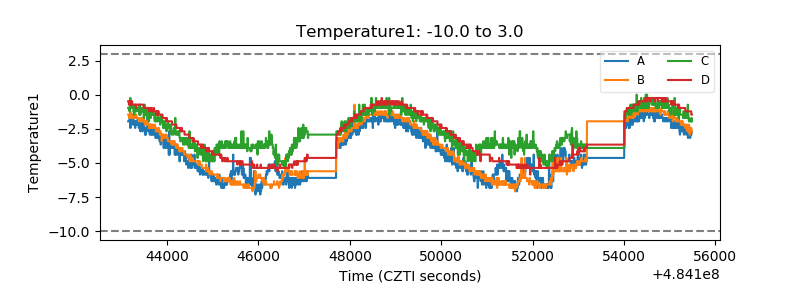 |
| Veto HV Monitor | 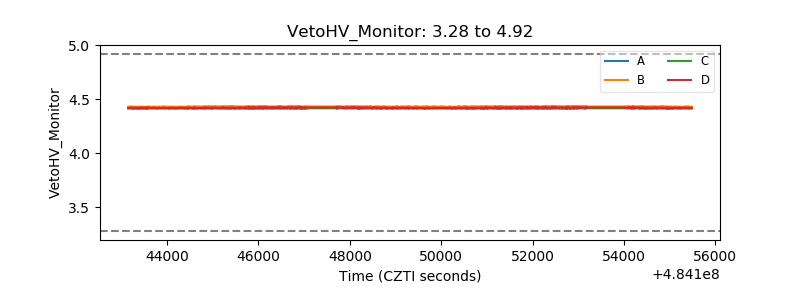 |
| Veto LLD | 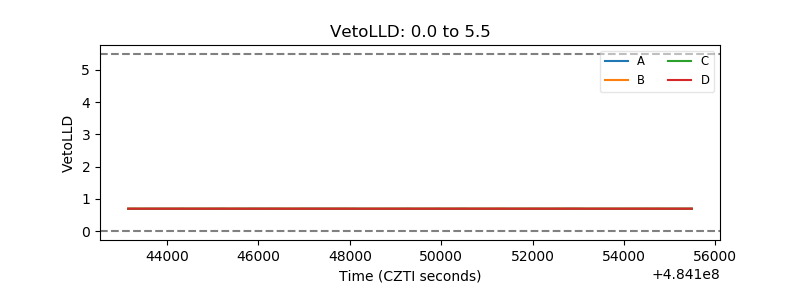 |
| Alpha Counter | 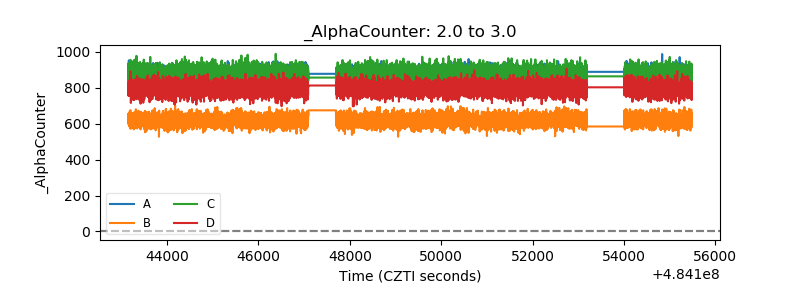 |
| _CPM_Rate | 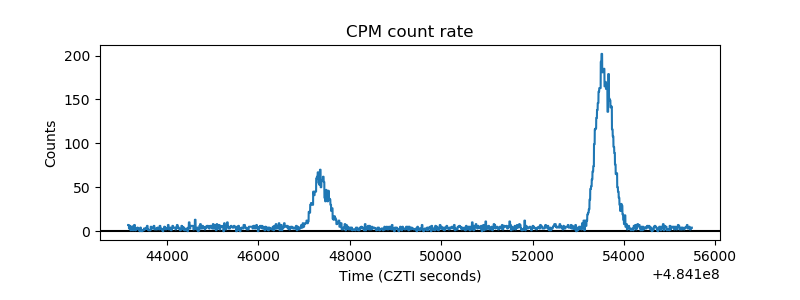 |
| CZT Counter | 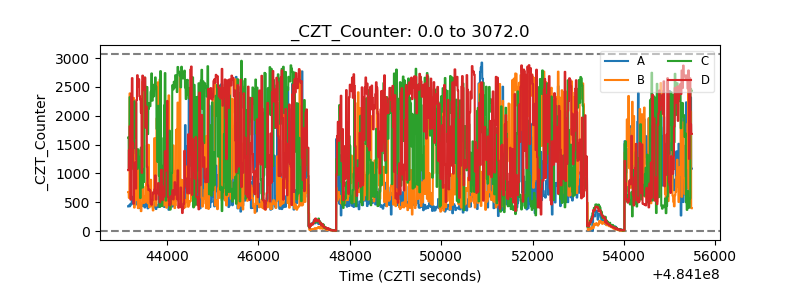 |
| +2.5 Volts monitor | 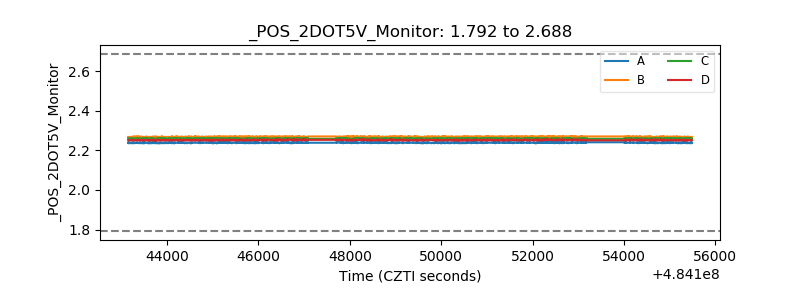 |
| +5 Volts monitor | 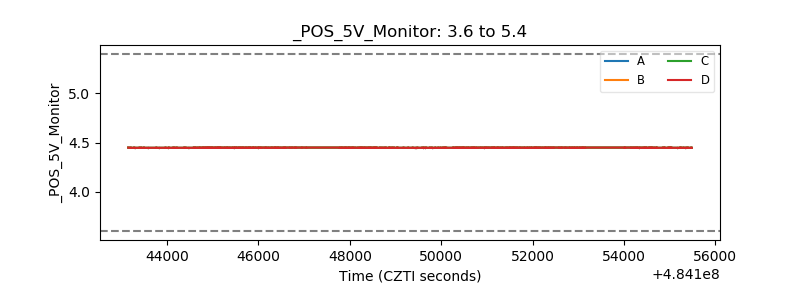 |
| _ROLL_ROT | 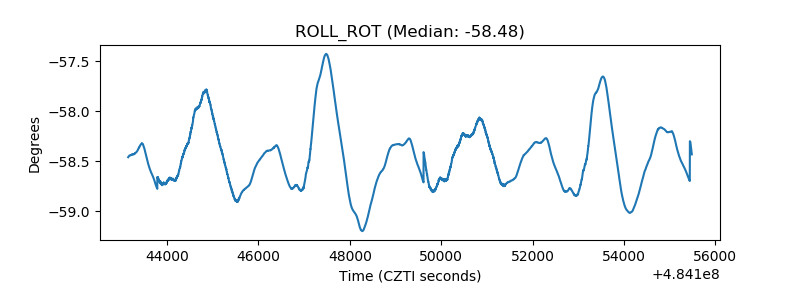 |
| _Roll_DEC | 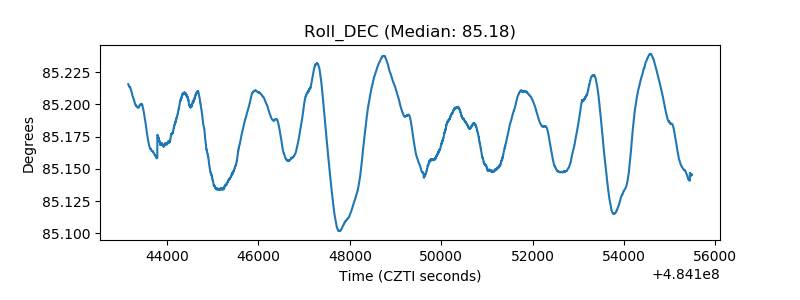 |
| _Roll_RA | 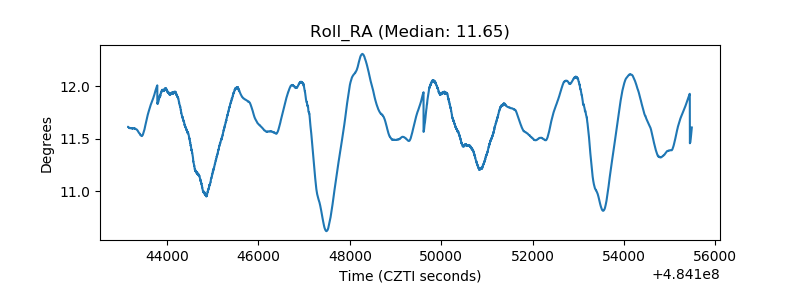 |
| Veto Counter | 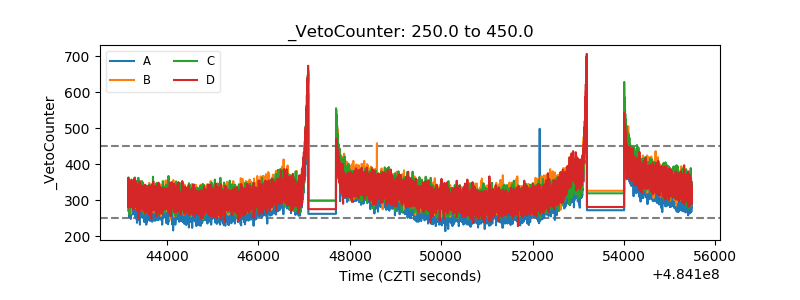 |