| Param | Original file | Final file |
|---|---|---|
| Filename | modeM0/AS1C09_011T06_9000006468_51941cztM0_level2.fits | modeM0/AS1C09_011T06_9000006468_51941cztM0_level2_quad_clean.evt |
| Size (bytes) | 1,000,696,320 | 65,001,600 |
| Size | 954.3 MB | 62.0 MB |
| Events in quadrant A | 8,163,523 | 466,984 |
| Events in quadrant B | 6,499,726 | 517,013 |
| Events in quadrant C | 9,594,015 | 342,839 |
| Events in quadrant D | 12,324,614 | 223,358 |
| Mode M0 | |||
|---|---|---|---|
| Quadrant | BADHDUFLAG | Total packets | Discarded packets |
| A | 0 | 28467 | 1 |
| B | 0 | 23448 | 1 |
| C | 0 | 32660 | 1 |
| D | 0 | 40762 | 6 |
| Mode M9 | |||
|---|---|---|---|
| Quadrant | BADHDUFLAG | Total packets | Discarded packets |
| A | 0 | 10 | 0 |
| B | 0 | 10 | 0 |
| C | 0 | 10 | 0 |
| D | 0 | 10 | 0 |
| Mode SS | |||
|---|---|---|---|
| Quadrant | BADHDUFLAG | Total packets | Discarded packets |
| A | 0 | 120 | 0 |
| B | 0 | 120 | 0 |
| C | 0 | 120 | 0 |
| D | 0 | 120 | 0 |
| Quadrant | Total seconds | Saturated seconds | Saturation percentage |
|---|---|---|---|
| A | 5977 | 1562 | 26.133512% |
| B | 5977 | 1264 | 21.147733% |
| C | 5977 | 2712 | 45.373933% |
| D | 5977 | 3942 | 65.952819% |
Noise dominated data is calculated using 1-second bins in cleaned event files. If a bin has >2000 counts, and if more than 50% of those come from <1% of pixels, then it is considered to be noise-dominated and hence unusable.
| Quadrant | # 1 sec bins | Bins with >0 counts | Bins with >2000 counts | High rate bins dominated by noise | Noise dominated (total time) | Noise dominated (detector-on time) | Marked lightcurve |
|---|---|---|---|---|---|---|---|
| A | 6906 | 5977 | 1451 | 1451 | 21.01% | 24.28% | 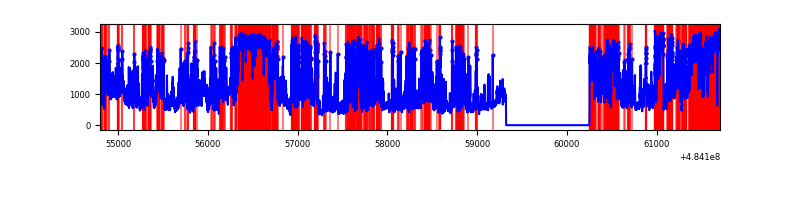 |
| B | 6906 | 5977 | 1033 | 1033 | 14.96% | 17.28% | 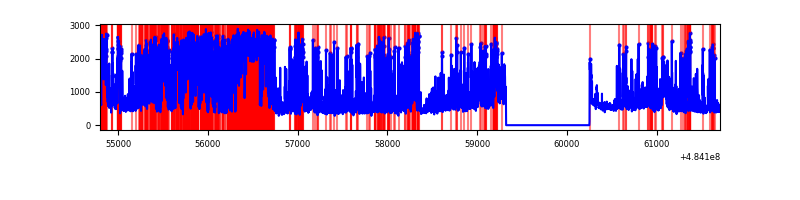 |
| C | 6906 | 5977 | 2450 | 2450 | 35.48% | 40.99% | 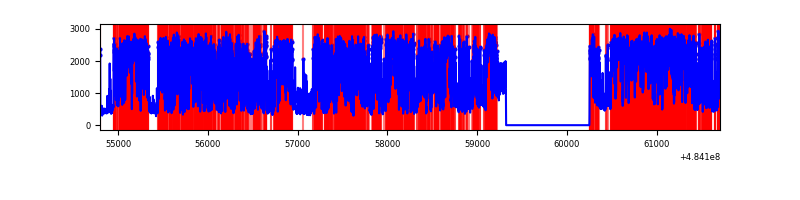 |
| D | 6906 | 5977 | 3875 | 3875 | 56.11% | 64.83% | 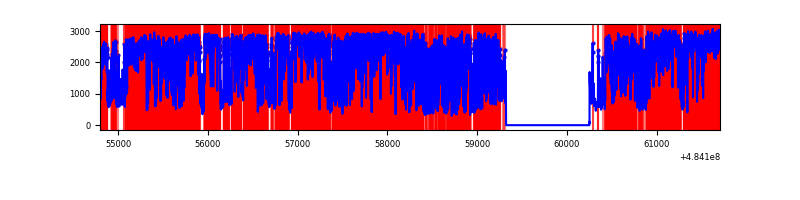 |
Top three noisy pixels from each quadrant. If the there are fewer than three noisy pixels in the level2.evt file, extra rows are filled as -1
| Pixel properties | Quadrant properties | ||||||
|---|---|---|---|---|---|---|---|
| Quadrant | DetID | PixID | Counts | Sigma | Mean | Median | Sigma |
| A | 7 | 64 | 1847440 | 12955.01 | 563 | 548 | 142.6 |
| A | 15 | 239 | 1789365 | 12547.64 | 563 | 548 | 142.6 |
| A | 12 | 3 | 1408232 | 9874.19 | 563 | 548 | 142.6 |
| B | 12 | 32 | 3419689 | 28097.94 | 572 | 554 | 121.7 |
| B | 4 | 206 | 174598 | 1430.26 | 572 | 554 | 121.7 |
| B | 5 | 32 | 106307 | 869.06 | 572 | 554 | 121.7 |
| C | 15 | 224 | 6087818 | 44771.46 | 475 | 470 | 136.0 |
| C | 15 | 209 | 470661 | 3458.18 | 475 | 470 | 136.0 |
| C | 15 | 147 | 382883 | 2812.59 | 475 | 470 | 136.0 |
| D | 12 | 17 | 9949500 | 83656.0 | 404 | 385 | 118.9 |
| D | 3 | 12 | 294181 | 2470.35 | 404 | 385 | 118.9 |
| D | 15 | 94 | 89147 | 746.35 | 404 | 385 | 118.9 |
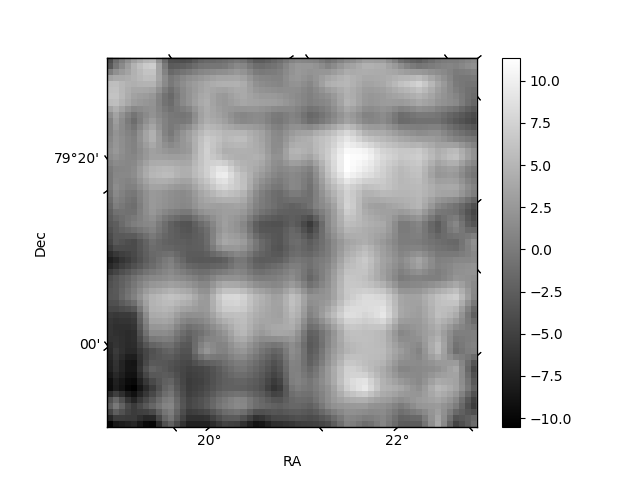
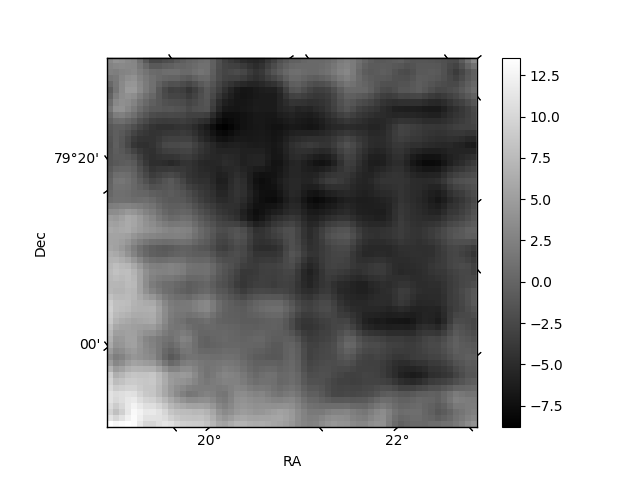
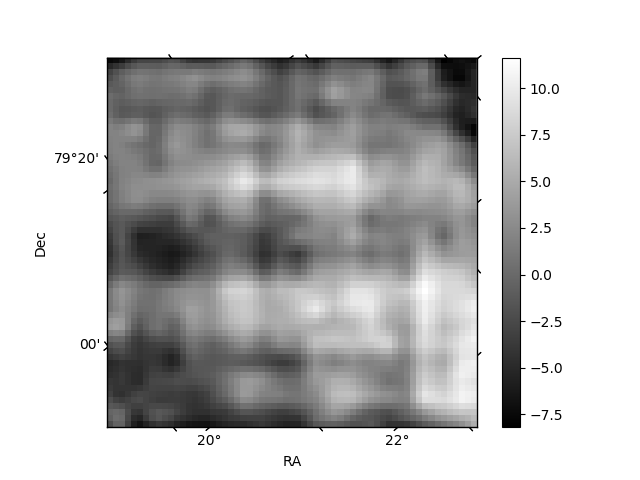
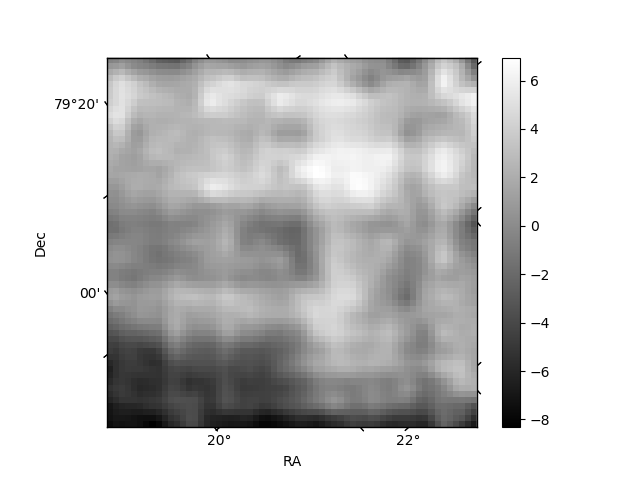
Histogram calculated using DETX and DETY for each event in the final _common_clean file
| Quadrant A | 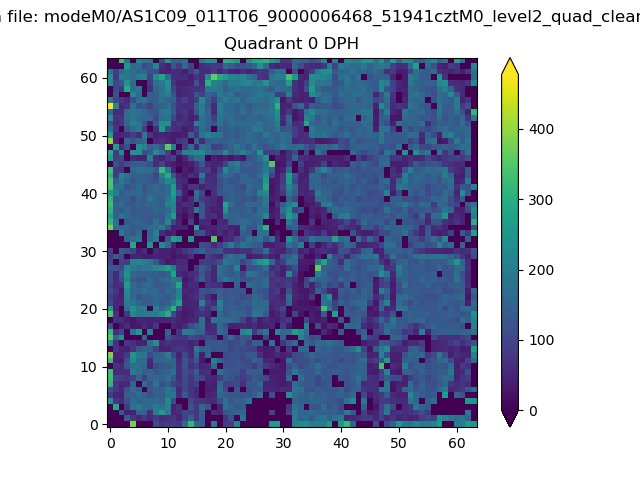 |
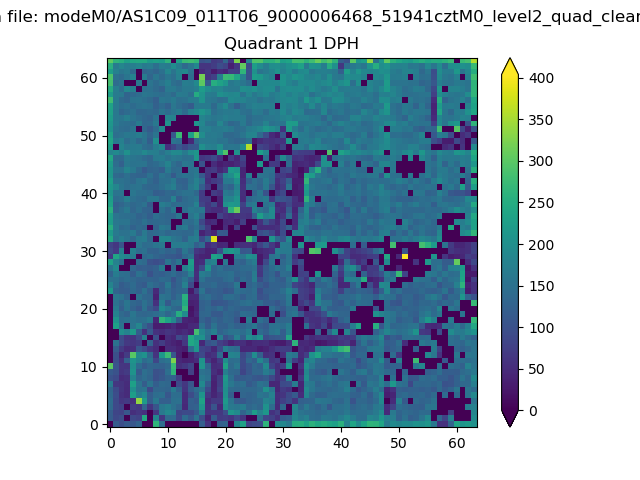 |
Quadrant B |
|---|---|---|---|
| Quadrant D | 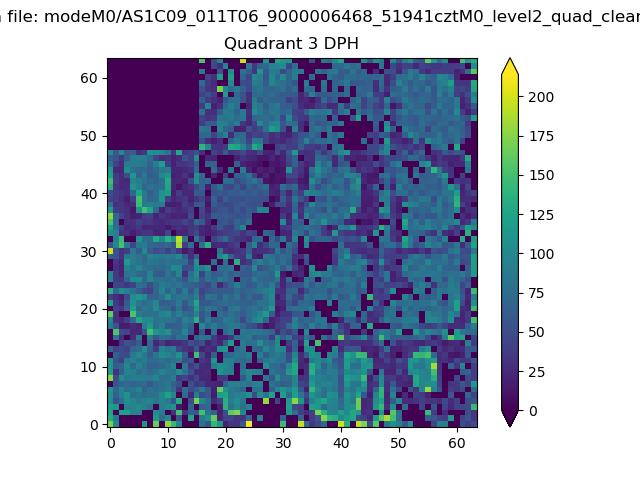 |
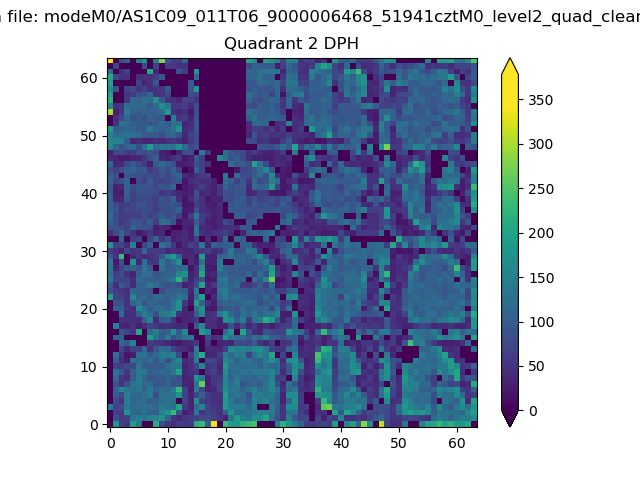 |
Quadrant C |
| Plot type | Count rate plots | Images |
|---|---|---|
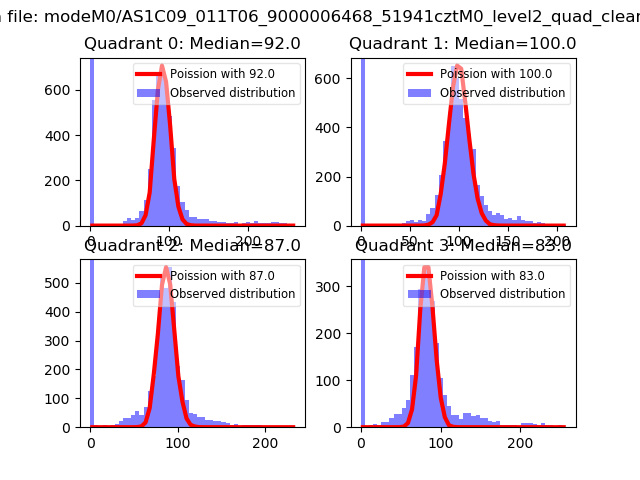
| Comparison with Poisson distribution Blue bars denote a histogram of data divided into 1 sec bins. Red curve is a Poisson curve with rate = median count rate of data. |
 |
 |
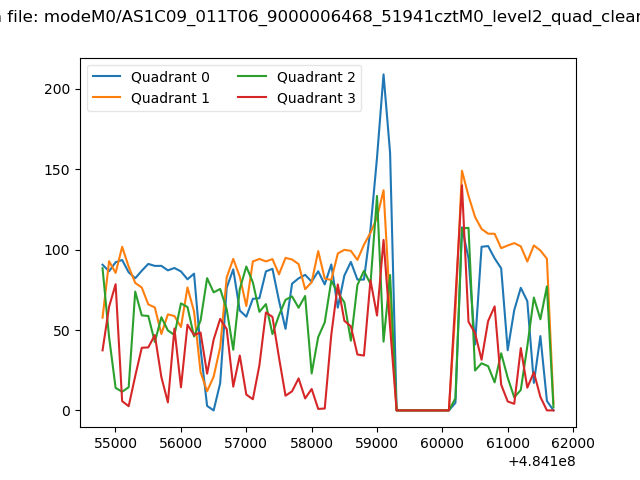
| Quadrant-wise count rates Data is divided into 100 sec bins |
 |
|
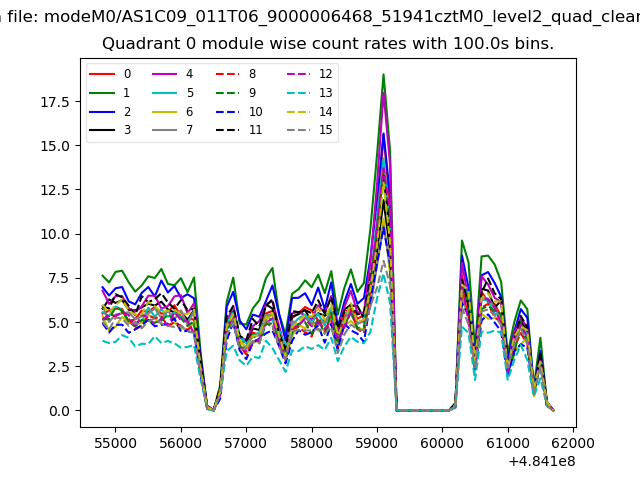
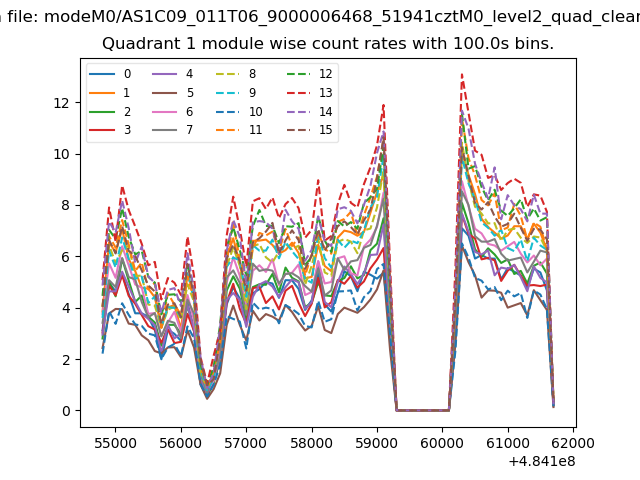
| Module-wise count rates for Quadrant A Data is divided into 100 sec bins |
 |
 |
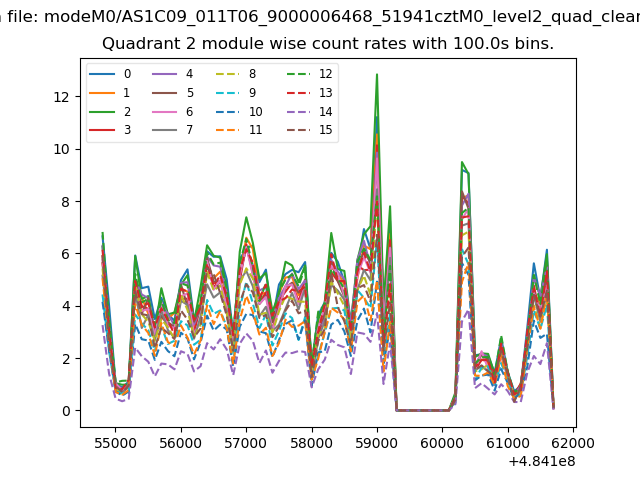
| Module-wise count rates for Quadrant B Data is divided into 100 sec bins |
 |
 |
| Module-wise count rates for Quadrant C Data is divided into 100 sec bins |
 |
 |
| Module-wise count rates for Quadrant D Data is divided into 100 sec bins |
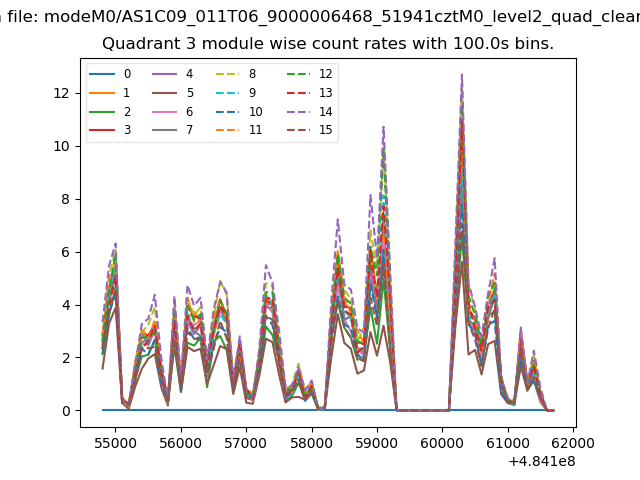 |
 |
| Parameter | Plot |
|---|---|
| CZT HV Monitor | 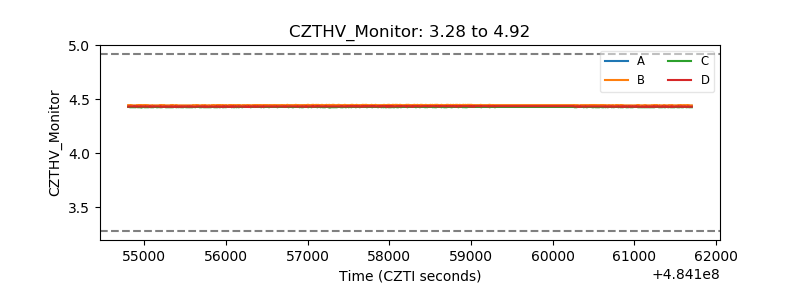 |
| D_VDD |  |
| Temperature 1 | 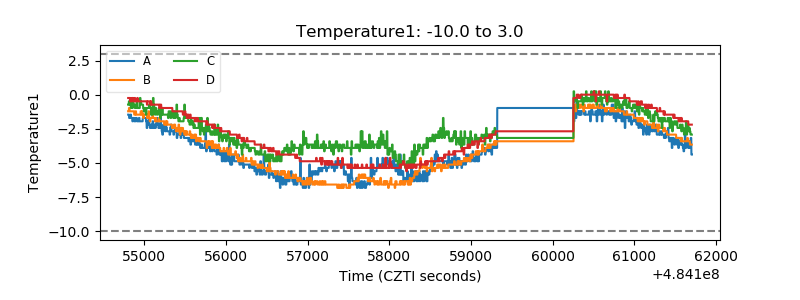 |
| Veto HV Monitor | 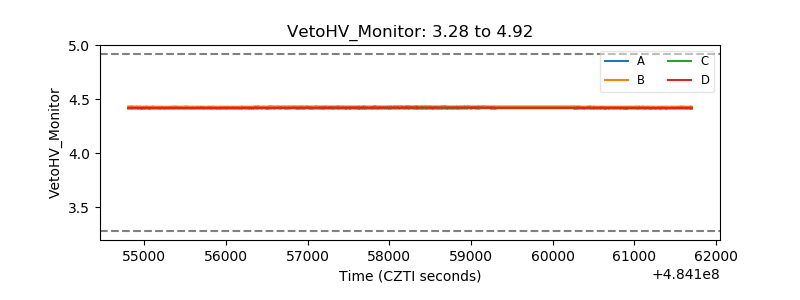 |
| Veto LLD | 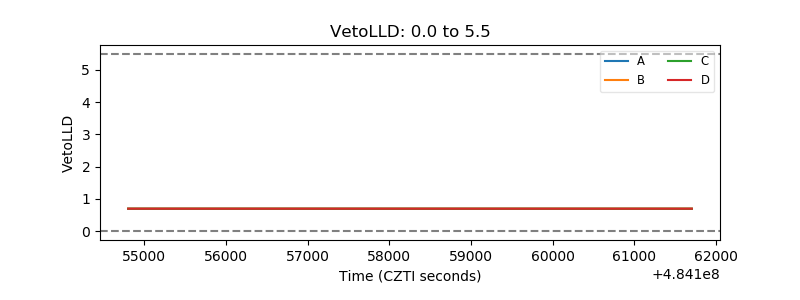 |
| Alpha Counter | 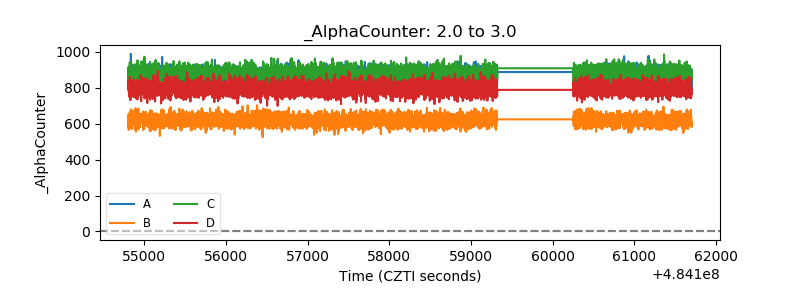 |
| _CPM_Rate | 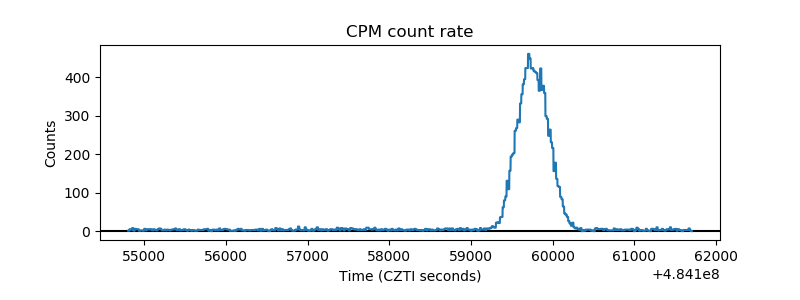 |
| CZT Counter | 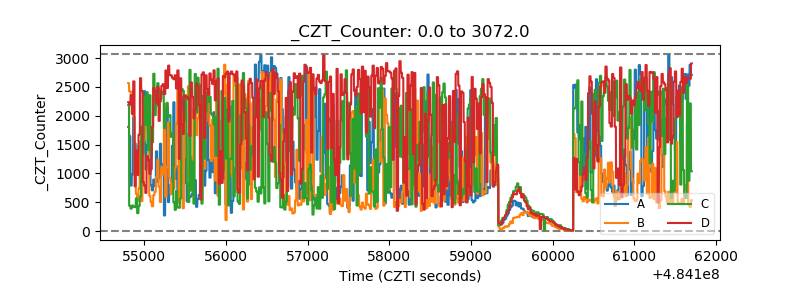 |
| +2.5 Volts monitor | 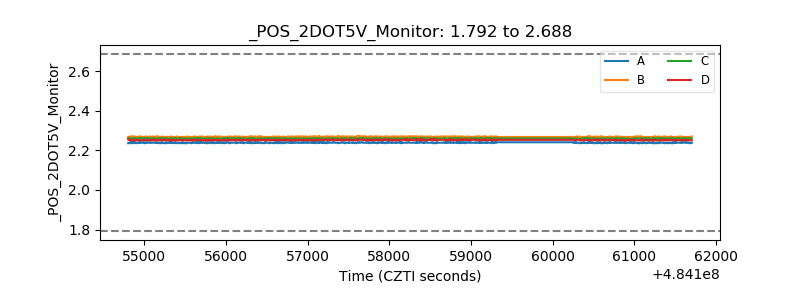 |
| +5 Volts monitor |  |
| _ROLL_ROT | 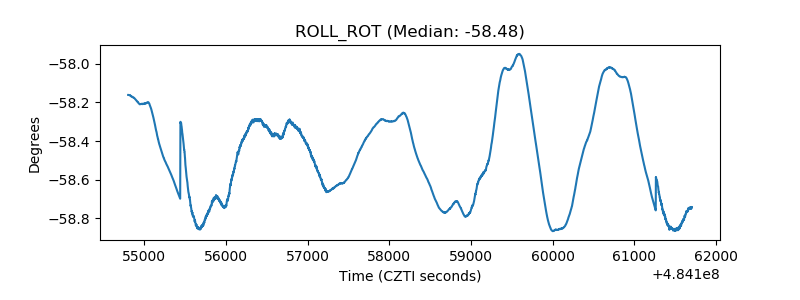 |
| _Roll_DEC | 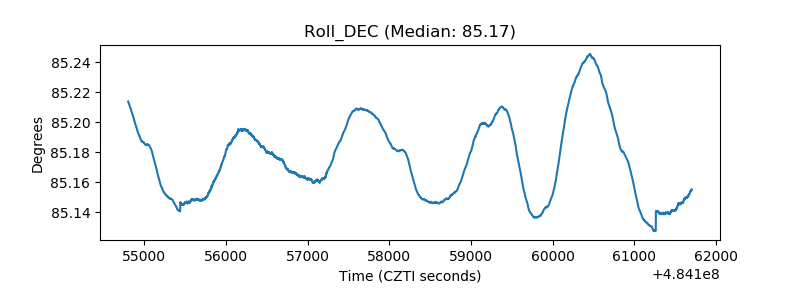 |
| _Roll_RA | 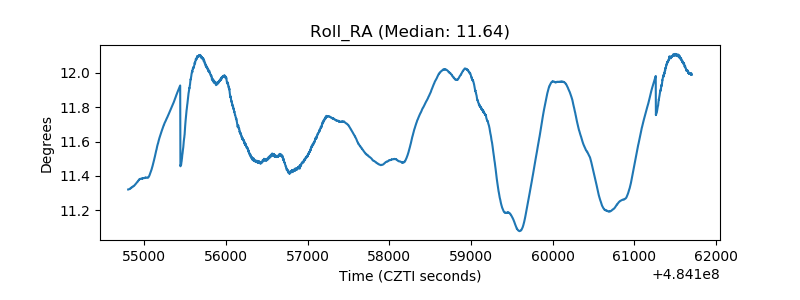 |
| Veto Counter | 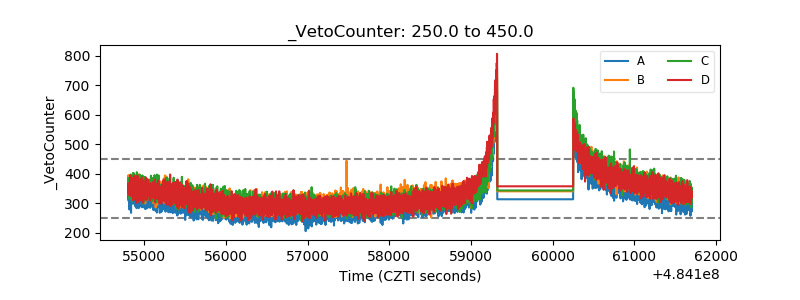 |