| Param | Original file | Final file |
|---|---|---|
| Filename | modeM0/AS1C09_011T06_9000006468_51943cztM0_level2.fits | modeM0/AS1C09_011T06_9000006468_51943cztM0_level2_quad_clean.evt |
| Size (bytes) | 992,321,280 | 71,504,640 |
| Size | 946.4 MB | 68.2 MB |
| Events in quadrant A | 8,373,782 | 488,896 |
| Events in quadrant B | 4,948,009 | 637,404 |
| Events in quadrant C | 9,498,608 | 411,053 |
| Events in quadrant D | 13,418,246 | 180,673 |
| Mode M0 | |||
|---|---|---|---|
| Quadrant | BADHDUFLAG | Total packets | Discarded packets |
| A | 0 | 29368 | 4 |
| B | 0 | 19148 | 1 |
| C | 0 | 32693 | 1 |
| D | 0 | 44305 | 1 |
| Mode M9 | |||
|---|---|---|---|
| Quadrant | BADHDUFLAG | Total packets | Discarded packets |
| A | 0 | 10 | 0 |
| B | 0 | 10 | 0 |
| C | 0 | 10 | 0 |
| D | 0 | 10 | 0 |
| Mode SS | |||
|---|---|---|---|
| Quadrant | BADHDUFLAG | Total packets | Discarded packets |
| A | 0 | 130 | 0 |
| B | 0 | 130 | 0 |
| C | 0 | 130 | 0 |
| D | 0 | 130 | 0 |
| Quadrant | Total seconds | Saturated seconds | Saturation percentage |
|---|---|---|---|
| A | 6398 | 1518 | 23.726164% |
| B | 6399 | 451 | 7.047976% |
| C | 6399 | 2339 | 36.552586% |
| D | 6399 | 4702 | 73.480231% |
Noise dominated data is calculated using 1-second bins in cleaned event files. If a bin has >2000 counts, and if more than 50% of those come from <1% of pixels, then it is considered to be noise-dominated and hence unusable.
| Quadrant | # 1 sec bins | Bins with >0 counts | Bins with >2000 counts | High rate bins dominated by noise | Noise dominated (total time) | Noise dominated (detector-on time) | Marked lightcurve |
|---|---|---|---|---|---|---|---|
| A | 7448 | 6399 | 1452 | 1452 | 19.50% | 22.69% | 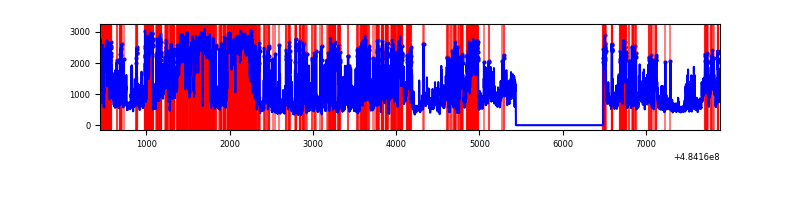 |
| B | 7449 | 6400 | 207 | 207 | 2.78% | 3.23% | 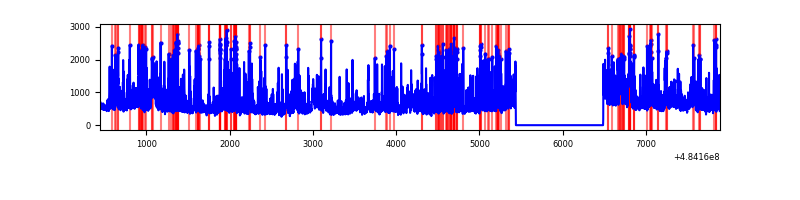 |
| C | 7449 | 6400 | 2175 | 2175 | 29.20% | 33.98% | 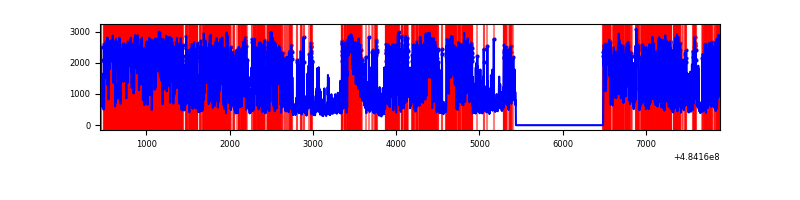 |
| D | 7449 | 6400 | 4107 | 4107 | 55.13% | 64.17% | 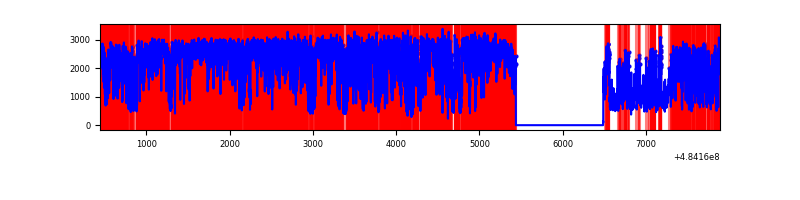 |
Top three noisy pixels from each quadrant. If the there are fewer than three noisy pixels in the level2.evt file, extra rows are filled as -1
| Pixel properties | Quadrant properties | ||||||
|---|---|---|---|---|---|---|---|
| Quadrant | DetID | PixID | Counts | Sigma | Mean | Median | Sigma |
| A | 15 | 239 | 1917633 | 12555.54 | 608 | 593 | 152.7 |
| A | 12 | 3 | 1767706 | 11573.6 | 608 | 593 | 152.7 |
| A | 7 | 64 | 1344477 | 8801.69 | 608 | 593 | 152.7 |
| B | 12 | 32 | 962766 | 6881.73 | 659 | 639 | 139.8 |
| B | 4 | 171 | 237270 | 1692.53 | 659 | 639 | 139.8 |
| B | 5 | 32 | 165637 | 1180.17 | 659 | 639 | 139.8 |
| C | 15 | 224 | 5565388 | 36297.88 | 549 | 546 | 153.3 |
| C | 15 | 209 | 585889 | 3818.03 | 549 | 546 | 153.3 |
| C | 15 | 147 | 489436 | 3188.89 | 549 | 546 | 153.3 |
| D | 12 | 17 | 10004579 | 102366.82 | 340 | 325 | 97.7 |
| D | 6 | 42 | 1335969 | 13666.75 | 340 | 325 | 97.7 |
| D | 3 | 12 | 248937 | 2543.88 | 340 | 325 | 97.7 |
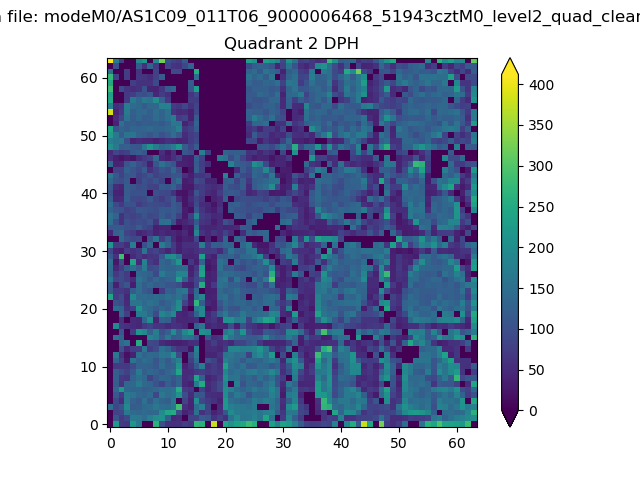
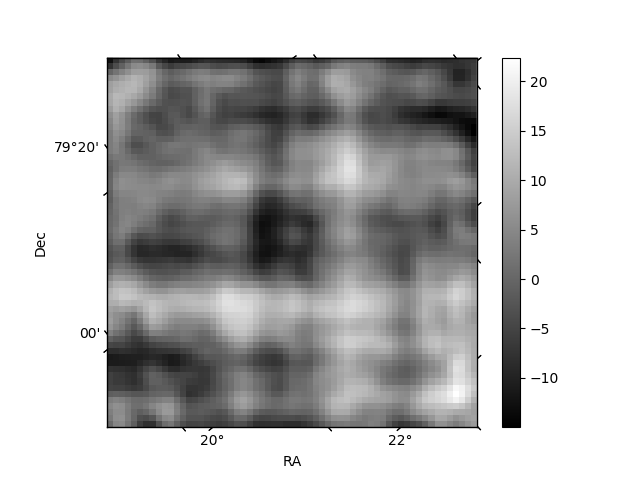
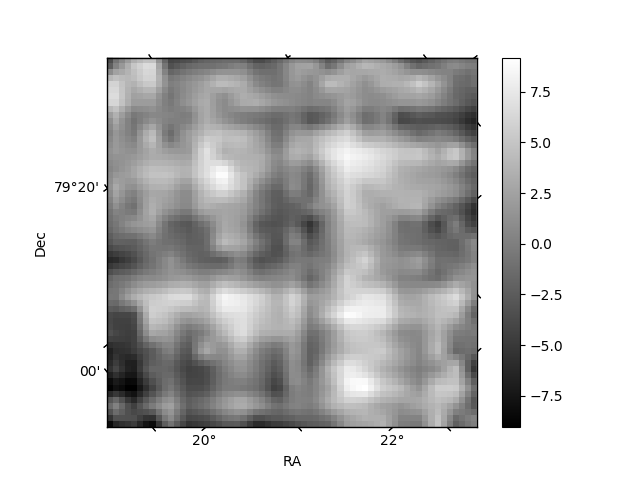
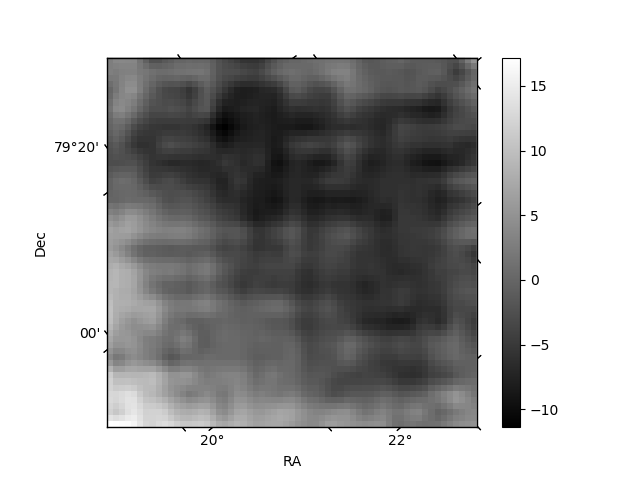
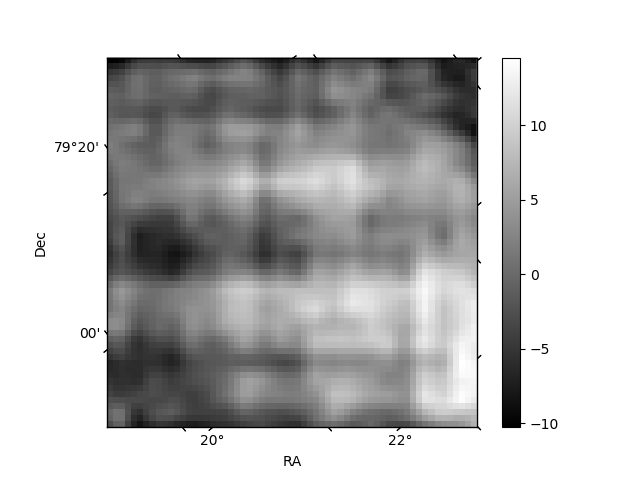
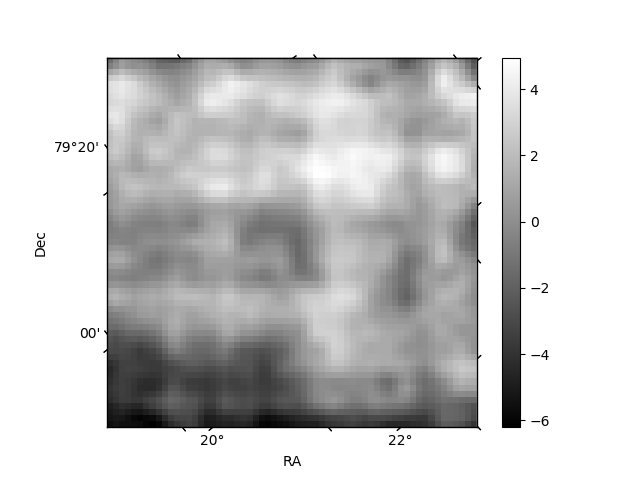
Histogram calculated using DETX and DETY for each event in the final _common_clean file
| Quadrant A | 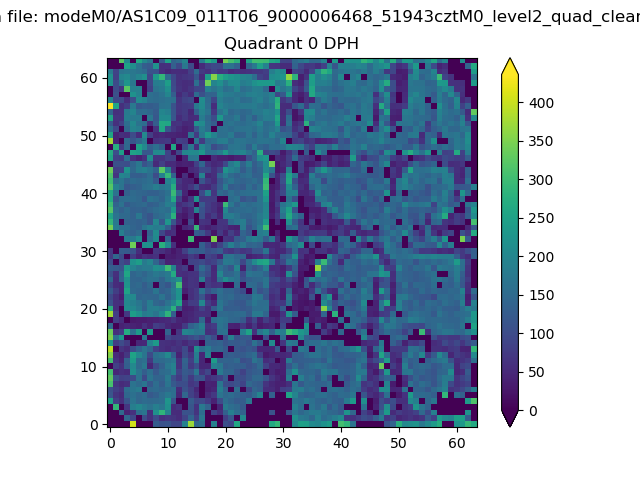 |
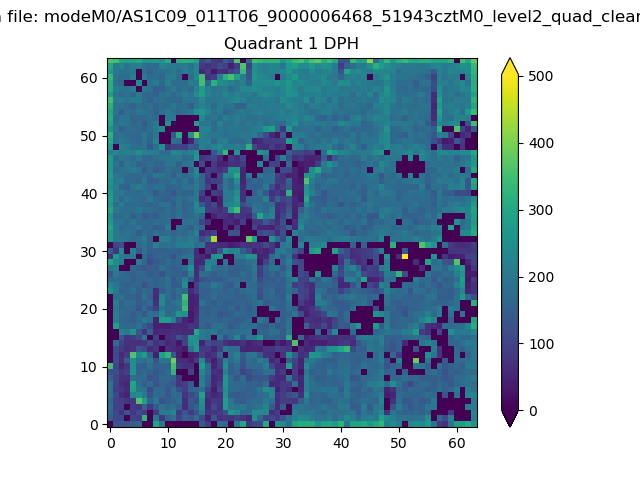 |
Quadrant B |
|---|---|---|---|
| Quadrant D | 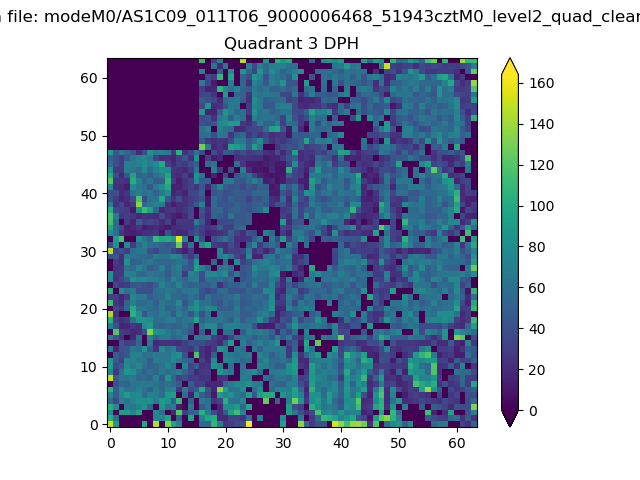 |
 |
Quadrant C |
| Plot type | Count rate plots | Images |
|---|---|---|
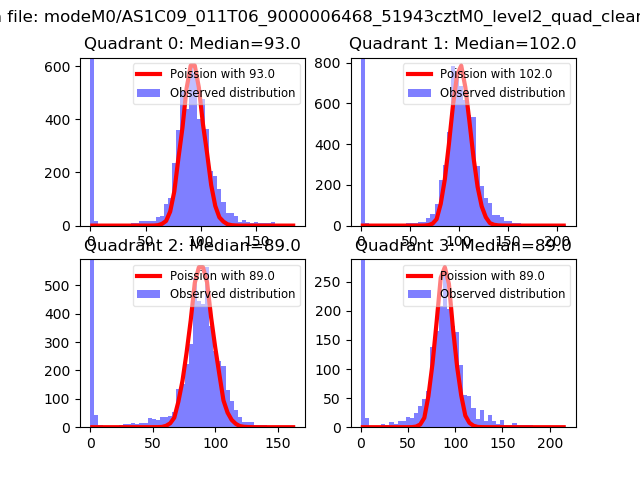
| Comparison with Poisson distribution Blue bars denote a histogram of data divided into 1 sec bins. Red curve is a Poisson curve with rate = median count rate of data. |
 |
 |
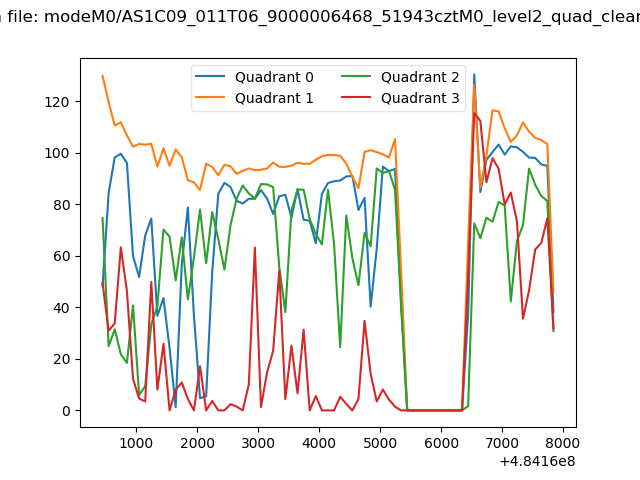
| Quadrant-wise count rates Data is divided into 100 sec bins |
 |
|
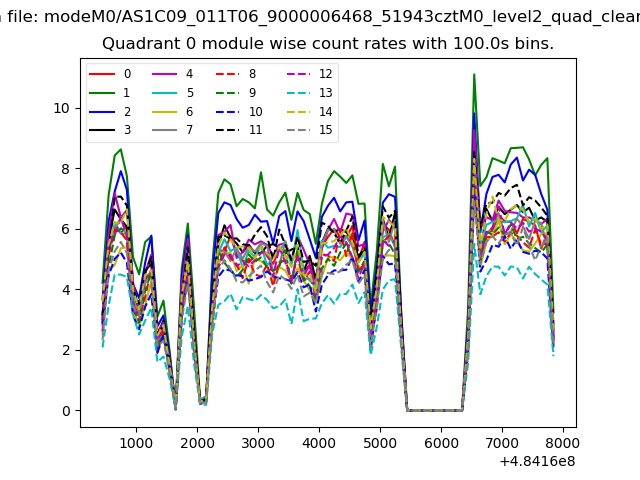
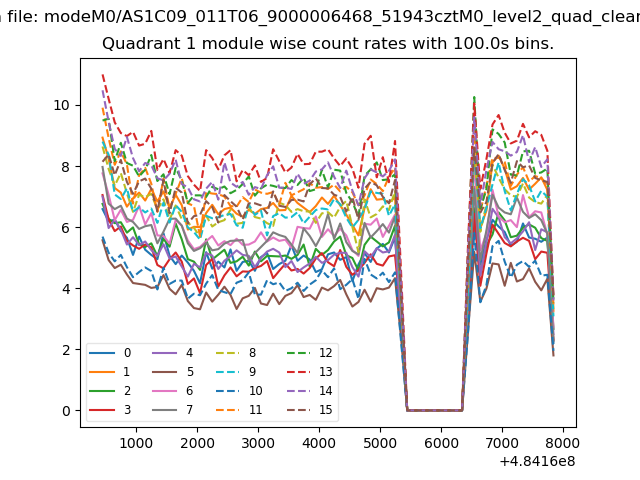
| Module-wise count rates for Quadrant A Data is divided into 100 sec bins |
 |
 |
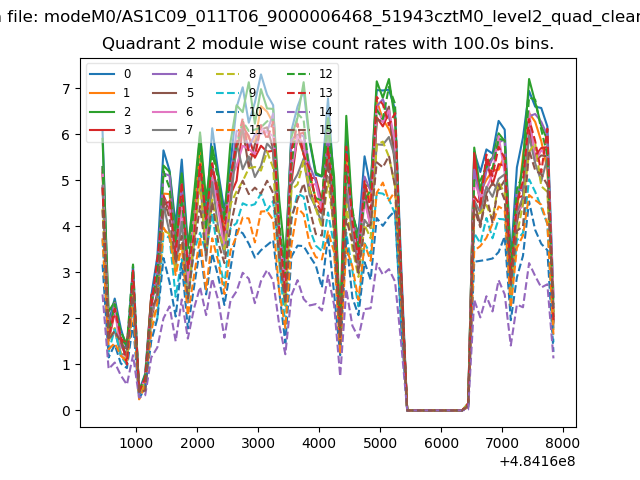
| Module-wise count rates for Quadrant B Data is divided into 100 sec bins |
 |
 |
| Module-wise count rates for Quadrant C Data is divided into 100 sec bins |
 |
 |
| Module-wise count rates for Quadrant D Data is divided into 100 sec bins |
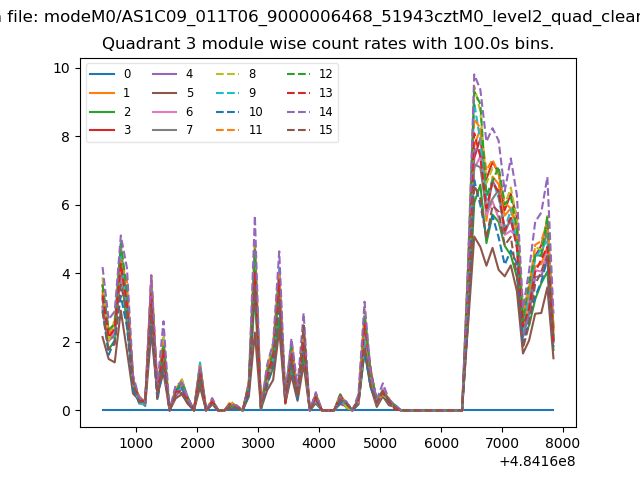 |
 |
| Parameter | Plot |
|---|---|
| CZT HV Monitor | 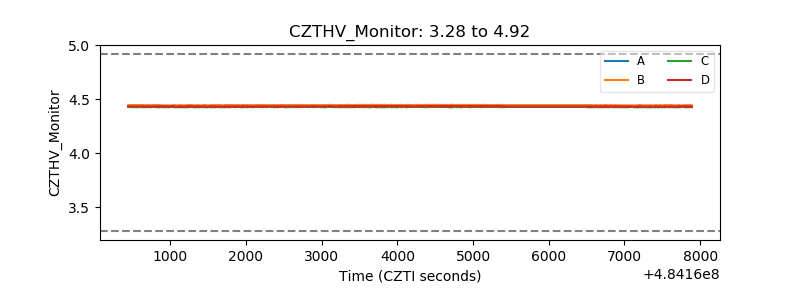 |
| D_VDD | 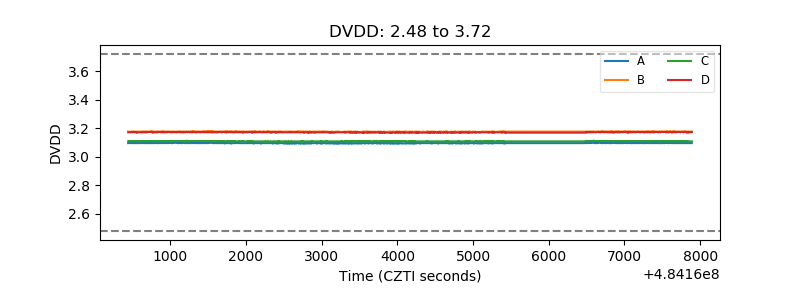 |
| Temperature 1 | 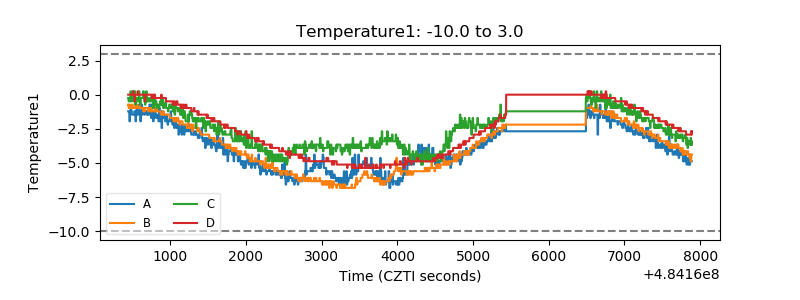 |
| Veto HV Monitor | 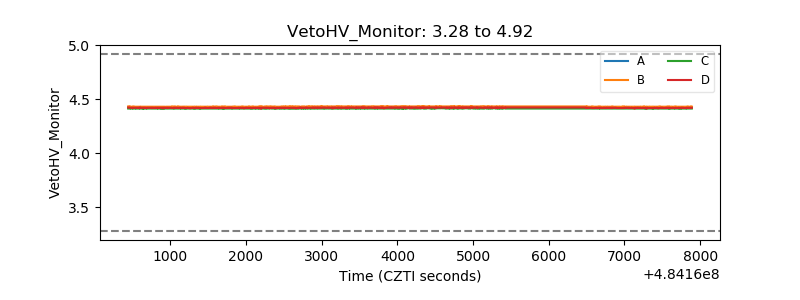 |
| Veto LLD | 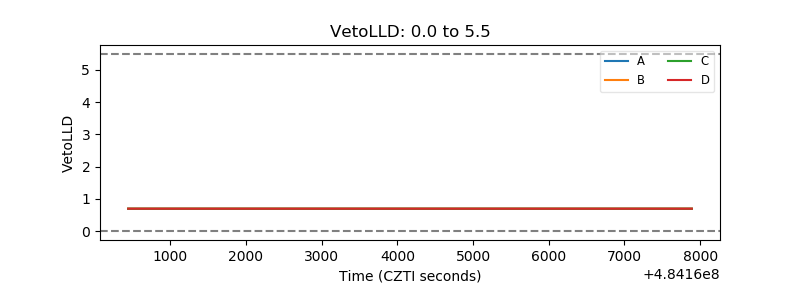 |
| Alpha Counter | 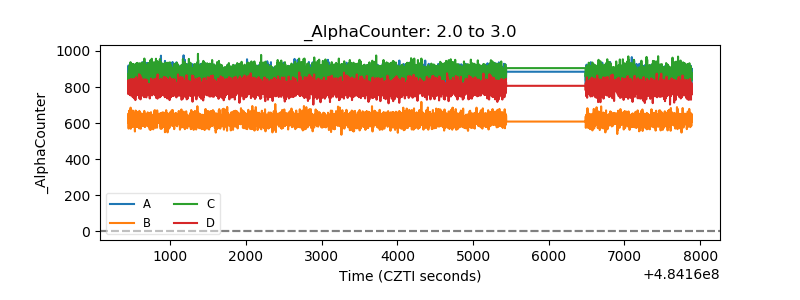 |
| _CPM_Rate | 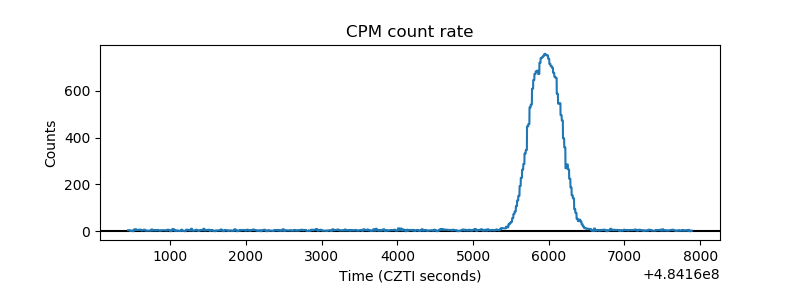 |
| CZT Counter | 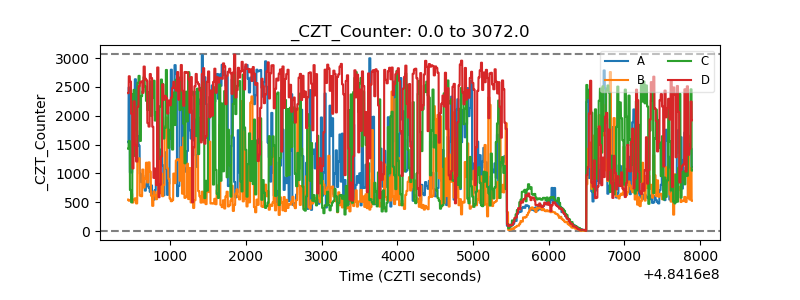 |
| +2.5 Volts monitor | 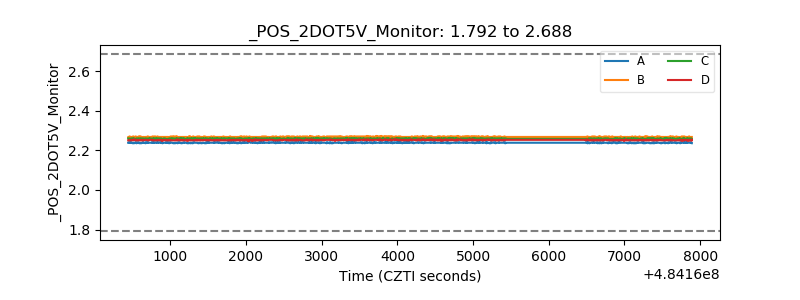 |
| +5 Volts monitor | 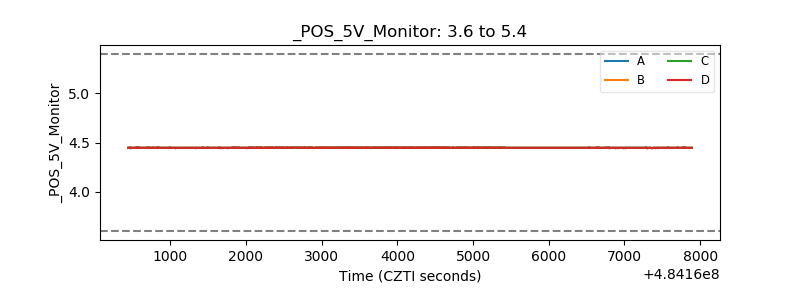 |
| _ROLL_ROT | 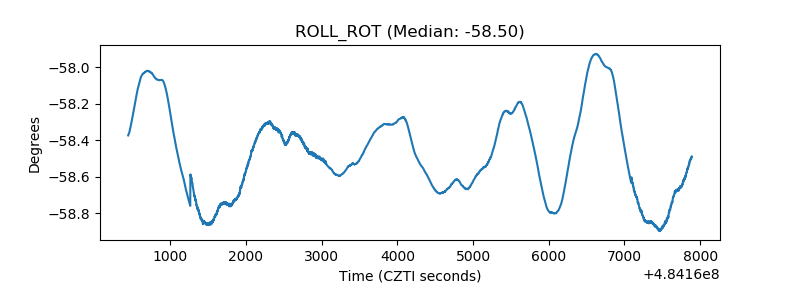 |
| _Roll_DEC | 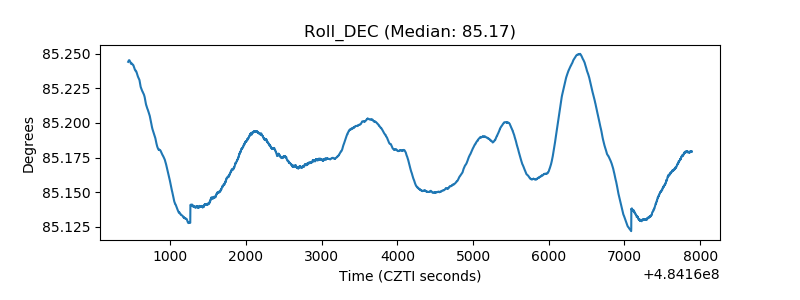 |
| _Roll_RA | 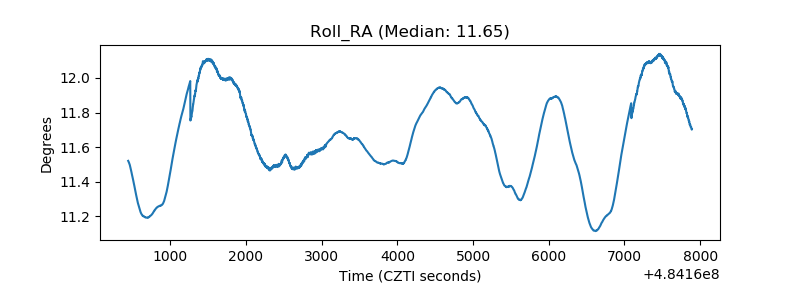 |
| Veto Counter | 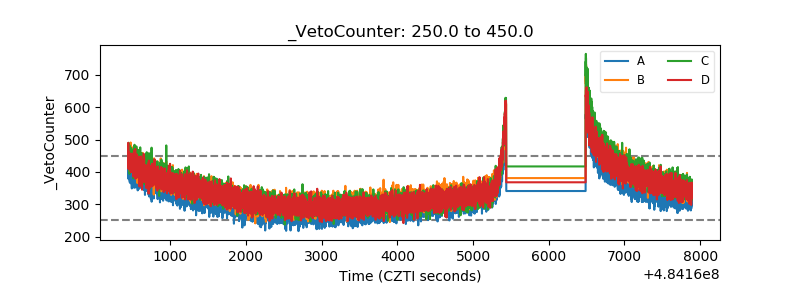 |