| Param | Original file | Final file |
|---|---|---|
| Filename | modeM0/AS1C09_011T06_9000006468_51944cztM0_level2.fits | modeM0/AS1C09_011T06_9000006468_51944cztM0_level2_quad_clean.evt |
| Size (bytes) | 864,069,120 | 70,839,360 |
| Size | 824.0 MB | 67.6 MB |
| Events in quadrant A | 5,939,997 | 537,144 |
| Events in quadrant B | 4,287,989 | 625,361 |
| Events in quadrant C | 9,907,512 | 369,328 |
| Events in quadrant D | 11,374,424 | 183,796 |
| Mode M0 | |||
|---|---|---|---|
| Quadrant | BADHDUFLAG | Total packets | Discarded packets |
| A | 0 | 21895 | 3 |
| B | 0 | 17138 | 1 |
| C | 0 | 33673 | 1 |
| D | 0 | 38033 | 1 |
| Mode M9 | |||
|---|---|---|---|
| Quadrant | BADHDUFLAG | Total packets | Discarded packets |
| A | 0 | 11 | 0 |
| B | 0 | 11 | 0 |
| C | 0 | 11 | 0 |
| D | 0 | 11 | 0 |
| Mode SS | |||
|---|---|---|---|
| Quadrant | BADHDUFLAG | Total packets | Discarded packets |
| A | 0 | 126 | 0 |
| B | 0 | 126 | 0 |
| C | 0 | 126 | 0 |
| D | 0 | 126 | 0 |
| Quadrant | Total seconds | Saturated seconds | Saturation percentage |
|---|---|---|---|
| A | 6139 | 702 | 11.435087% |
| B | 6139 | 313 | 5.098550% |
| C | 6139 | 2634 | 42.906011% |
| D | 6140 | 4270 | 69.543974% |
Noise dominated data is calculated using 1-second bins in cleaned event files. If a bin has >2000 counts, and if more than 50% of those come from <1% of pixels, then it is considered to be noise-dominated and hence unusable.
| Quadrant | # 1 sec bins | Bins with >0 counts | Bins with >2000 counts | High rate bins dominated by noise | Noise dominated (total time) | Noise dominated (detector-on time) | Marked lightcurve |
|---|---|---|---|---|---|---|---|
| A | 7284 | 6140 | 672 | 672 | 9.23% | 10.94% | 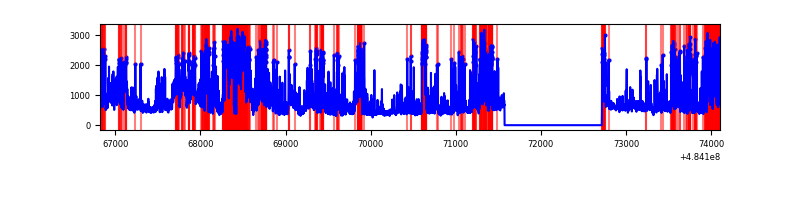 |
| B | 7284 | 6140 | 152 | 152 | 2.09% | 2.48% | 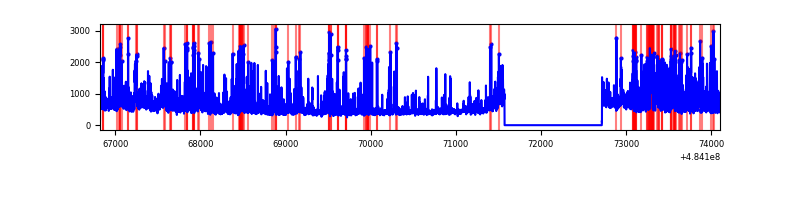 |
| C | 7284 | 6140 | 2452 | 2452 | 33.66% | 39.93% | 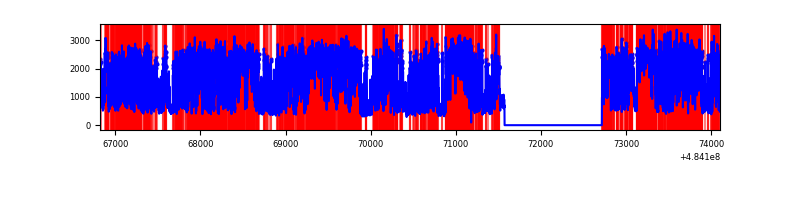 |
| D | 7285 | 6141 | 3038 | 3038 | 41.70% | 49.47% | 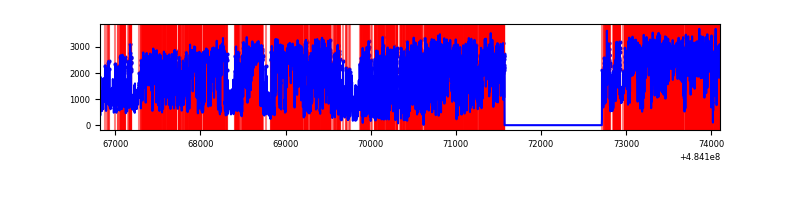 |
Top three noisy pixels from each quadrant. If the there are fewer than three noisy pixels in the level2.evt file, extra rows are filled as -1
| Pixel properties | Quadrant properties | ||||||
|---|---|---|---|---|---|---|---|
| Quadrant | DetID | PixID | Counts | Sigma | Mean | Median | Sigma |
| A | 7 | 64 | 1768280 | 11637.06 | 610 | 597 | 151.9 |
| A | 12 | 3 | 625387 | 4113.14 | 610 | 597 | 151.9 |
| A | 15 | 239 | 304388 | 1999.93 | 610 | 597 | 151.9 |
| B | 4 | 171 | 529539 | 3959.24 | 632 | 613 | 133.6 |
| B | 12 | 32 | 454411 | 3396.87 | 632 | 613 | 133.6 |
| B | 5 | 32 | 90719 | 674.48 | 632 | 613 | 133.6 |
| C | 15 | 224 | 6490277 | 45006.49 | 512 | 508 | 144.2 |
| C | 15 | 147 | 441313 | 3056.98 | 512 | 508 | 144.2 |
| C | 15 | 189 | 280037 | 1938.53 | 512 | 508 | 144.2 |
| D | 12 | 17 | 8668353 | 96491.37 | 307 | 292 | 89.8 |
| D | 6 | 42 | 801902 | 8923.39 | 307 | 292 | 89.8 |
| D | 3 | 12 | 276858 | 3078.69 | 307 | 292 | 89.8 |
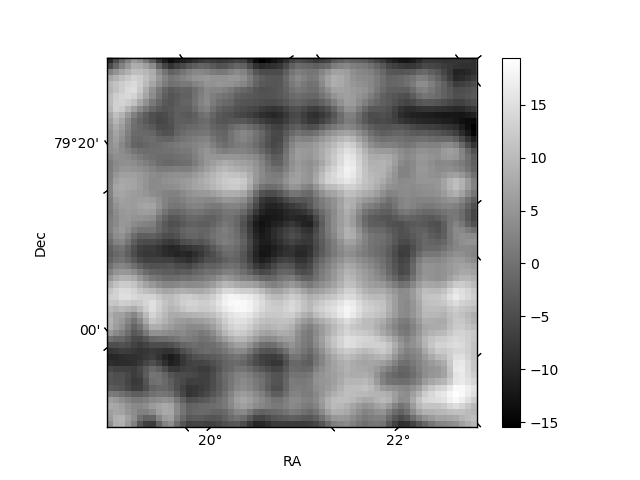
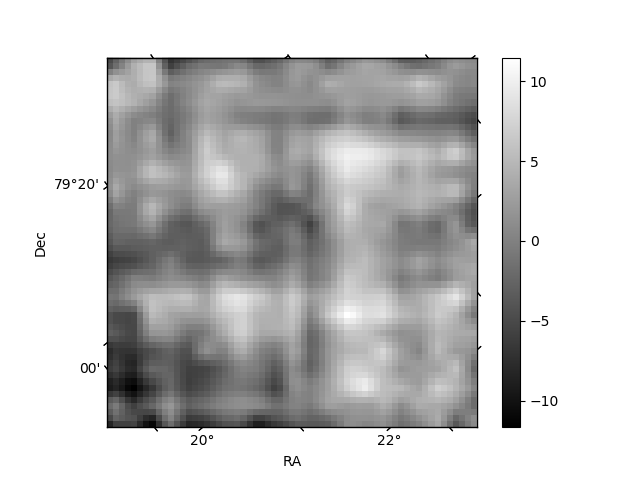
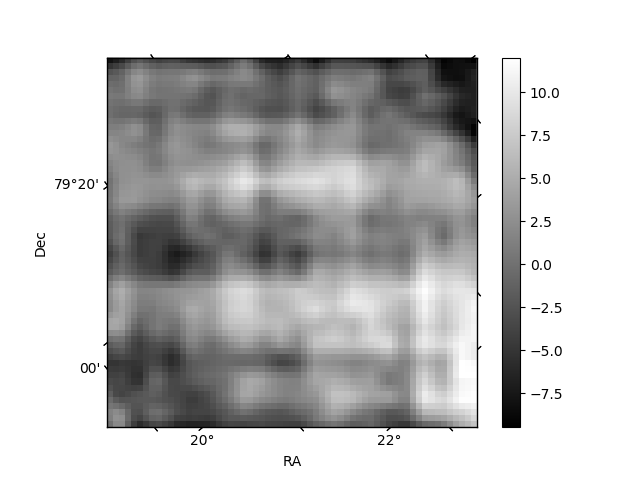
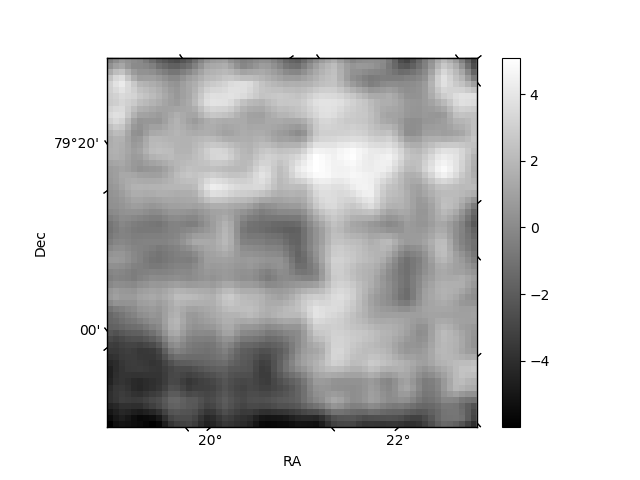
Histogram calculated using DETX and DETY for each event in the final _common_clean file
| Quadrant A | 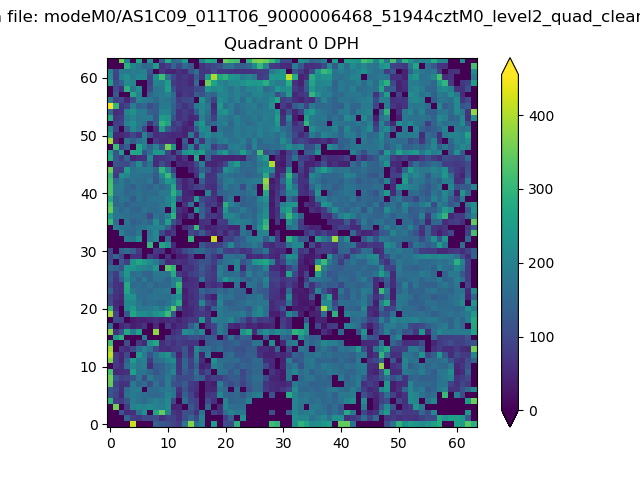 |
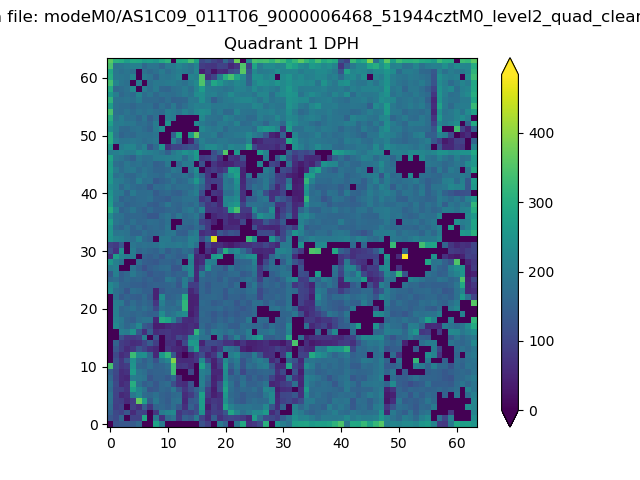 |
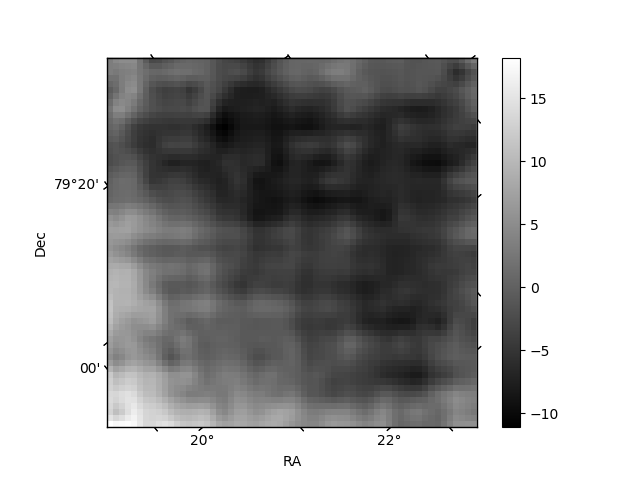
Quadrant B |
|---|---|---|---|
| Quadrant D | 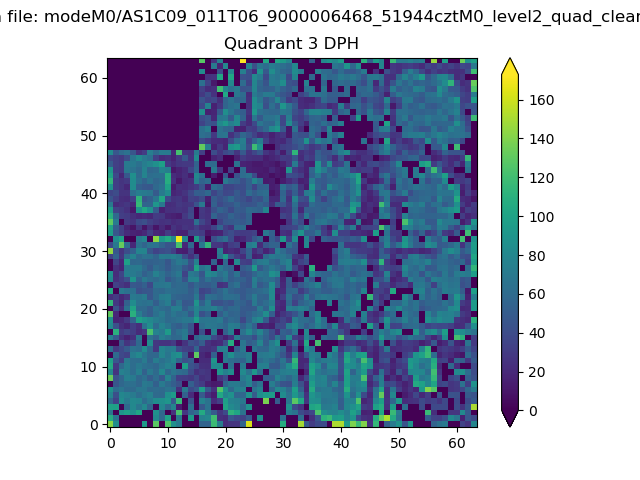 |
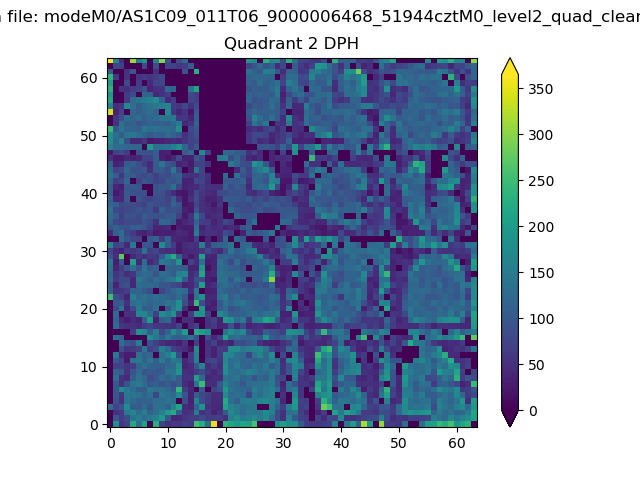 |
Quadrant C |
| Plot type | Count rate plots | Images |
|---|---|---|
| Comparison with Poisson distribution Blue bars denote a histogram of data divided into 1 sec bins. Red curve is a Poisson curve with rate = median count rate of data. |
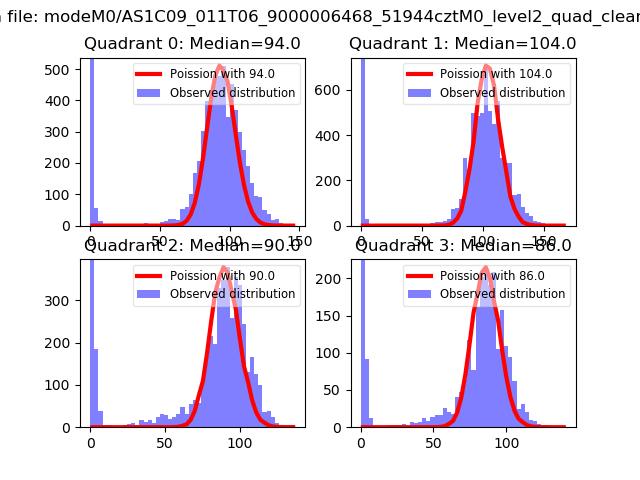 |
 |
| Quadrant-wise count rates Data is divided into 100 sec bins |
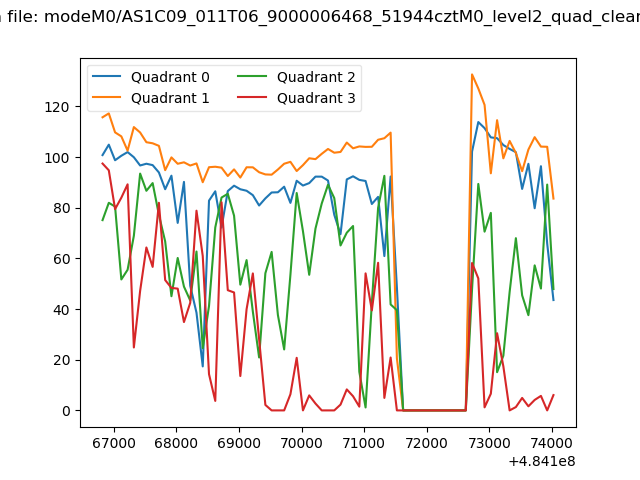 |
|
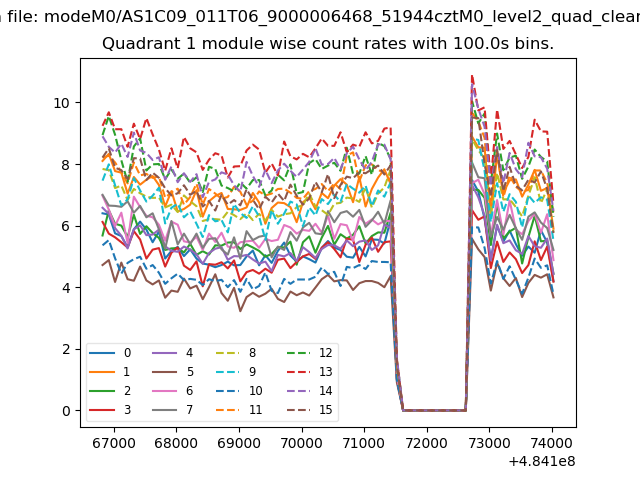
| Module-wise count rates for Quadrant A Data is divided into 100 sec bins |
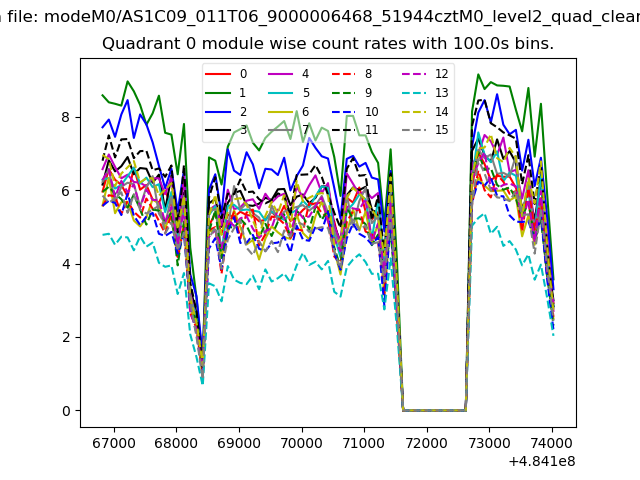 |
 |
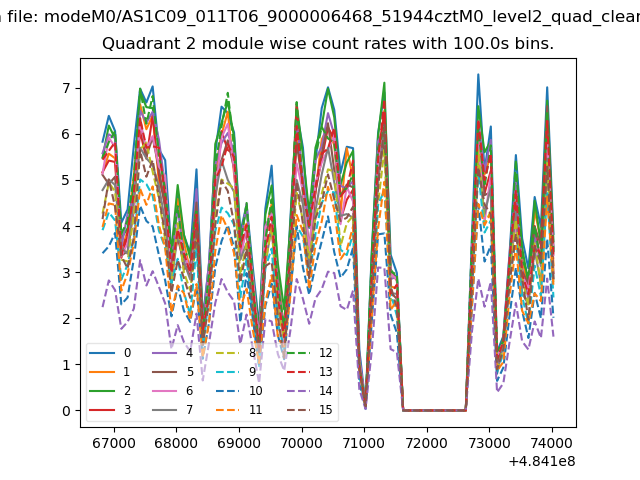
| Module-wise count rates for Quadrant B Data is divided into 100 sec bins |
 |
 |
| Module-wise count rates for Quadrant C Data is divided into 100 sec bins |
 |
 |
| Module-wise count rates for Quadrant D Data is divided into 100 sec bins |
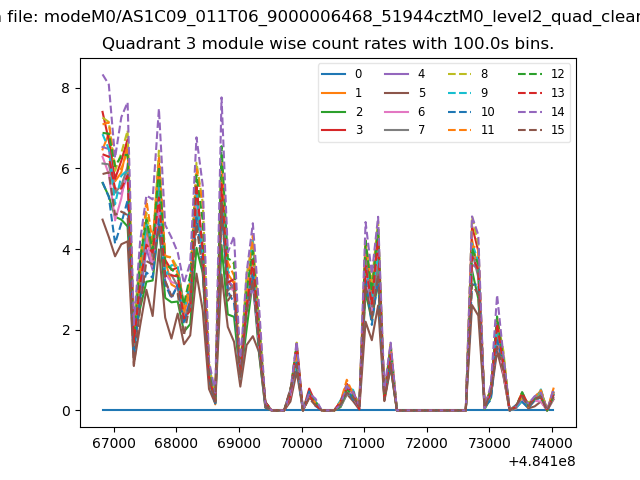 |
 |
| Parameter | Plot |
|---|---|
| CZT HV Monitor | 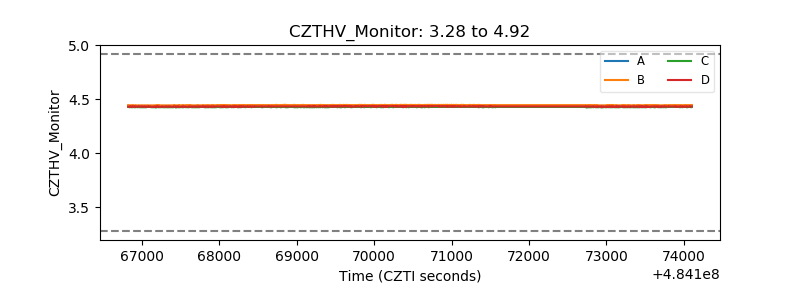 |
| D_VDD | 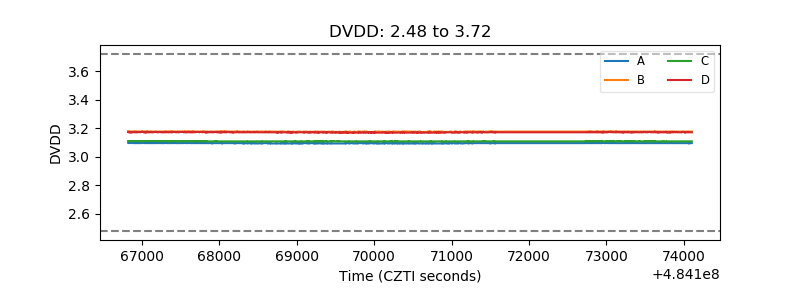 |
| Temperature 1 | 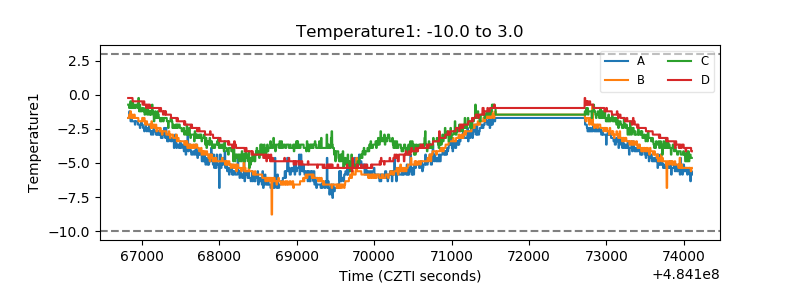 |
| Veto HV Monitor | 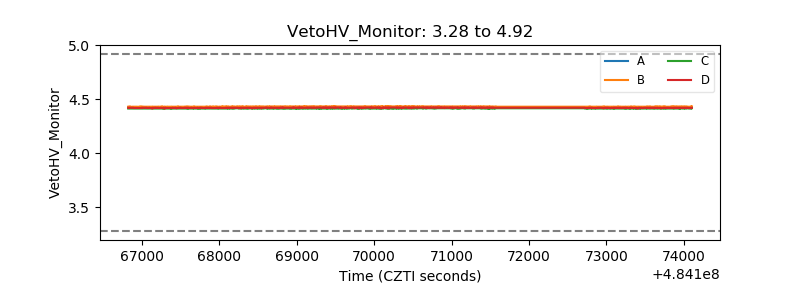 |
| Veto LLD | 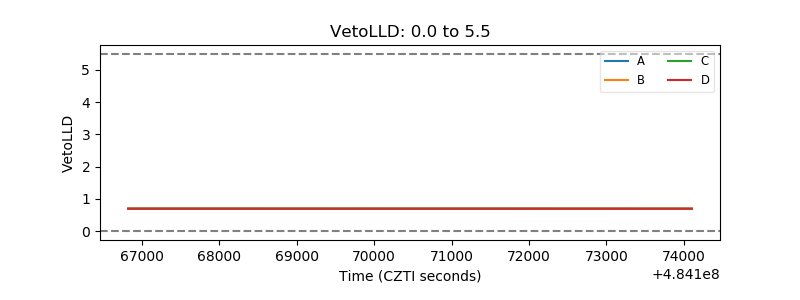 |
| Alpha Counter | 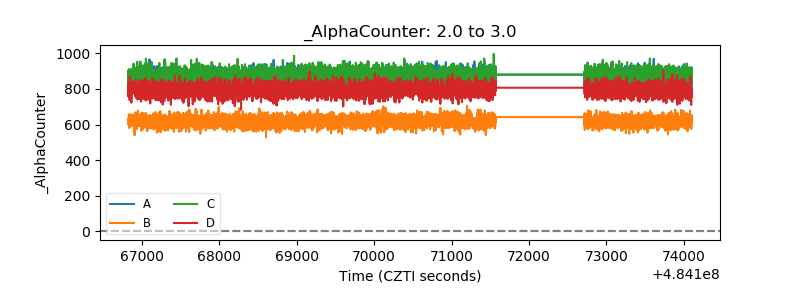 |
| _CPM_Rate | 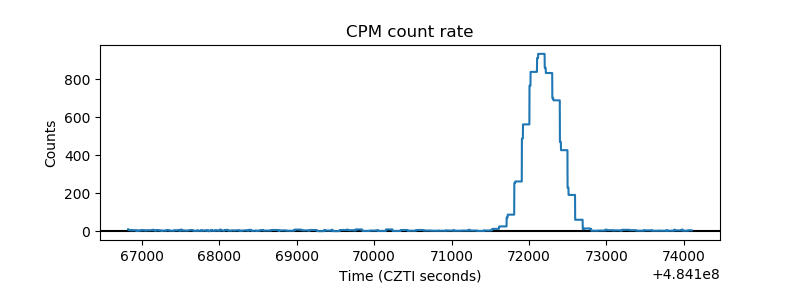 |
| CZT Counter | 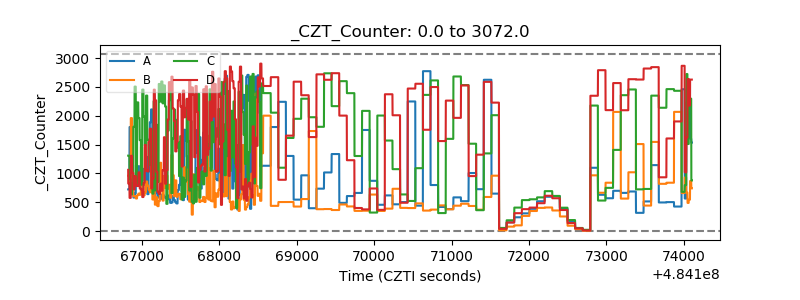 |
| +2.5 Volts monitor | 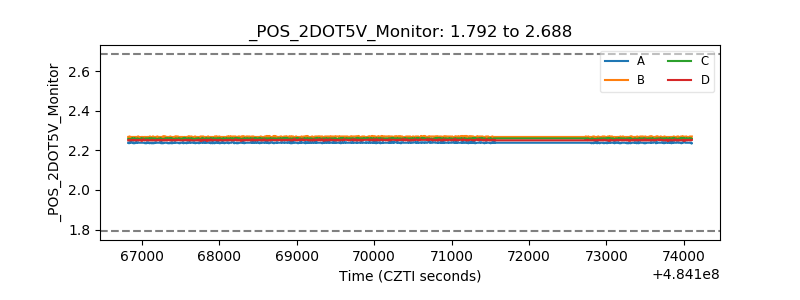 |
| +5 Volts monitor | 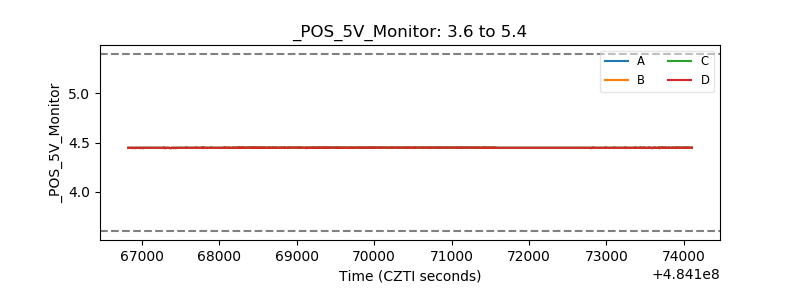 |
| _ROLL_ROT | 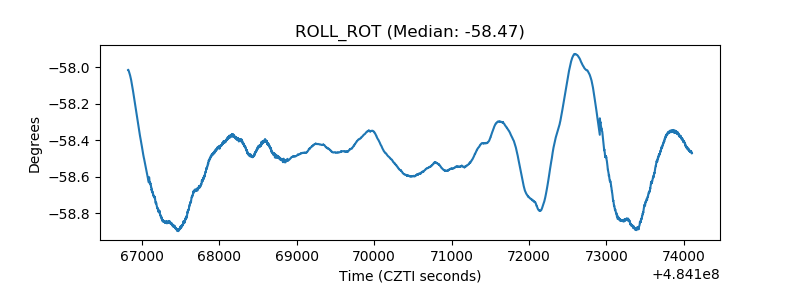 |
| _Roll_DEC | 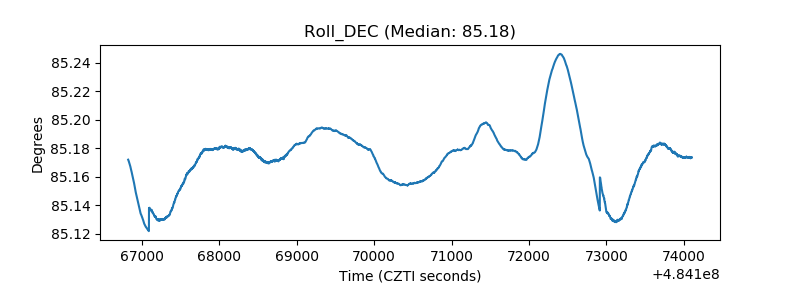 |
| _Roll_RA | 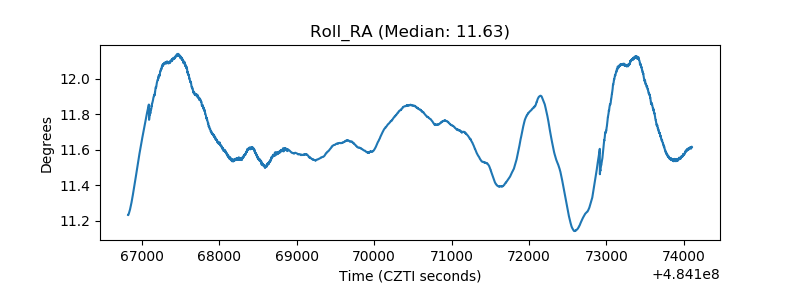 |
| Veto Counter | 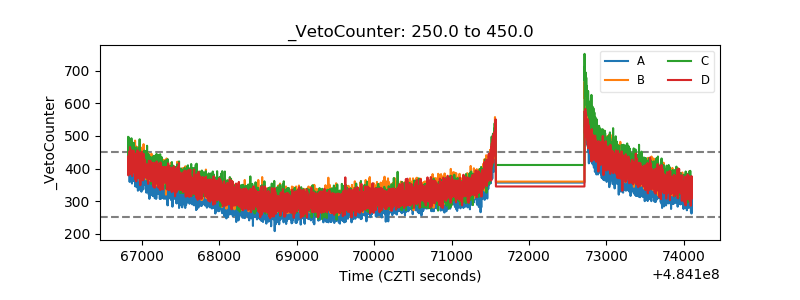 |