| Param | Original file | Final file |
|---|---|---|
| Filename | modeM0/AS1C09_011T06_9000006468_51945cztM0_level2.fits | modeM0/AS1C09_011T06_9000006468_51945cztM0_level2_quad_clean.evt |
| Size (bytes) | 897,364,800 | 67,501,440 |
| Size | 855.8 MB | 64.4 MB |
| Events in quadrant A | 7,305,839 | 466,330 |
| Events in quadrant B | 4,035,186 | 631,345 |
| Events in quadrant C | 9,189,031 | 395,149 |
| Events in quadrant D | 12,212,468 | 121,890 |
| Mode M0 | |||
|---|---|---|---|
| Quadrant | BADHDUFLAG | Total packets | Discarded packets |
| A | 0 | 25939 | 1 |
| B | 0 | 16408 | 1 |
| C | 0 | 31548 | 1 |
| D | 0 | 40475 | 1 |
| Mode M9 | |||
|---|---|---|---|
| Quadrant | BADHDUFLAG | Total packets | Discarded packets |
| A | 0 | 12 | 0 |
| B | 0 | 12 | 0 |
| C | 0 | 12 | 0 |
| D | 0 | 12 | 0 |
| Mode SS | |||
|---|---|---|---|
| Quadrant | BADHDUFLAG | Total packets | Discarded packets |
| A | 0 | 126 | 0 |
| B | 0 | 126 | 0 |
| C | 0 | 126 | 0 |
| D | 0 | 126 | 0 |
| Quadrant | Total seconds | Saturated seconds | Saturation percentage |
|---|---|---|---|
| A | 6133 | 1503 | 24.506767% |
| B | 6133 | 277 | 4.516550% |
| C | 6134 | 2377 | 38.751223% |
| D | 6134 | 4974 | 81.089012% |
Noise dominated data is calculated using 1-second bins in cleaned event files. If a bin has >2000 counts, and if more than 50% of those come from <1% of pixels, then it is considered to be noise-dominated and hence unusable.
| Quadrant | # 1 sec bins | Bins with >0 counts | Bins with >2000 counts | High rate bins dominated by noise | Noise dominated (total time) | Noise dominated (detector-on time) | Marked lightcurve |
|---|---|---|---|---|---|---|---|
| A | 7323 | 6134 | 1384 | 1384 | 18.90% | 22.56% | 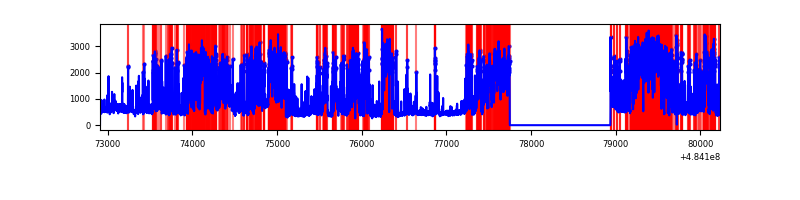 |
| B | 7323 | 6134 | 122 | 122 | 1.67% | 1.99% | 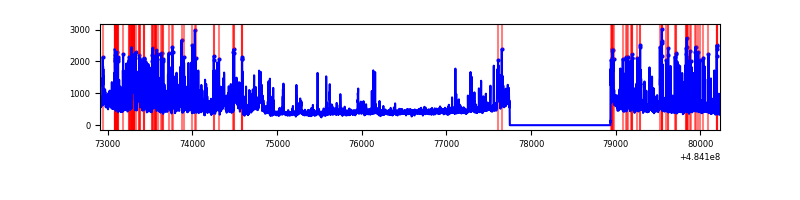 |
| C | 7324 | 6135 | 2189 | 2189 | 29.89% | 35.68% | 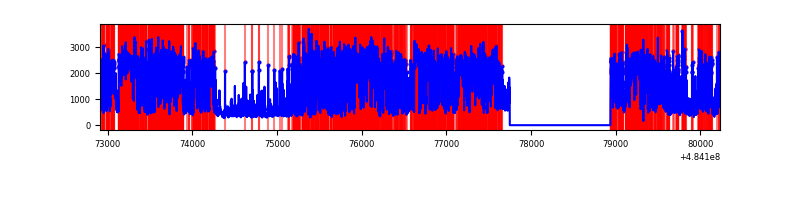 |
| D | 7324 | 6135 | 3500 | 3500 | 47.79% | 57.05% | 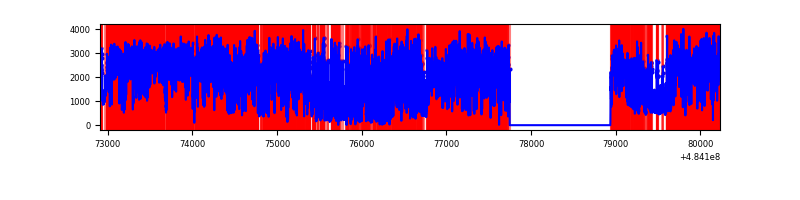 |
Top three noisy pixels from each quadrant. If the there are fewer than three noisy pixels in the level2.evt file, extra rows are filled as -1
| Pixel properties | Quadrant properties | ||||||
|---|---|---|---|---|---|---|---|
| Quadrant | DetID | PixID | Counts | Sigma | Mean | Median | Sigma |
| A | 4 | 159 | 2469831 | 17827.49 | 552 | 539 | 138.5 |
| A | 7 | 64 | 1718121 | 12400.39 | 552 | 539 | 138.5 |
| A | 12 | 3 | 441322 | 3182.31 | 552 | 539 | 138.5 |
| B | 4 | 171 | 420230 | 3114.94 | 633 | 611 | 134.7 |
| B | 12 | 32 | 181696 | 1344.24 | 633 | 611 | 134.7 |
| B | 10 | 44 | 171603 | 1269.32 | 633 | 611 | 134.7 |
| C | 15 | 224 | 6184809 | 42124.43 | 524 | 519 | 146.8 |
| C | 12 | 249 | 288242 | 1959.83 | 524 | 519 | 146.8 |
| C | 13 | 3 | 149360 | 1013.83 | 524 | 519 | 146.8 |
| D | 12 | 17 | 9055156 | 128608.86 | 240 | 229 | 70.4 |
| D | 6 | 42 | 1144949 | 16258.68 | 240 | 229 | 70.4 |
| D | 3 | 12 | 304960 | 4328.15 | 240 | 229 | 70.4 |
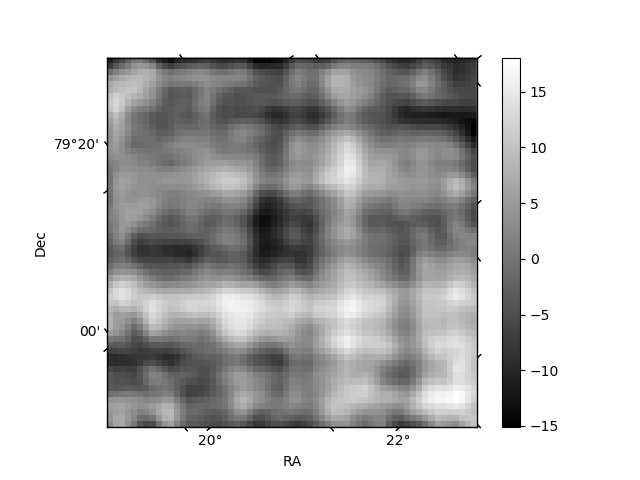
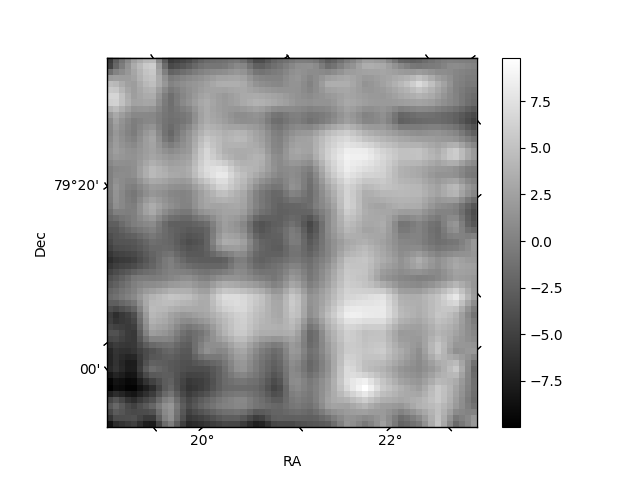
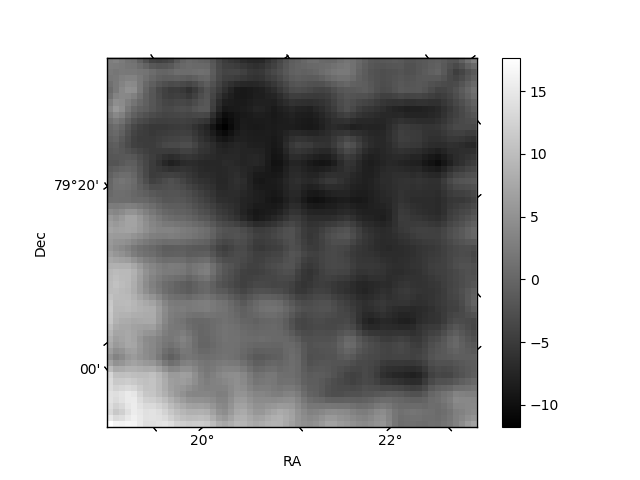
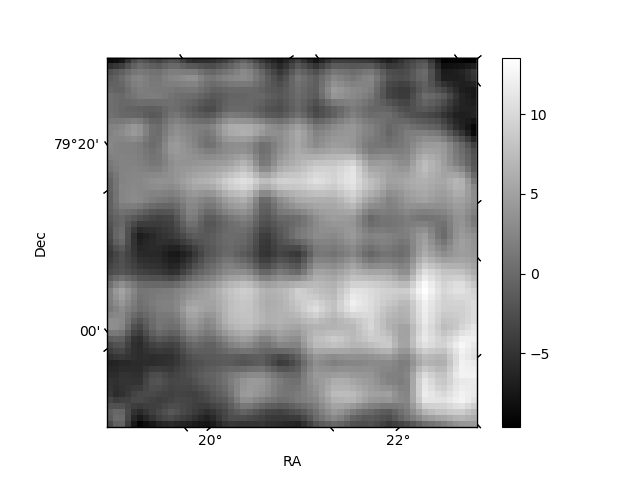
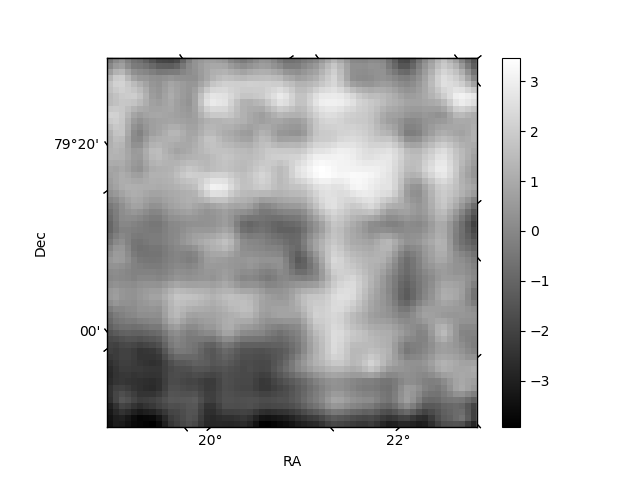
Histogram calculated using DETX and DETY for each event in the final _common_clean file
| Quadrant A | 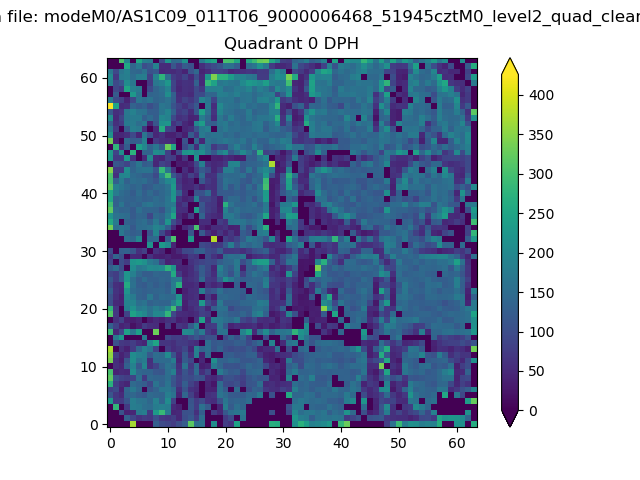 |
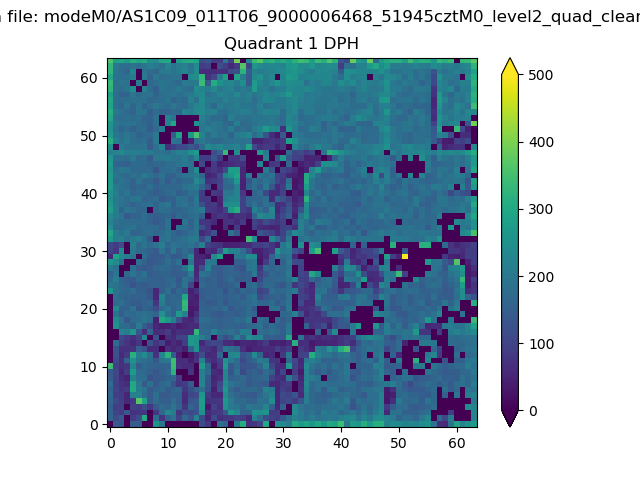 |
Quadrant B |
|---|---|---|---|
| Quadrant D | 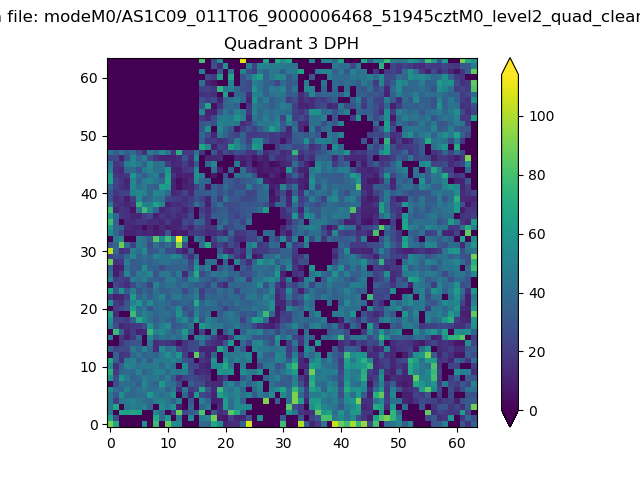 |
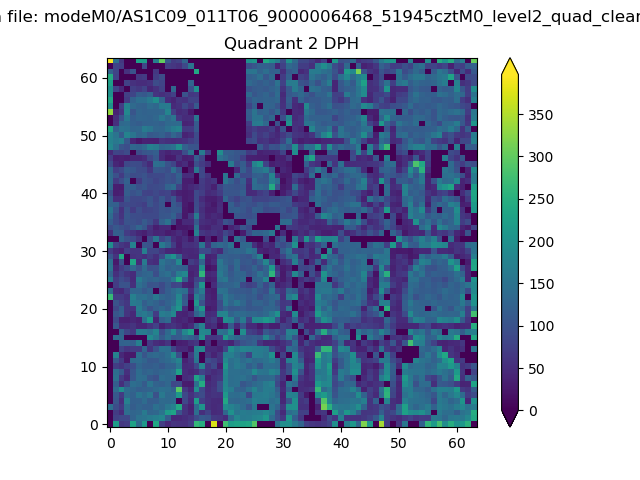 |
Quadrant C |
| Plot type | Count rate plots | Images |
|---|---|---|
| Comparison with Poisson distribution Blue bars denote a histogram of data divided into 1 sec bins. Red curve is a Poisson curve with rate = median count rate of data. |
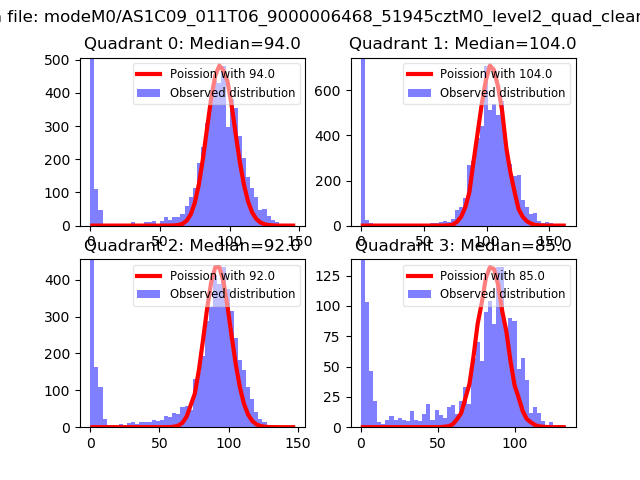 |
 |
| Quadrant-wise count rates Data is divided into 100 sec bins |
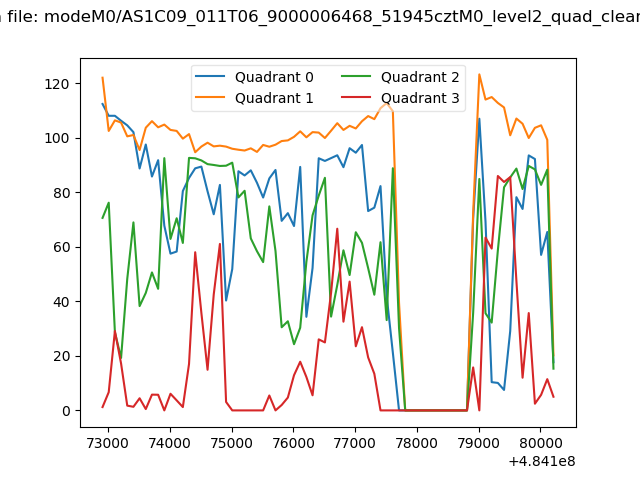 |
|
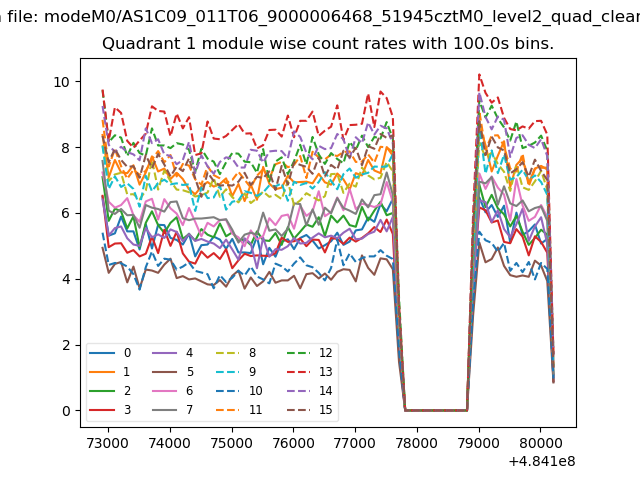
| Module-wise count rates for Quadrant A Data is divided into 100 sec bins |
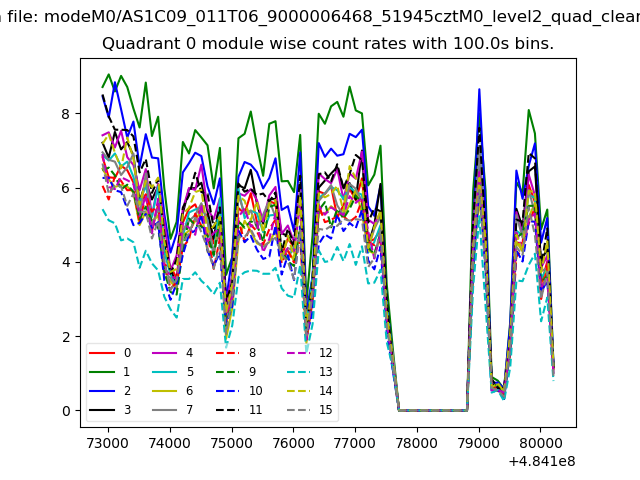 |
 |
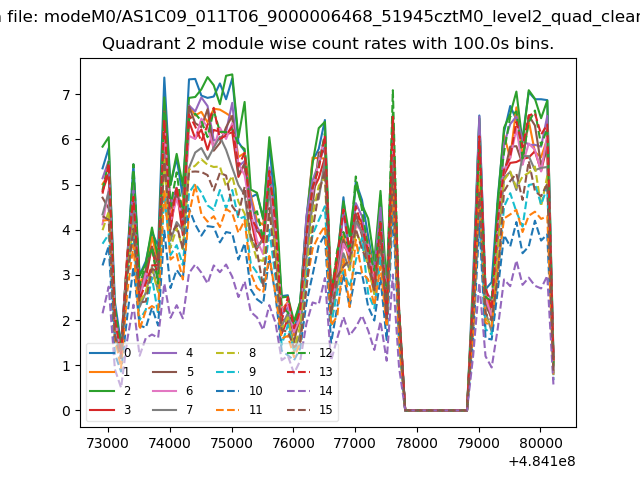
| Module-wise count rates for Quadrant B Data is divided into 100 sec bins |
 |
 |
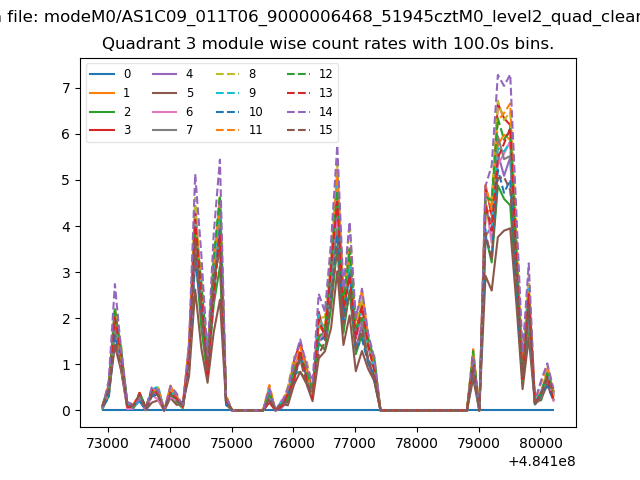
| Module-wise count rates for Quadrant C Data is divided into 100 sec bins |
 |
 |
| Module-wise count rates for Quadrant D Data is divided into 100 sec bins |
 |
 |
| Parameter | Plot |
|---|---|
| CZT HV Monitor |  |
| D_VDD | 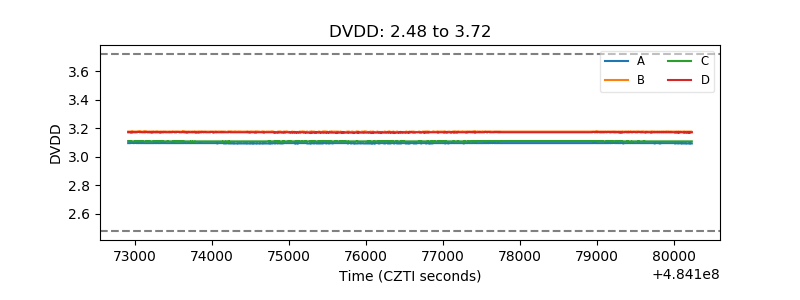 |
| Temperature 1 | 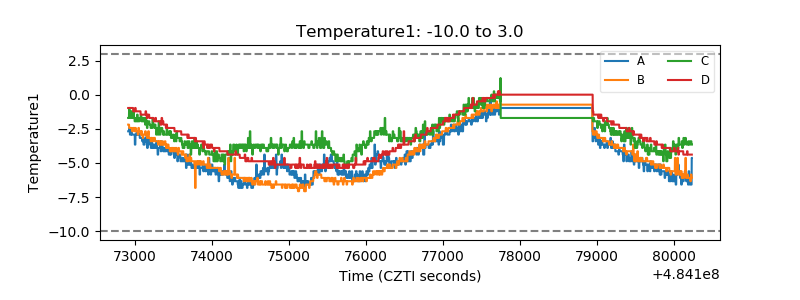 |
| Veto HV Monitor | 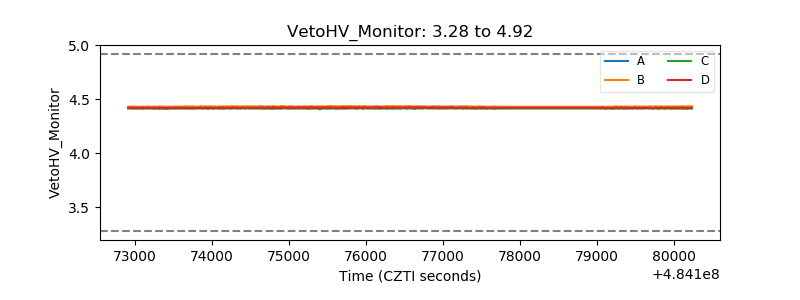 |
| Veto LLD | 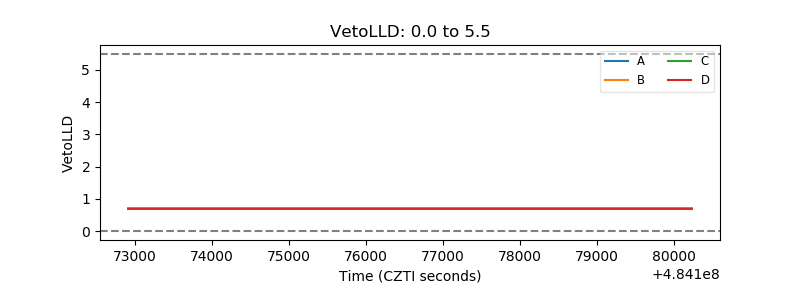 |
| Alpha Counter | 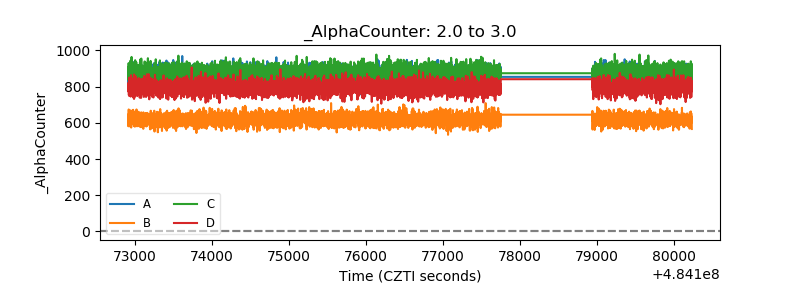 |
| _CPM_Rate | 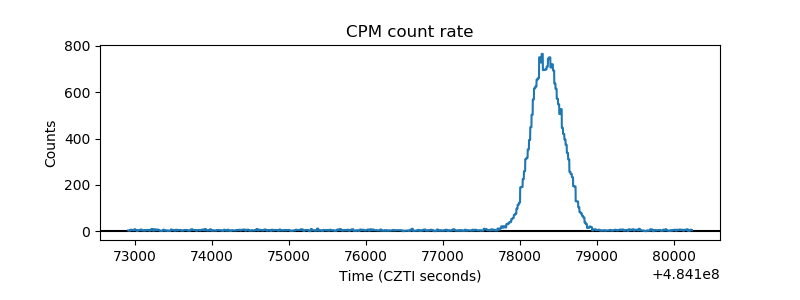 |
| CZT Counter | 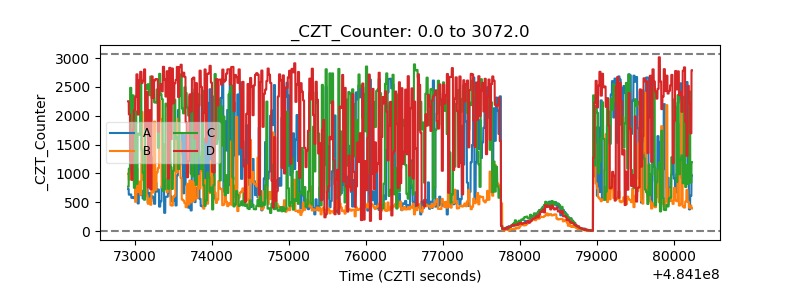 |
| +2.5 Volts monitor | 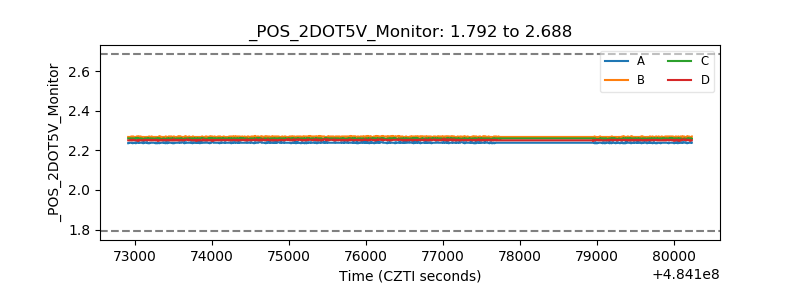 |
| +5 Volts monitor | 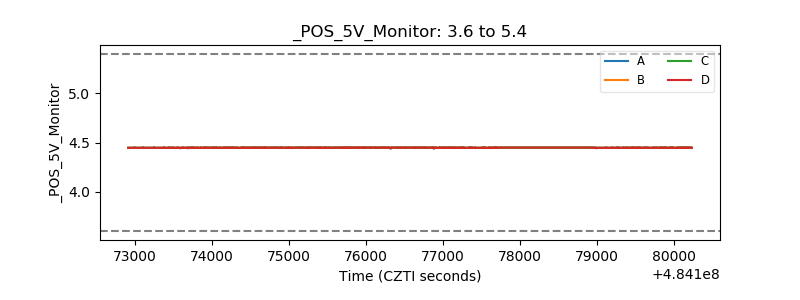 |
| _ROLL_ROT | 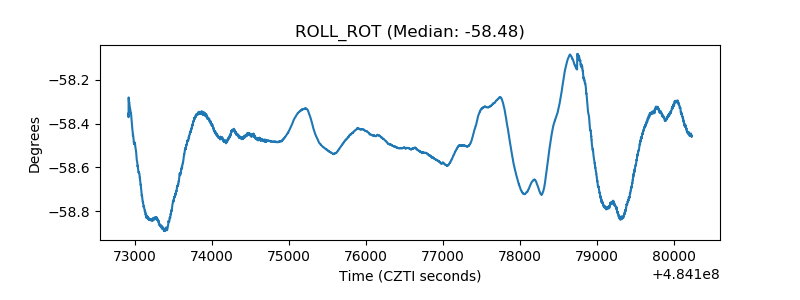 |
| _Roll_DEC | 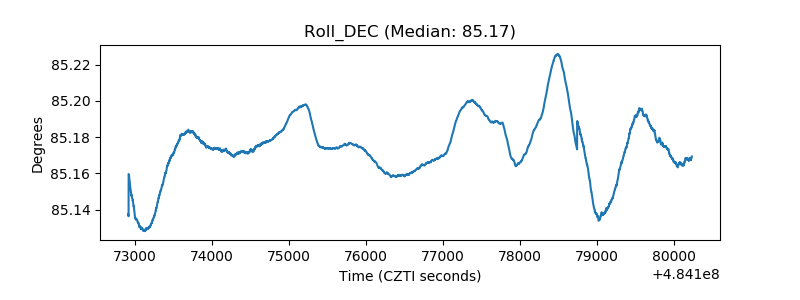 |
| _Roll_RA | 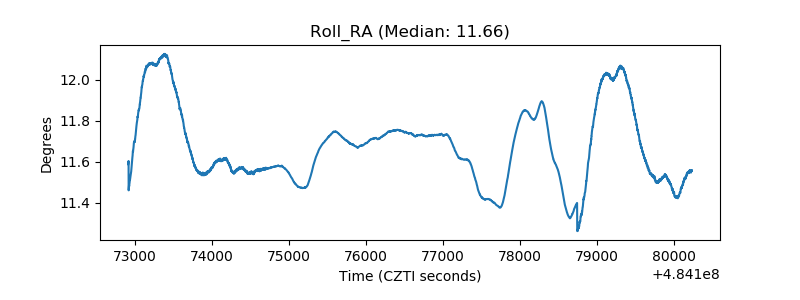 |
| Veto Counter | 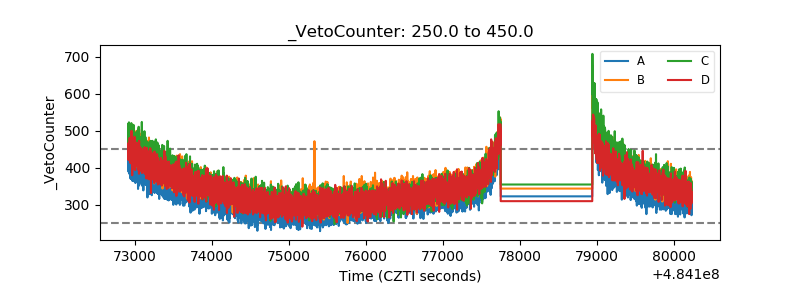 |