| Param | Original file | Final file |
|---|---|---|
| Filename | modeM0/AS1C09_011T06_9000006468_51946cztM0_level2.fits | modeM0/AS1C09_011T06_9000006468_51946cztM0_level2_quad_clean.evt |
| Size (bytes) | 924,215,040 | 70,954,560 |
| Size | 881.4 MB | 67.7 MB |
| Events in quadrant A | 8,530,442 | 451,026 |
| Events in quadrant B | 3,788,798 | 659,665 |
| Events in quadrant C | 8,798,515 | 465,012 |
| Events in quadrant D | 12,590,695 | 118,661 |
| Mode M0 | |||
|---|---|---|---|
| Quadrant | BADHDUFLAG | Total packets | Discarded packets |
| A | 0 | 29855 | 4 |
| B | 0 | 15882 | 2 |
| C | 0 | 30601 | 2 |
| D | 0 | 41846 | 2 |
| Mode M9 | |||
|---|---|---|---|
| Quadrant | BADHDUFLAG | Total packets | Discarded packets |
| A | 0 | 10 | 0 |
| B | 0 | 10 | 0 |
| C | 0 | 10 | 0 |
| D | 0 | 10 | 0 |
| Mode SS | |||
|---|---|---|---|
| Quadrant | BADHDUFLAG | Total packets | Discarded packets |
| A | 0 | 134 | 0 |
| B | 0 | 134 | 0 |
| C | 0 | 134 | 0 |
| D | 0 | 134 | 0 |
| Quadrant | Total seconds | Saturated seconds | Saturation percentage |
|---|---|---|---|
| A | 6493 | 1925 | 29.647312% |
| B | 6494 | 214 | 3.295350% |
| C | 6494 | 1913 | 29.457961% |
| D | 6494 | 5383 | 82.891900% |
Noise dominated data is calculated using 1-second bins in cleaned event files. If a bin has >2000 counts, and if more than 50% of those come from <1% of pixels, then it is considered to be noise-dominated and hence unusable.
| Quadrant | # 1 sec bins | Bins with >0 counts | Bins with >2000 counts | High rate bins dominated by noise | Noise dominated (total time) | Noise dominated (detector-on time) | Marked lightcurve |
|---|---|---|---|---|---|---|---|
| A | 7568 | 6494 | 1715 | 1715 | 22.66% | 26.41% | 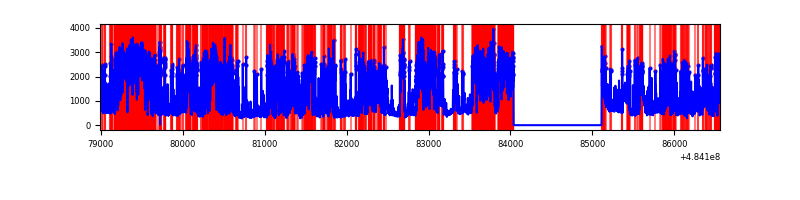 |
| B | 7569 | 6495 | 82 | 82 | 1.08% | 1.26% | 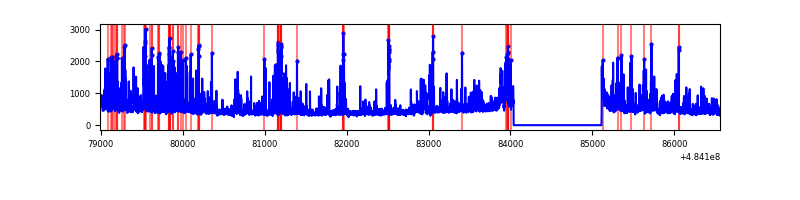 |
| C | 7569 | 6495 | 1742 | 1742 | 23.01% | 26.82% | 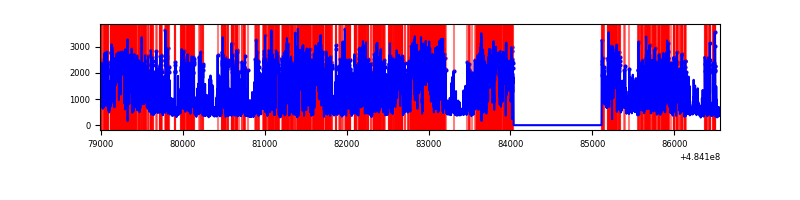 |
| D | 7569 | 6495 | 3598 | 3598 | 47.54% | 55.40% | 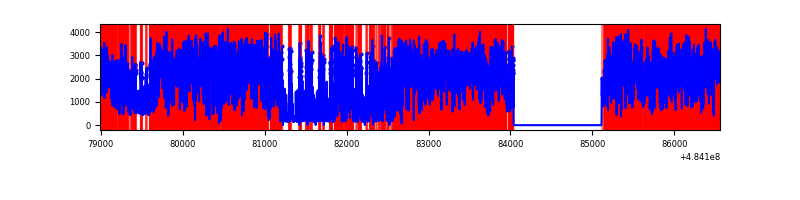 |
Top three noisy pixels from each quadrant. If the there are fewer than three noisy pixels in the level2.evt file, extra rows are filled as -1
| Pixel properties | Quadrant properties | ||||||
|---|---|---|---|---|---|---|---|
| Quadrant | DetID | PixID | Counts | Sigma | Mean | Median | Sigma |
| A | 4 | 159 | 3231563 | 23214.72 | 552 | 538 | 139.2 |
| A | 7 | 64 | 2040934 | 14660.13 | 552 | 538 | 139.2 |
| A | 4 | 249 | 241678 | 1732.58 | 552 | 538 | 139.2 |
| B | 12 | 32 | 195267 | 1375.28 | 670 | 645 | 141.5 |
| B | 0 | 216 | 153924 | 1083.13 | 670 | 645 | 141.5 |
| B | 4 | 206 | 128524 | 903.64 | 670 | 645 | 141.5 |
| C | 15 | 224 | 5526229 | 33702.1 | 578 | 572 | 164.0 |
| C | 15 | 147 | 323774 | 1971.27 | 578 | 572 | 164.0 |
| C | 13 | 3 | 149939 | 911.02 | 578 | 572 | 164.0 |
| D | 12 | 17 | 8615942 | 112289.94 | 262 | 248 | 76.7 |
| D | 6 | 42 | 2082490 | 27138.25 | 262 | 248 | 76.7 |
| D | 3 | 12 | 341842 | 4452.06 | 262 | 248 | 76.7 |
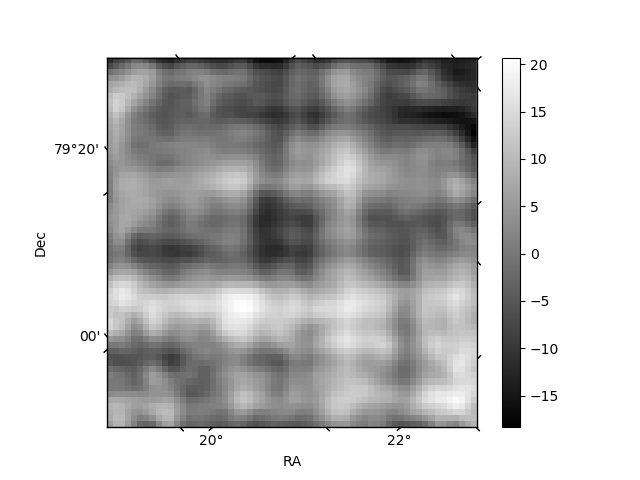
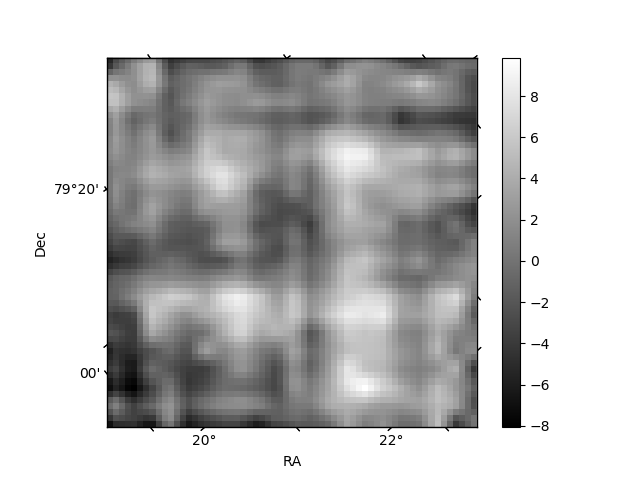
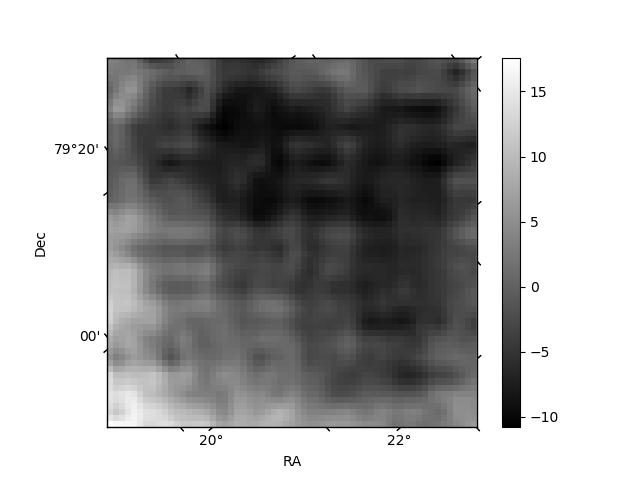
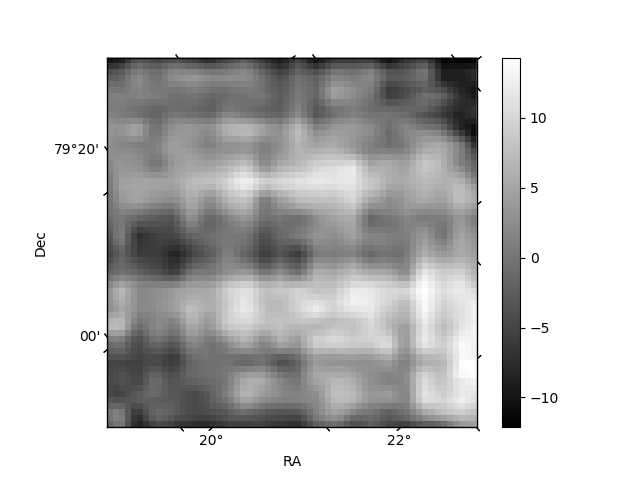
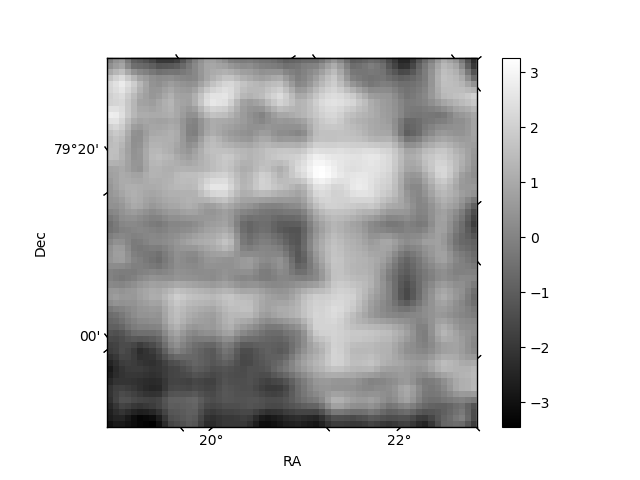
Histogram calculated using DETX and DETY for each event in the final _common_clean file
| Quadrant A | 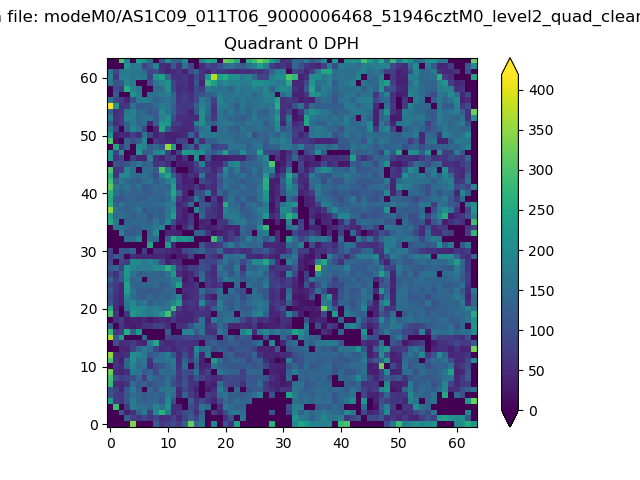 |
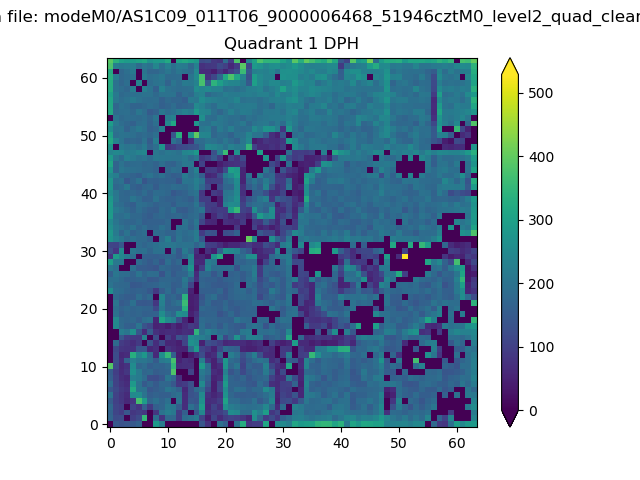 |
Quadrant B |
|---|---|---|---|
| Quadrant D | 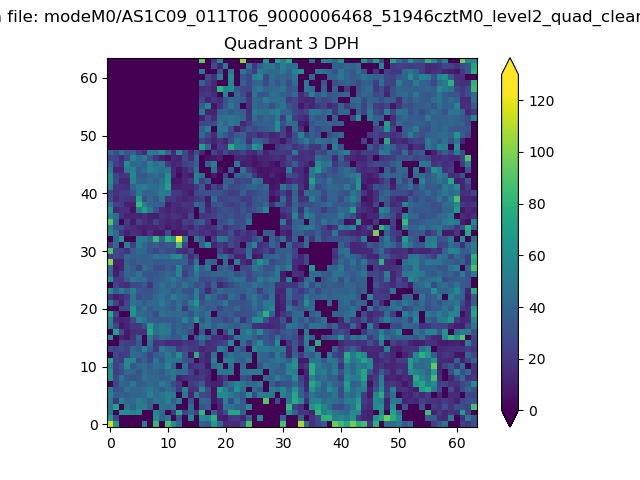 |
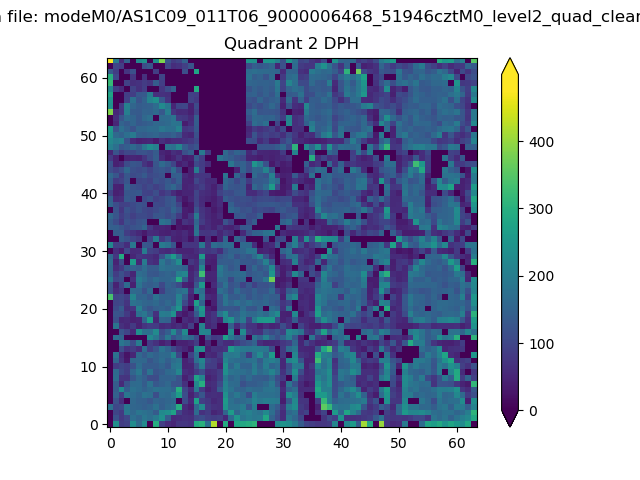 |
Quadrant C |
| Plot type | Count rate plots | Images |
|---|---|---|
| Comparison with Poisson distribution Blue bars denote a histogram of data divided into 1 sec bins. Red curve is a Poisson curve with rate = median count rate of data. |
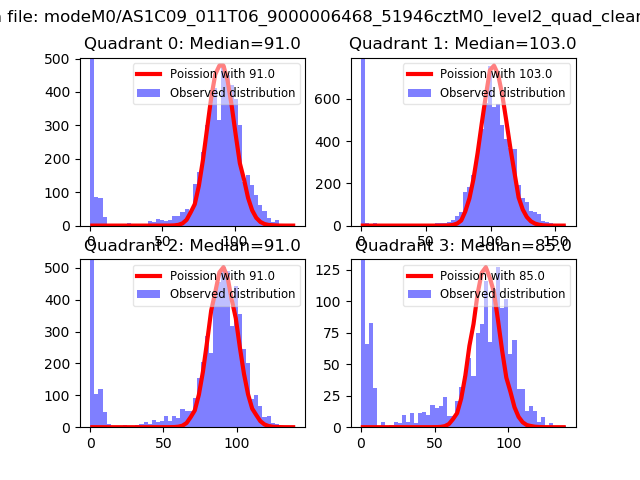 |
 |
| Quadrant-wise count rates Data is divided into 100 sec bins |
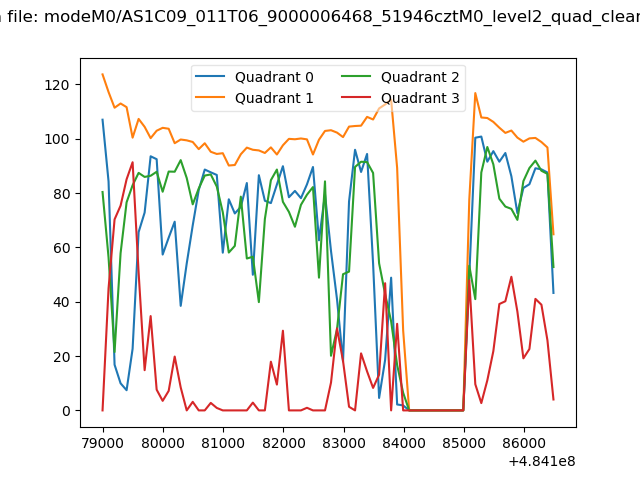 |
|
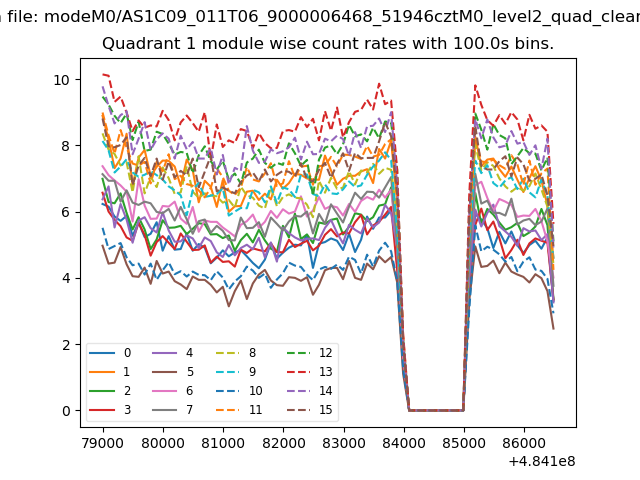
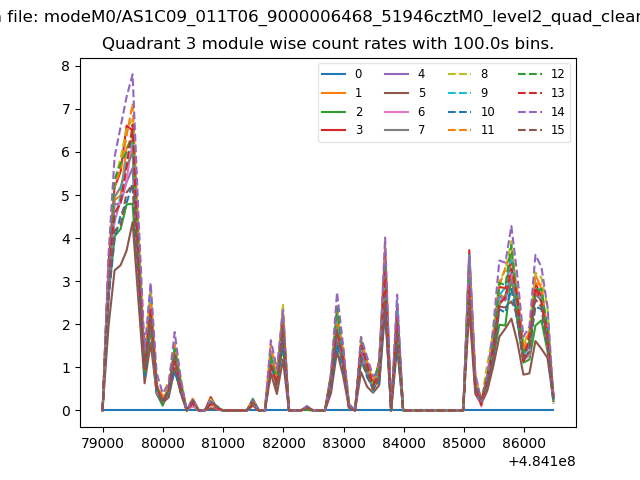
| Module-wise count rates for Quadrant A Data is divided into 100 sec bins |
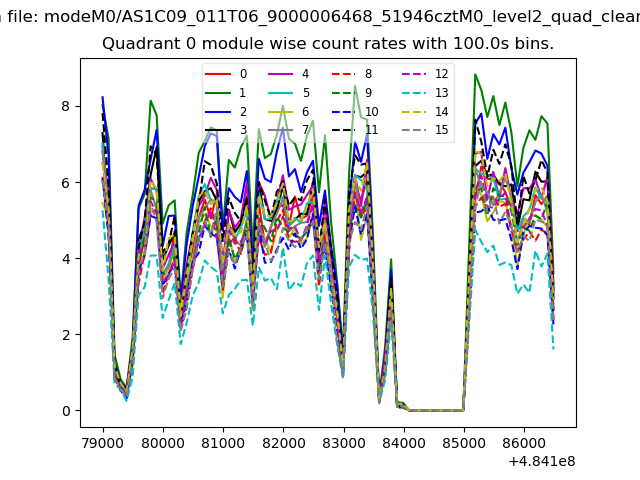 |
 |
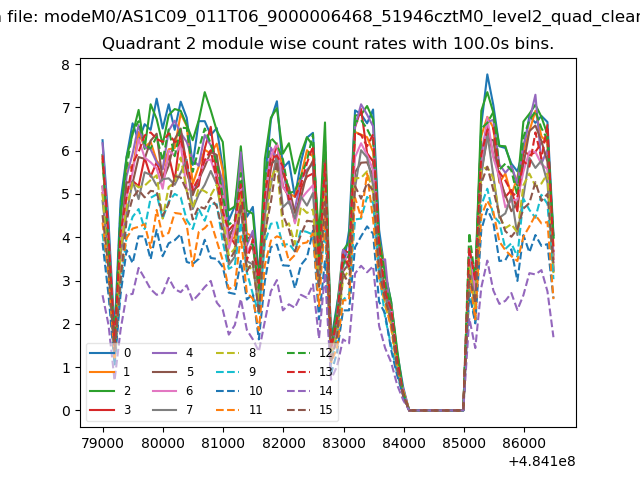
| Module-wise count rates for Quadrant B Data is divided into 100 sec bins |
 |
 |
| Module-wise count rates for Quadrant C Data is divided into 100 sec bins |
 |
 |
| Module-wise count rates for Quadrant D Data is divided into 100 sec bins |
 |
 |
| Parameter | Plot |
|---|---|
| CZT HV Monitor | 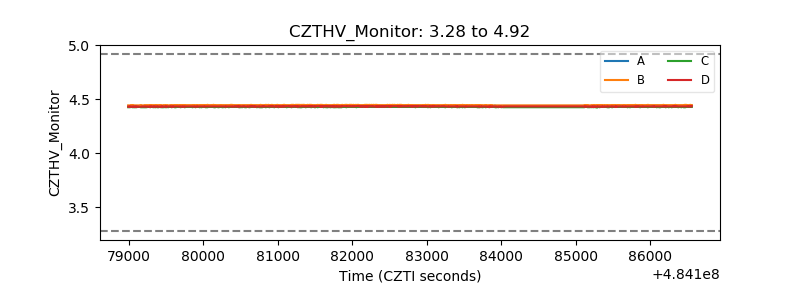 |
| D_VDD | 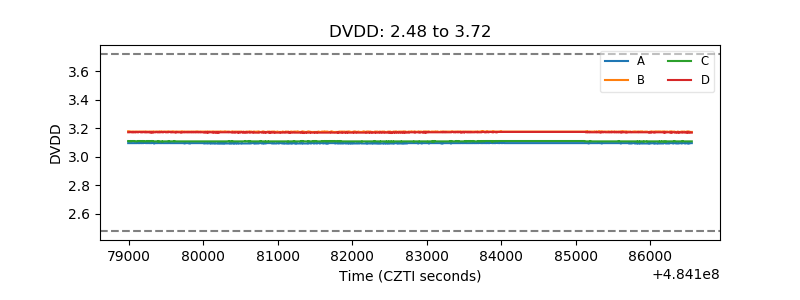 |
| Temperature 1 | 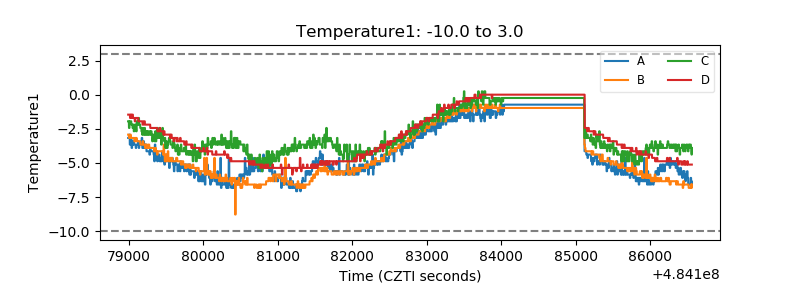 |
| Veto HV Monitor | 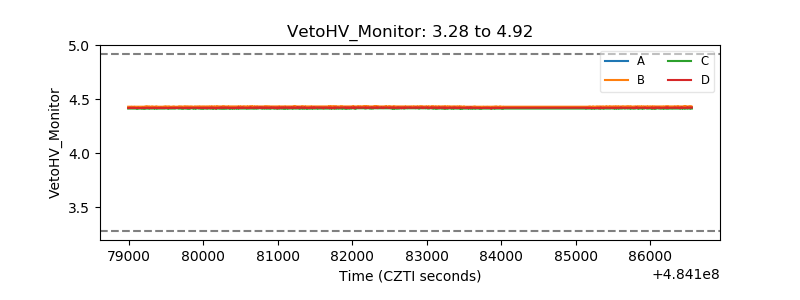 |
| Veto LLD | 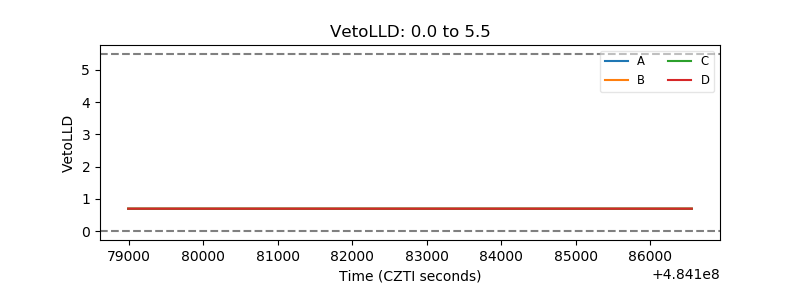 |
| Alpha Counter | 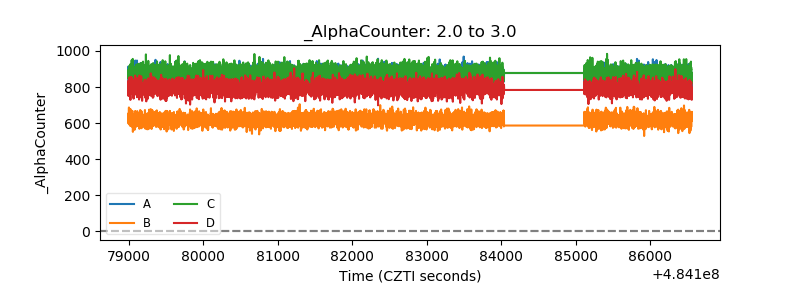 |
| _CPM_Rate | 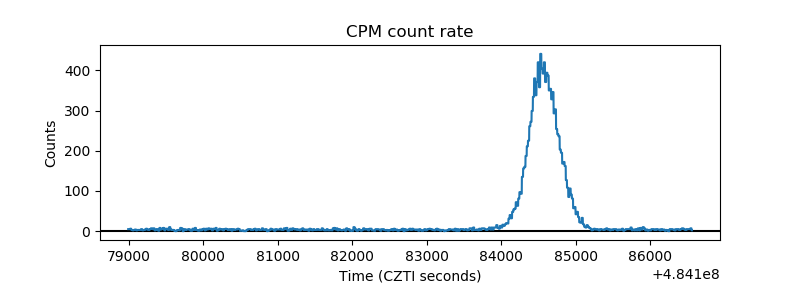 |
| CZT Counter | 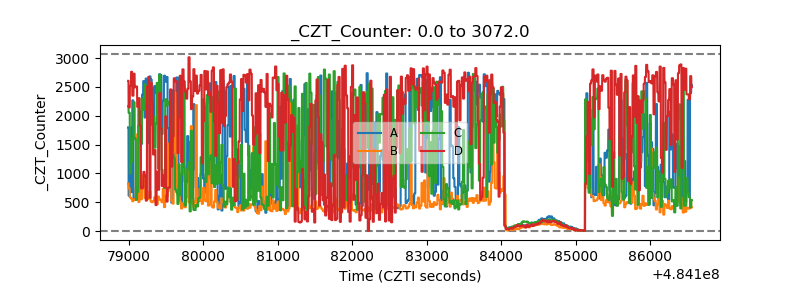 |
| +2.5 Volts monitor | 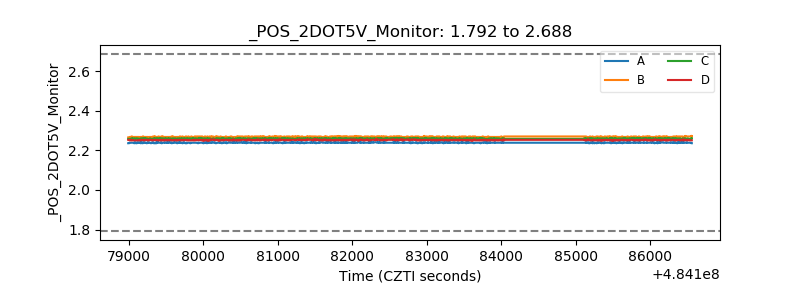 |
| +5 Volts monitor | 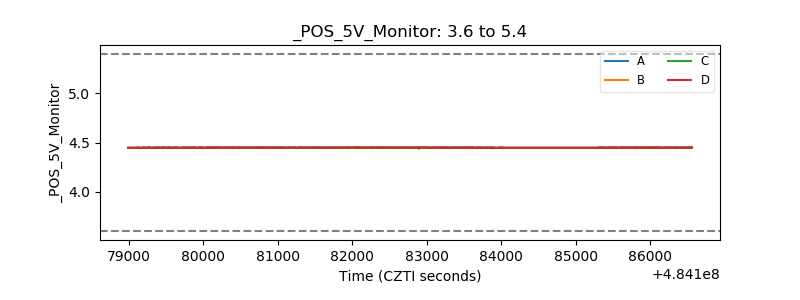 |
| _ROLL_ROT | 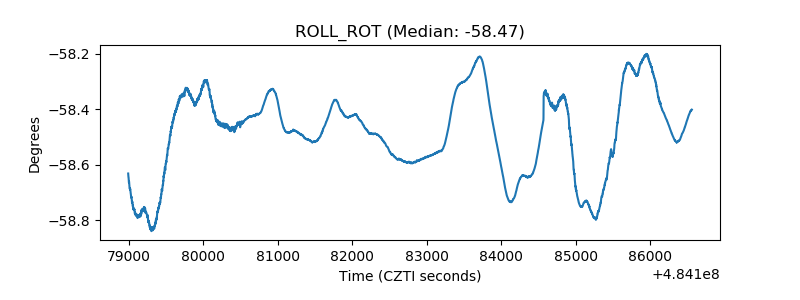 |
| _Roll_DEC | 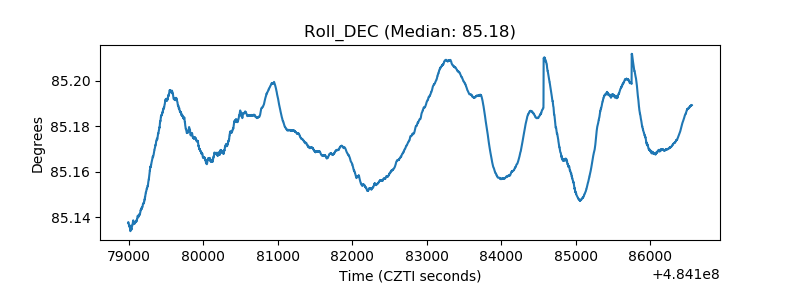 |
| _Roll_RA | 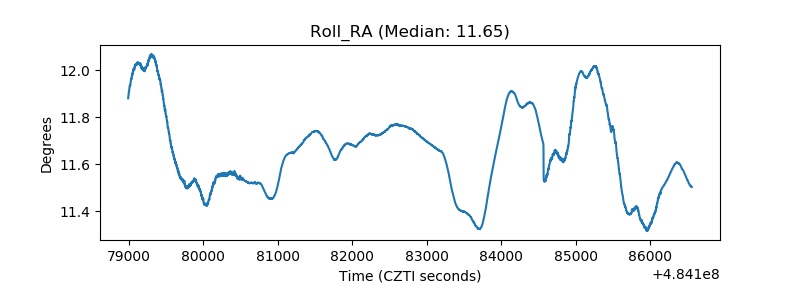 |
| Veto Counter | 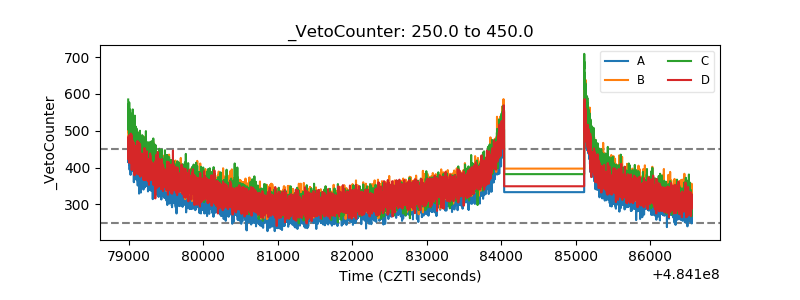 |