| Param | Original file | Final file |
|---|---|---|
| Filename | modeM0/AS1C09_011T06_9000006468_51948cztM0_level2.fits | modeM0/AS1C09_011T06_9000006468_51948cztM0_level2_quad_clean.evt |
| Size (bytes) | 899,081,280 | 78,022,080 |
| Size | 857.4 MB | 74.4 MB |
| Events in quadrant A | 7,558,757 | 499,797 |
| Events in quadrant B | 3,982,856 | 655,099 |
| Events in quadrant C | 9,066,428 | 439,993 |
| Events in quadrant D | 12,154,035 | 298,710 |
| Mode M0 | |||
|---|---|---|---|
| Quadrant | BADHDUFLAG | Total packets | Discarded packets |
| A | 0 | 27186 | 1 |
| B | 0 | 16690 | 1 |
| C | 0 | 31654 | 1 |
| D | 0 | 40781 | 7 |
| Mode M9 | |||
|---|---|---|---|
| Quadrant | BADHDUFLAG | Total packets | Discarded packets |
| A | 0 | 5 | 0 |
| B | 0 | 5 | 0 |
| C | 0 | 5 | 0 |
| D | 0 | 5 | 0 |
| Mode SS | |||
|---|---|---|---|
| Quadrant | BADHDUFLAG | Total packets | Discarded packets |
| A | 0 | 138 | 0 |
| B | 0 | 138 | 0 |
| C | 0 | 138 | 0 |
| D | 0 | 138 | 0 |
| Quadrant | Total seconds | Saturated seconds | Saturation percentage |
|---|---|---|---|
| A | 6710 | 1475 | 21.982116% |
| B | 6710 | 235 | 3.502235% |
| C | 6711 | 2139 | 31.873044% |
| D | 6710 | 3487 | 51.967213% |
Noise dominated data is calculated using 1-second bins in cleaned event files. If a bin has >2000 counts, and if more than 50% of those come from <1% of pixels, then it is considered to be noise-dominated and hence unusable.
| Quadrant | # 1 sec bins | Bins with >0 counts | Bins with >2000 counts | High rate bins dominated by noise | Noise dominated (total time) | Noise dominated (detector-on time) | Marked lightcurve |
|---|---|---|---|---|---|---|---|
| A | 7230 | 6711 | 1280 | 1280 | 17.70% | 19.07% | 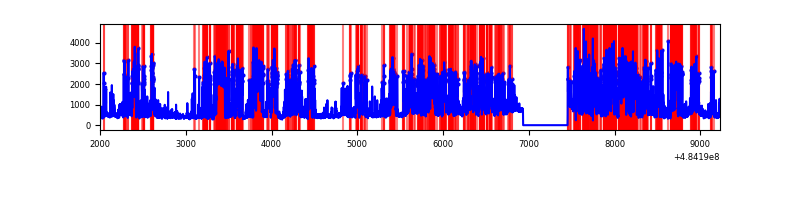 |
| B | 7230 | 6711 | 108 | 108 | 1.49% | 1.61% | 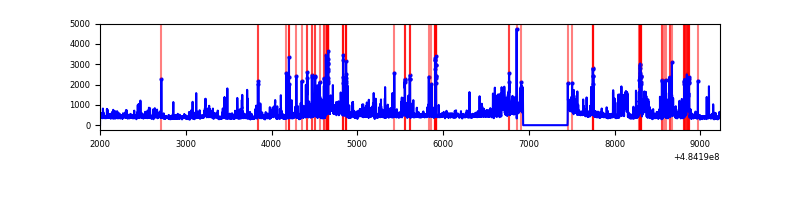 |
| C | 7231 | 6711 | 1703 | 1703 | 23.55% | 25.38% |  |
| D | 7230 | 6711 | 3062 | 3062 | 42.35% | 45.63% | 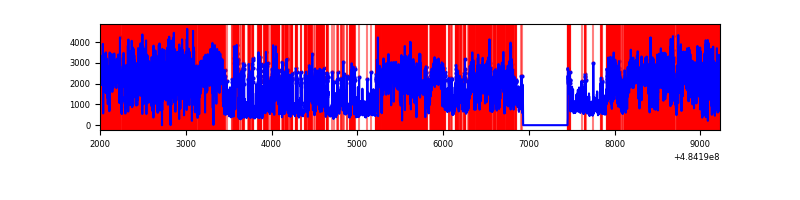 |
Top three noisy pixels from each quadrant. If the there are fewer than three noisy pixels in the level2.evt file, extra rows are filled as -1
| Pixel properties | Quadrant properties | ||||||
|---|---|---|---|---|---|---|---|
| Quadrant | DetID | PixID | Counts | Sigma | Mean | Median | Sigma |
| A | 4 | 159 | 3057518 | 19454.28 | 611 | 595 | 157.1 |
| A | 7 | 64 | 1133318 | 7208.66 | 611 | 595 | 157.1 |
| A | 13 | 248 | 170196 | 1079.34 | 611 | 595 | 157.1 |
| B | 8 | 3 | 158471 | 1109.8 | 672 | 650 | 142.2 |
| B | 4 | 171 | 141958 | 993.68 | 672 | 650 | 142.2 |
| B | 10 | 254 | 139809 | 978.57 | 672 | 650 | 142.2 |
| C | 15 | 224 | 6144989 | 39127.85 | 561 | 554 | 157.0 |
| C | 13 | 3 | 203671 | 1293.45 | 561 | 554 | 157.0 |
| C | 15 | 147 | 134158 | 850.79 | 561 | 554 | 157.0 |
| D | 12 | 17 | 5129364 | 37477.36 | 473 | 450 | 136.9 |
| D | 6 | 42 | 2522686 | 18430.17 | 473 | 450 | 136.9 |
| D | 12 | 16 | 1588681 | 11605.32 | 473 | 450 | 136.9 |
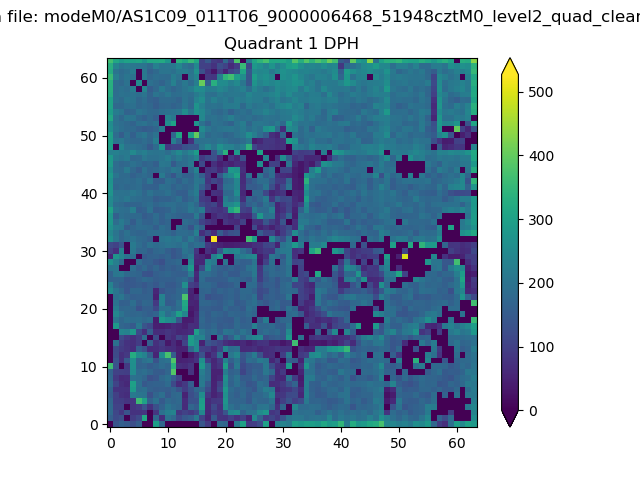
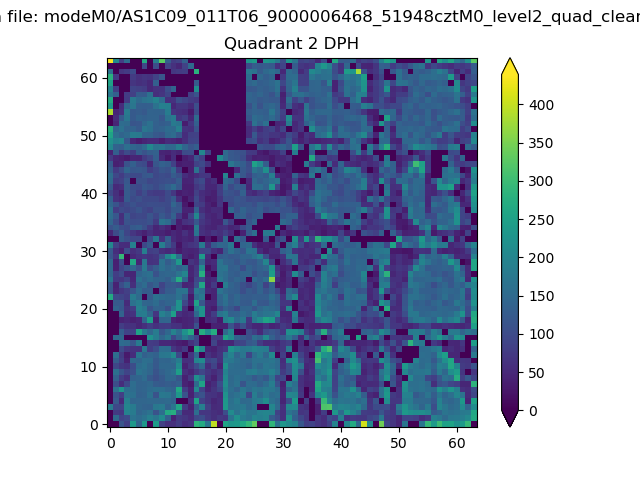
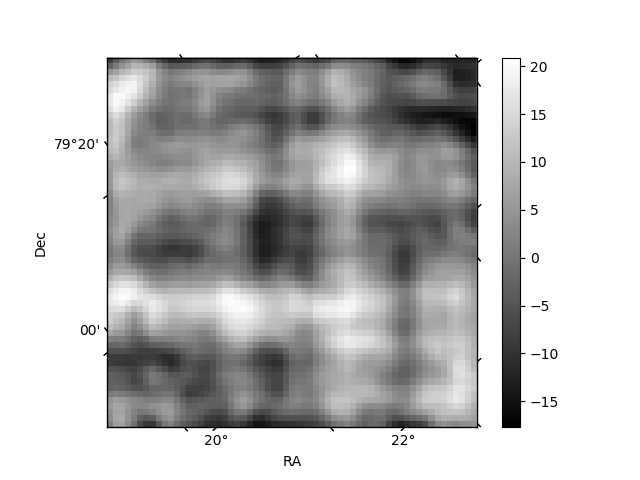
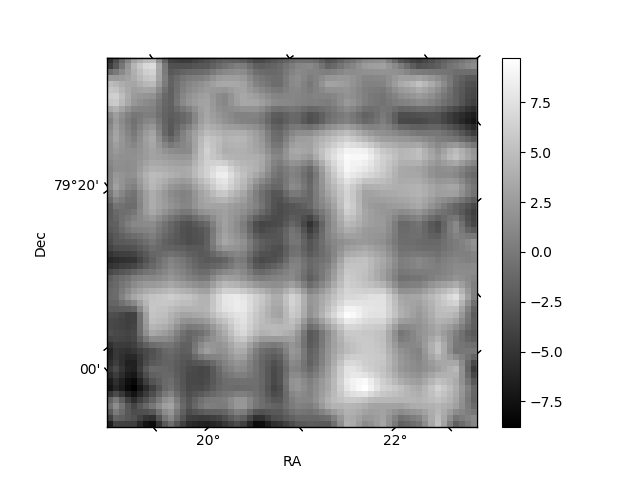
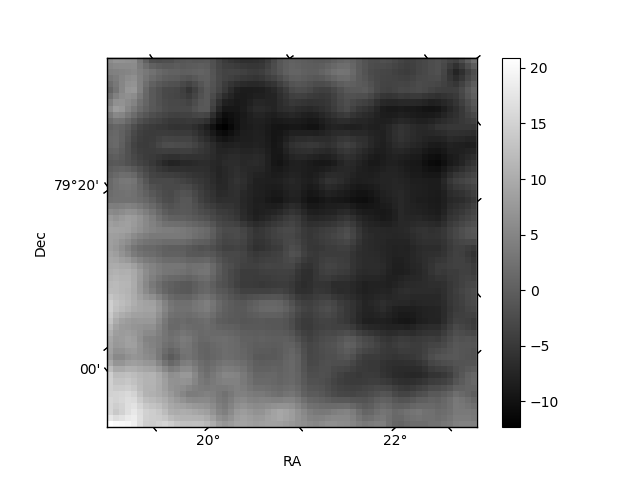
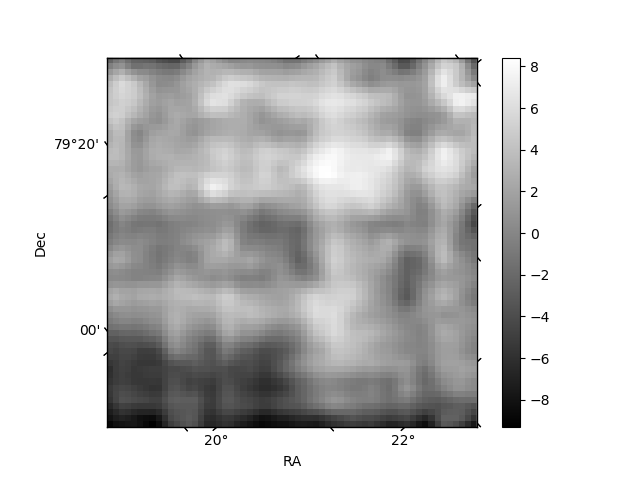
Histogram calculated using DETX and DETY for each event in the final _common_clean file
| Quadrant A | 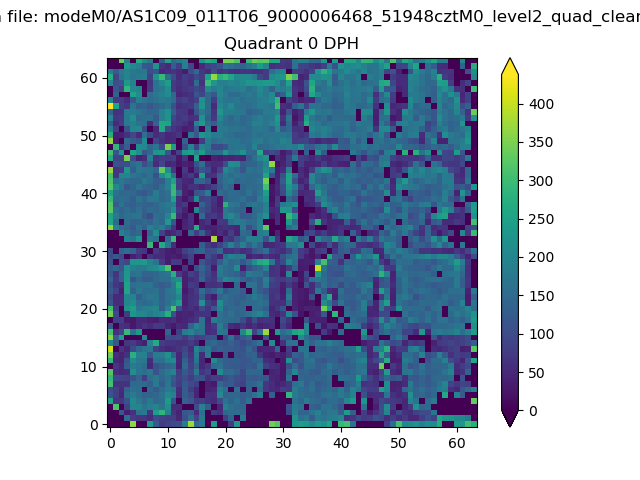 |
 |
Quadrant B |
|---|---|---|---|
| Quadrant D | 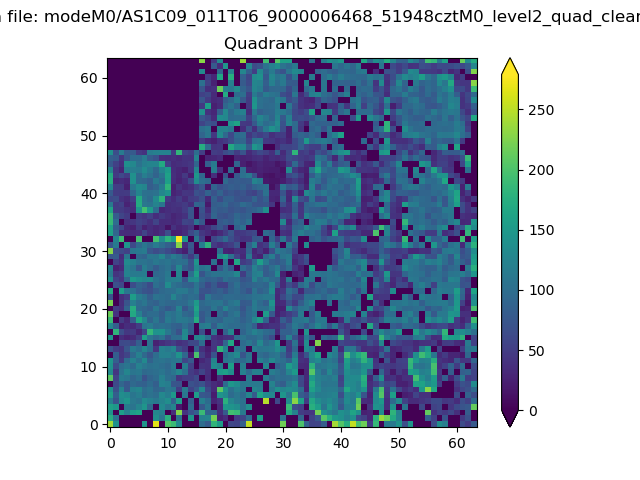 |
 |
Quadrant C |
| Plot type | Count rate plots | Images |
|---|---|---|
| Comparison with Poisson distribution Blue bars denote a histogram of data divided into 1 sec bins. Red curve is a Poisson curve with rate = median count rate of data. |
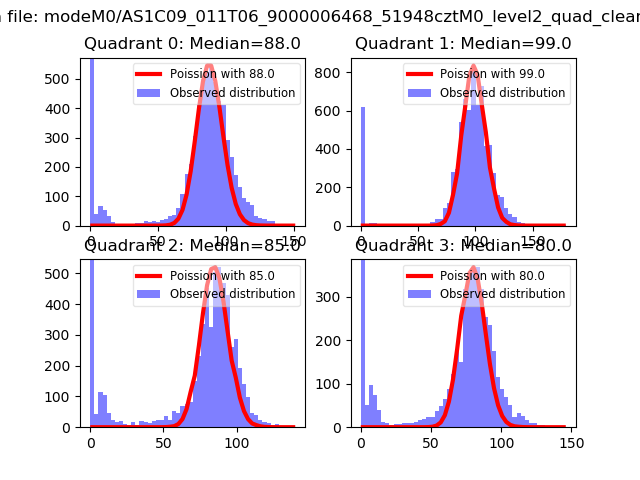 |
 |
| Quadrant-wise count rates Data is divided into 100 sec bins |
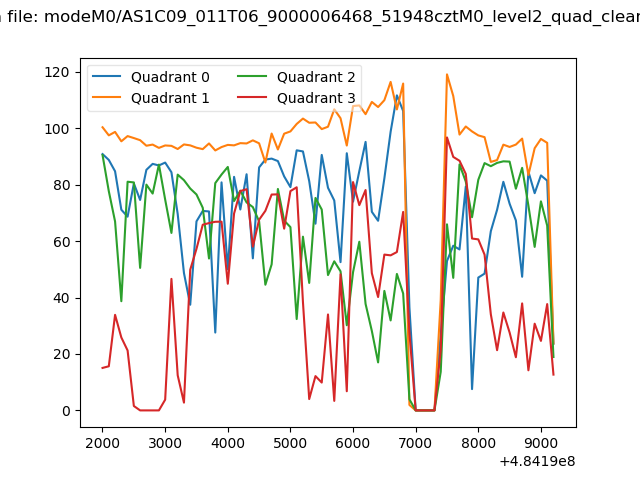 |
|
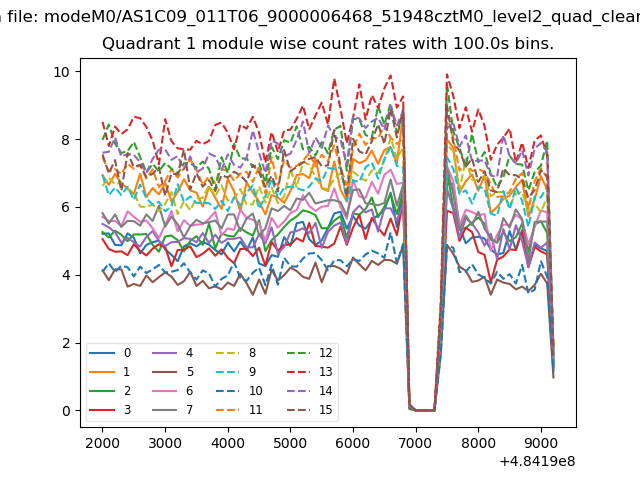
| Module-wise count rates for Quadrant A Data is divided into 100 sec bins |
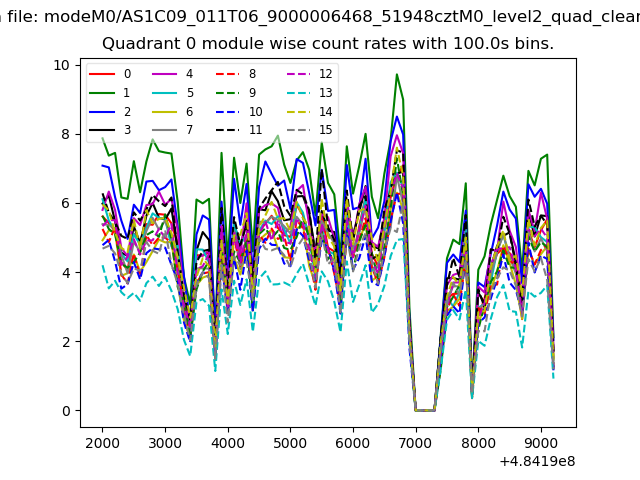 |
 |
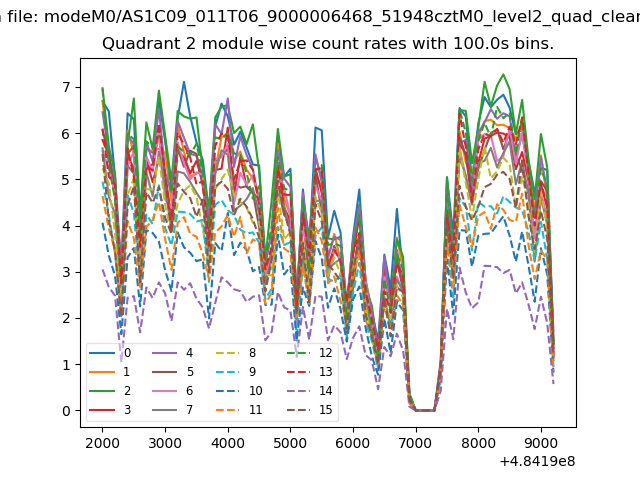
| Module-wise count rates for Quadrant B Data is divided into 100 sec bins |
 |
 |
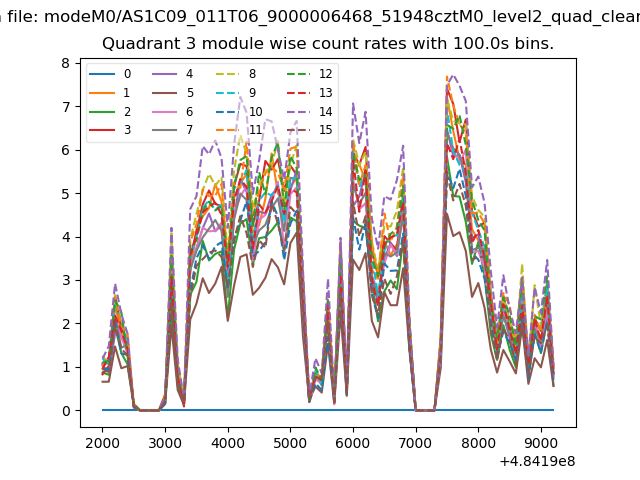
| Module-wise count rates for Quadrant C Data is divided into 100 sec bins |
 |
 |
| Module-wise count rates for Quadrant D Data is divided into 100 sec bins |
 |
 |
| Parameter | Plot |
|---|---|
| CZT HV Monitor | 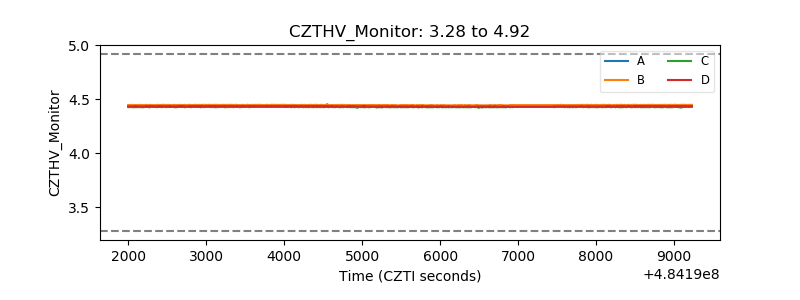 |
| D_VDD | 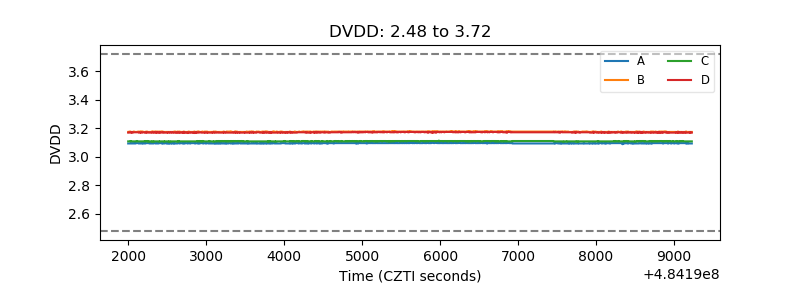 |
| Temperature 1 | 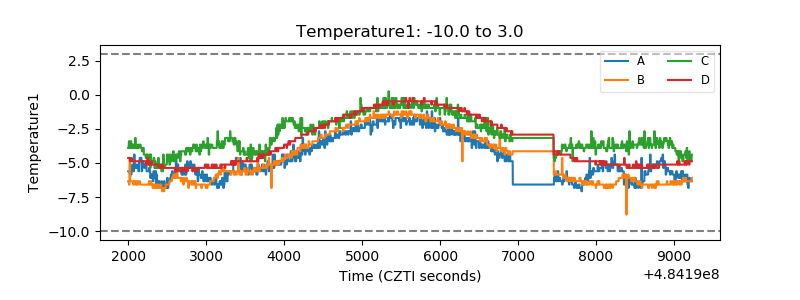 |
| Veto HV Monitor | 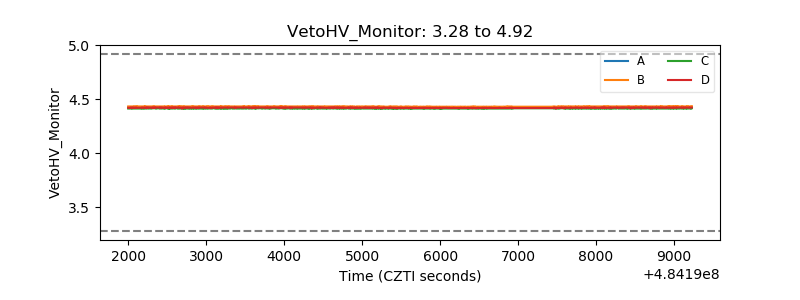 |
| Veto LLD | 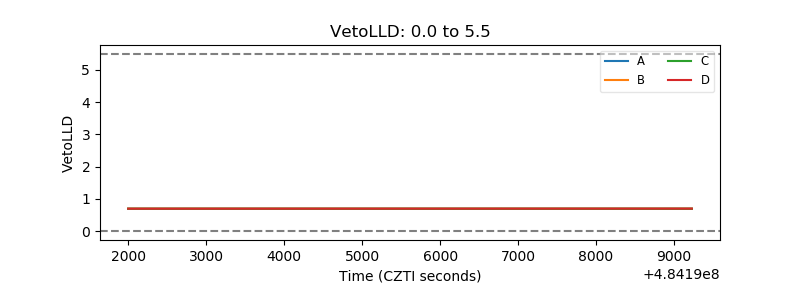 |
| Alpha Counter | 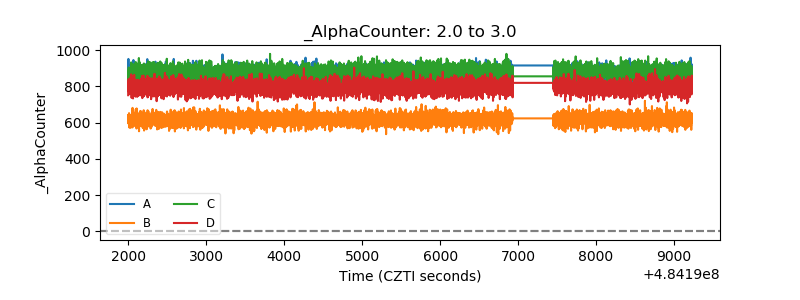 |
| _CPM_Rate | 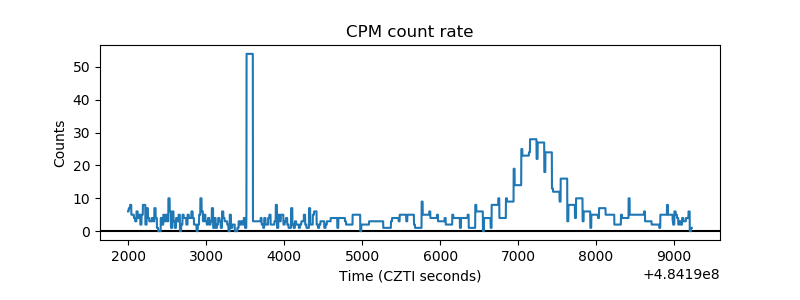 |
| CZT Counter | 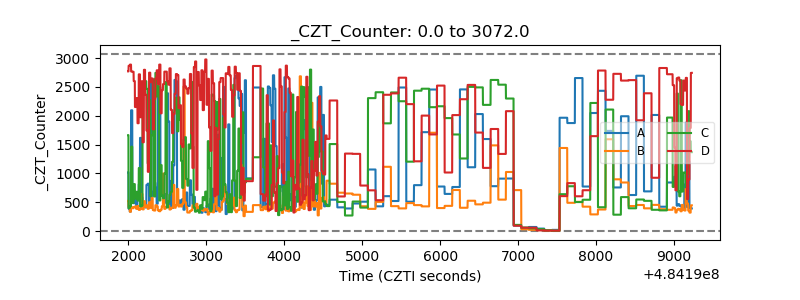 |
| +2.5 Volts monitor | 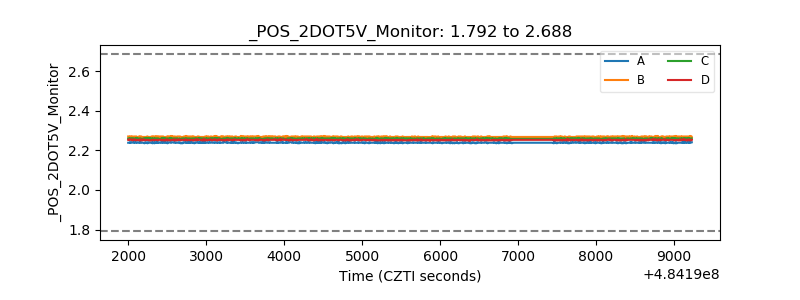 |
| +5 Volts monitor | 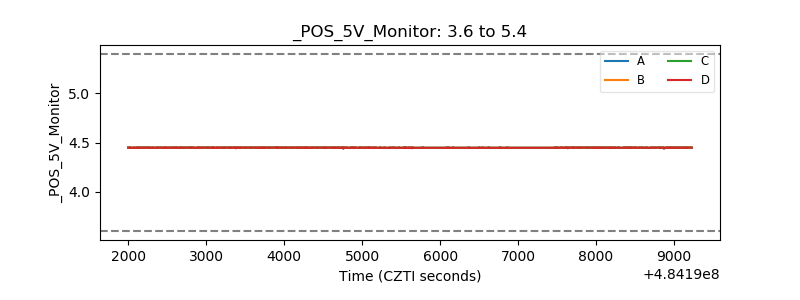 |
| _ROLL_ROT | 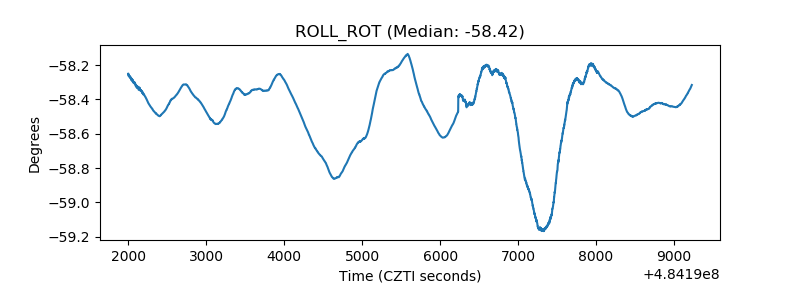 |
| _Roll_DEC | 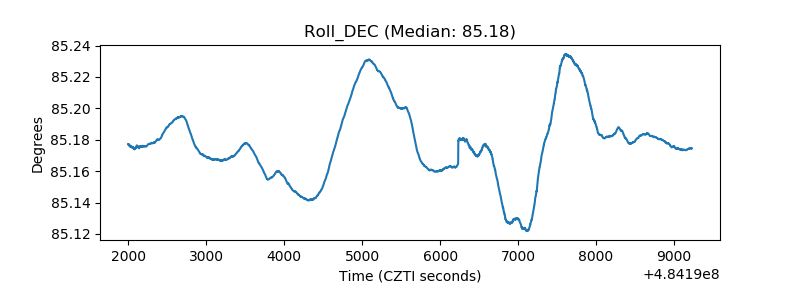 |
| _Roll_RA | 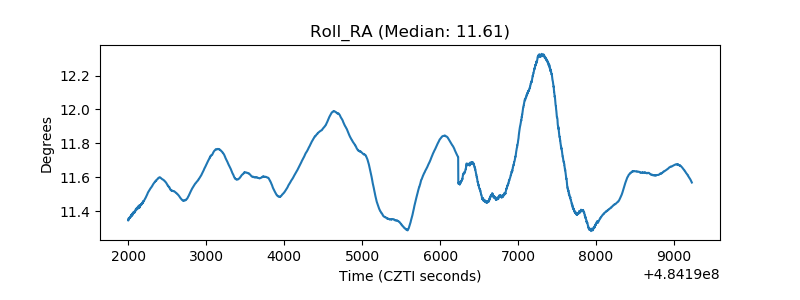 |
| Veto Counter | 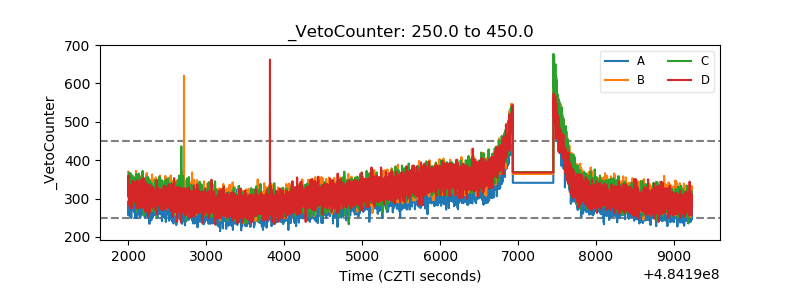 |