| Param | Original file | Final file |
|---|---|---|
| Filename | modeM0/AS1C09_011T06_9000006468_51949cztM0_level2.fits | modeM0/AS1C09_011T06_9000006468_51949cztM0_level2_quad_clean.evt |
| Size (bytes) | 910,152,000 | 79,237,440 |
| Size | 868.0 MB | 75.6 MB |
| Events in quadrant A | 9,090,909 | 454,388 |
| Events in quadrant B | 4,596,762 | 641,921 |
| Events in quadrant C | 9,426,980 | 431,856 |
| Events in quadrant D | 10,051,943 | 397,263 |
| Mode M0 | |||
|---|---|---|---|
| Quadrant | BADHDUFLAG | Total packets | Discarded packets |
| A | 0 | 31686 | 2 |
| B | 0 | 18604 | 0 |
| C | 0 | 32846 | 0 |
| D | 0 | 34537 | 0 |
| Mode SS | |||
|---|---|---|---|
| Quadrant | BADHDUFLAG | Total packets | Discarded packets |
| A | 0 | 136 | 0 |
| B | 0 | 136 | 0 |
| C | 0 | 136 | 0 |
| D | 0 | 136 | 0 |
| Quadrant | Total seconds | Saturated seconds | Saturation percentage |
|---|---|---|---|
| A | 6787 | 2094 | 30.853102% |
| B | 6788 | 515 | 7.586918% |
| C | 6788 | 2290 | 33.736005% |
| D | 6788 | 2242 | 33.028874% |
Noise dominated data is calculated using 1-second bins in cleaned event files. If a bin has >2000 counts, and if more than 50% of those come from <1% of pixels, then it is considered to be noise-dominated and hence unusable.
| Quadrant | # 1 sec bins | Bins with >0 counts | Bins with >2000 counts | High rate bins dominated by noise | Noise dominated (total time) | Noise dominated (detector-on time) | Marked lightcurve |
|---|---|---|---|---|---|---|---|
| A | 6787 | 6787 | 1796 | 1796 | 26.46% | 26.46% | 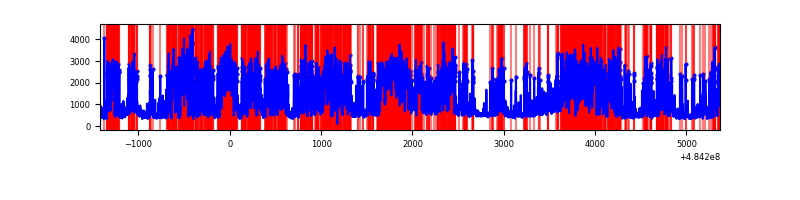 |
| B | 6788 | 6788 | 257 | 257 | 3.79% | 3.79% | 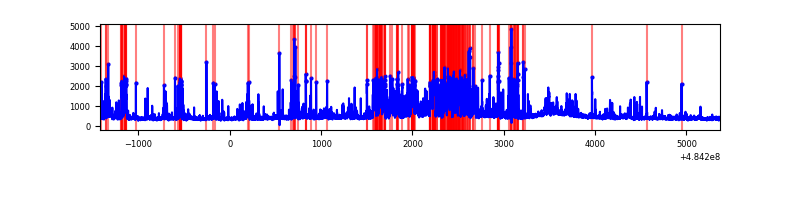 |
| C | 6788 | 6788 | 1842 | 1842 | 27.14% | 27.14% | 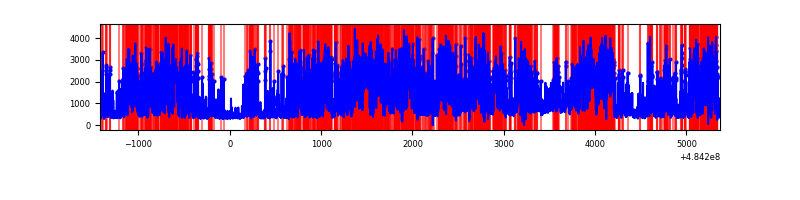 |
| D | 6788 | 6788 | 2175 | 2175 | 32.04% | 32.04% | 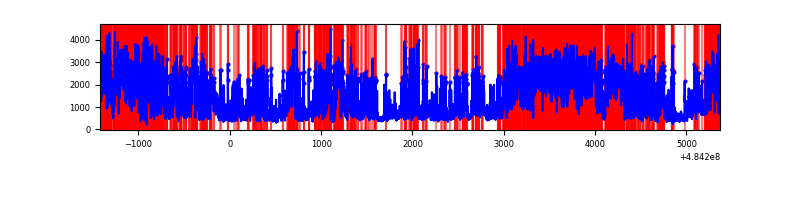 |
Top three noisy pixels from each quadrant. If the there are fewer than three noisy pixels in the level2.evt file, extra rows are filled as -1
| Pixel properties | Quadrant properties | ||||||
|---|---|---|---|---|---|---|---|
| Quadrant | DetID | PixID | Counts | Sigma | Mean | Median | Sigma |
| A | 4 | 159 | 3601272 | 23820.0 | 602 | 587 | 151.2 |
| A | 7 | 64 | 2445483 | 16173.99 | 602 | 587 | 151.2 |
| A | 4 | 3 | 139654 | 919.99 | 602 | 587 | 151.2 |
| B | 4 | 171 | 928744 | 6398.76 | 680 | 656 | 145.0 |
| B | 4 | 201 | 166779 | 1145.34 | 680 | 656 | 145.0 |
| B | 5 | 185 | 92689 | 634.52 | 680 | 656 | 145.0 |
| C | 15 | 224 | 6479367 | 40820.86 | 564 | 557 | 158.7 |
| C | 13 | 3 | 195504 | 1228.3 | 564 | 557 | 158.7 |
| C | 15 | 193 | 126266 | 792.05 | 564 | 557 | 158.7 |
| D | 12 | 16 | 4036812 | 25778.09 | 550 | 525 | 156.6 |
| D | 12 | 17 | 2054724 | 13119.32 | 550 | 525 | 156.6 |
| D | 3 | 12 | 565819 | 3610.3 | 550 | 525 | 156.6 |
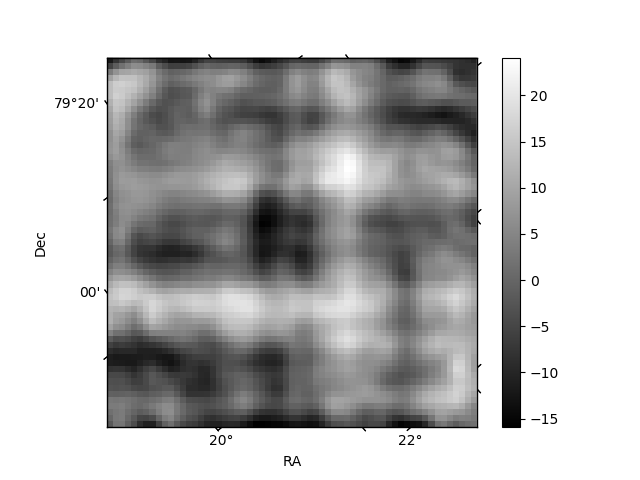
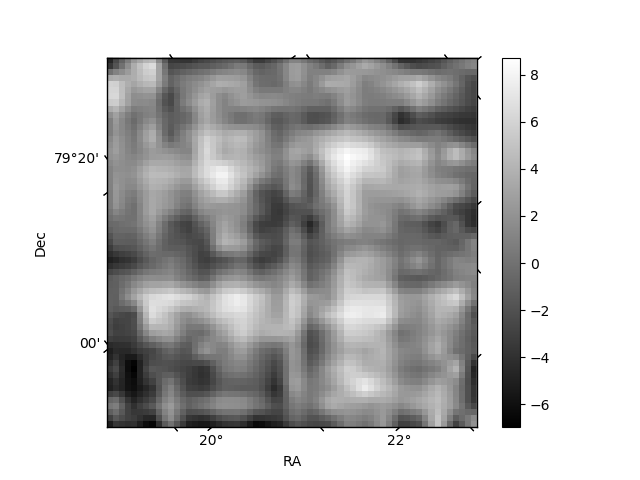
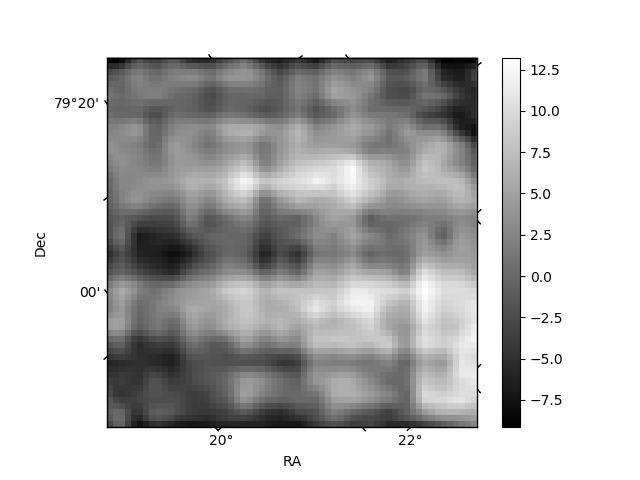
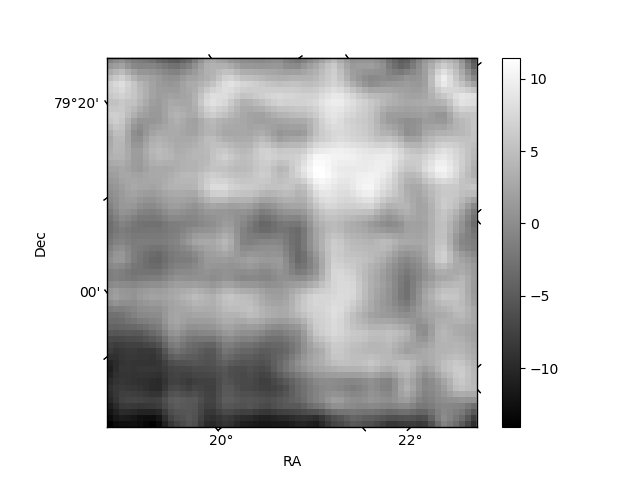
Histogram calculated using DETX and DETY for each event in the final _common_clean file
| Quadrant A | 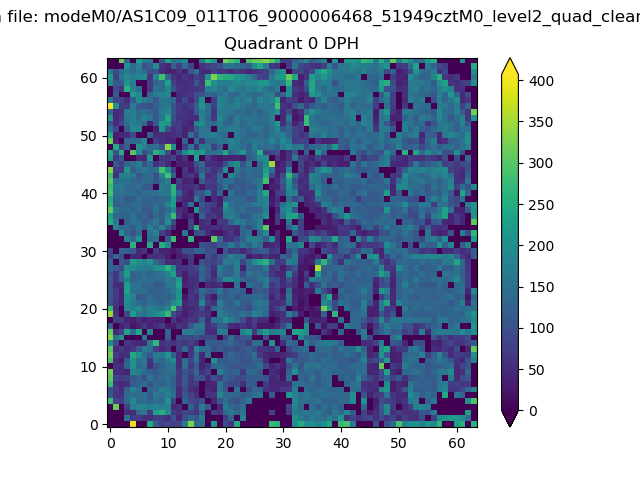 |
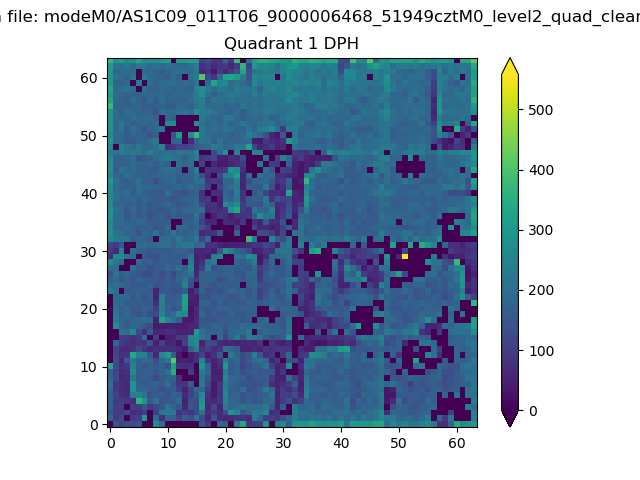 |
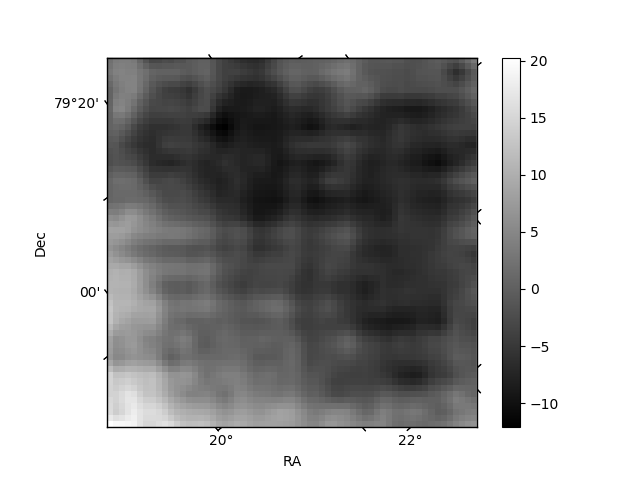
Quadrant B |
|---|---|---|---|
| Quadrant D | 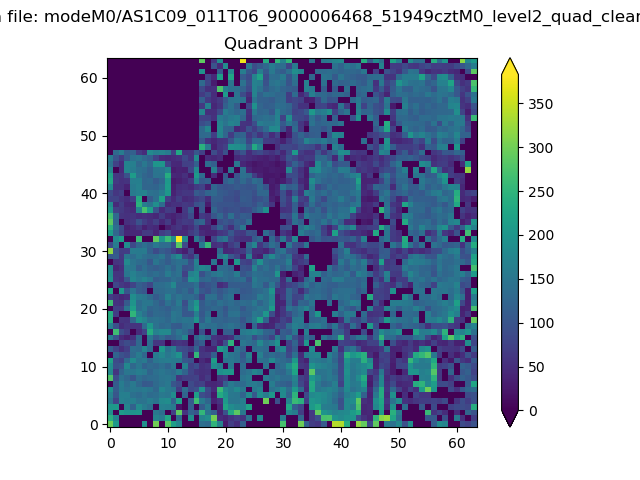 |
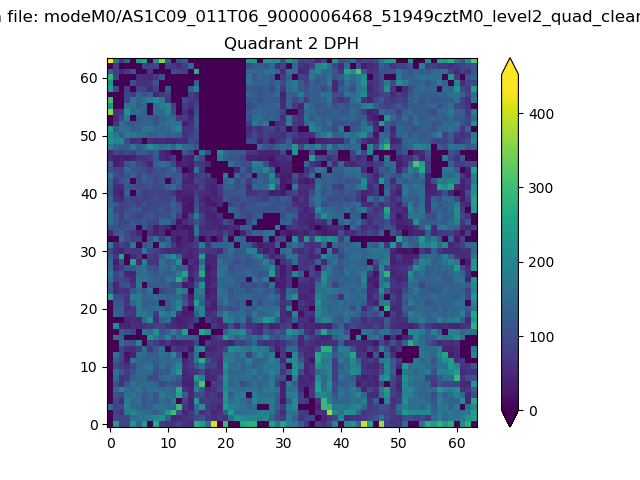 |
Quadrant C |
| Plot type | Count rate plots | Images |
|---|---|---|
| Comparison with Poisson distribution Blue bars denote a histogram of data divided into 1 sec bins. Red curve is a Poisson curve with rate = median count rate of data. |
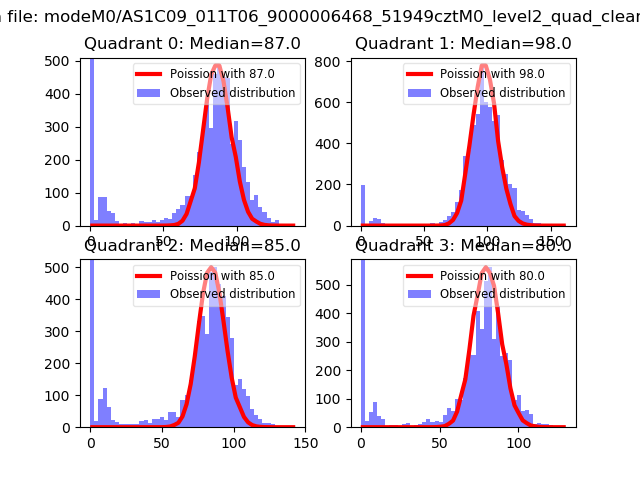 |
 |
| Quadrant-wise count rates Data is divided into 100 sec bins |
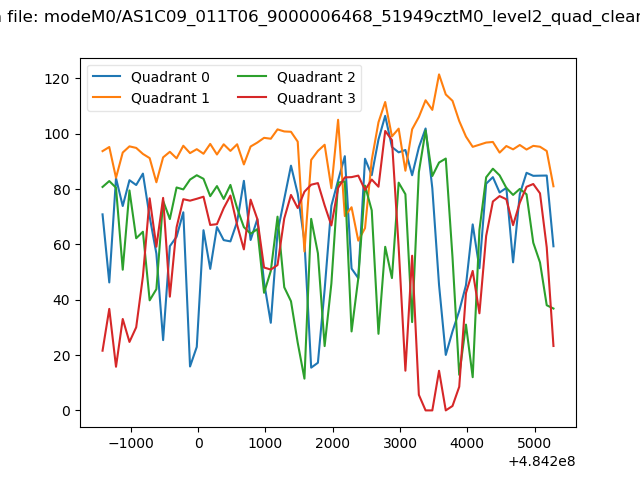 |
|
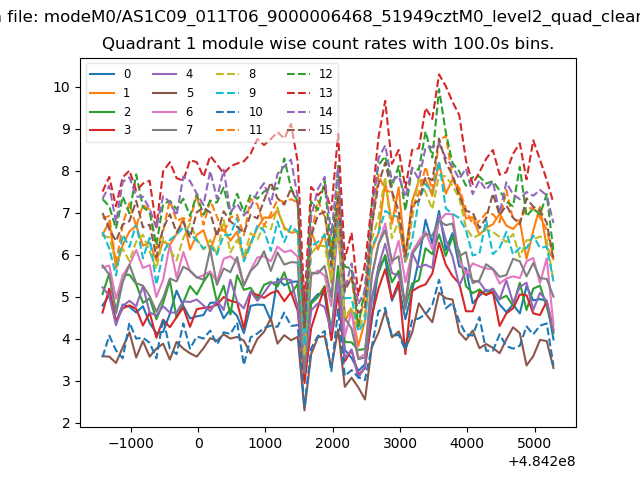
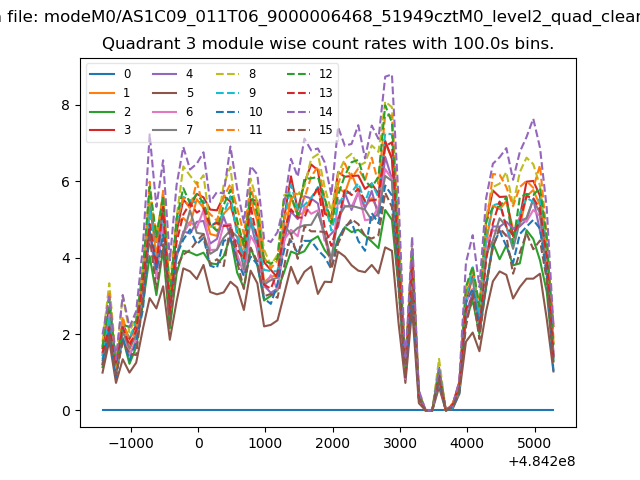
| Module-wise count rates for Quadrant A Data is divided into 100 sec bins |
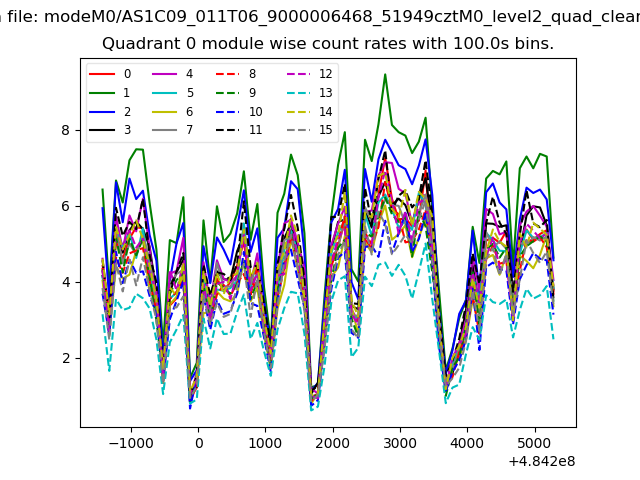 |
 |
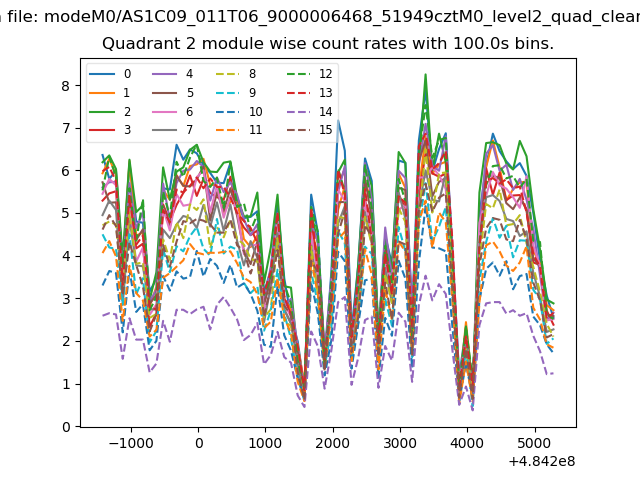
| Module-wise count rates for Quadrant B Data is divided into 100 sec bins |
 |
 |
| Module-wise count rates for Quadrant C Data is divided into 100 sec bins |
 |
 |
| Module-wise count rates for Quadrant D Data is divided into 100 sec bins |
 |
 |
| Parameter | Plot |
|---|---|
| CZT HV Monitor | 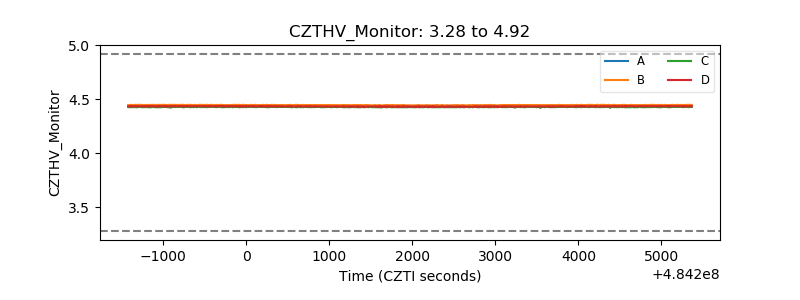 |
| D_VDD | 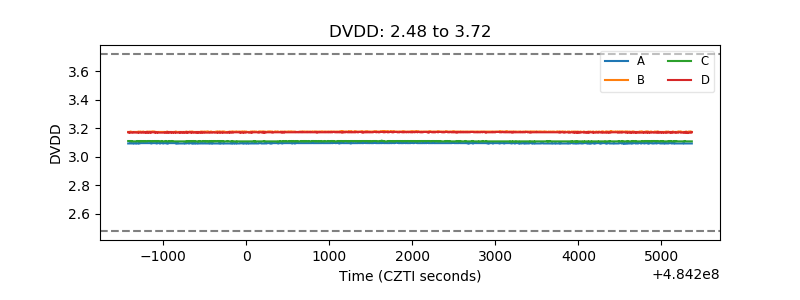 |
| Temperature 1 | 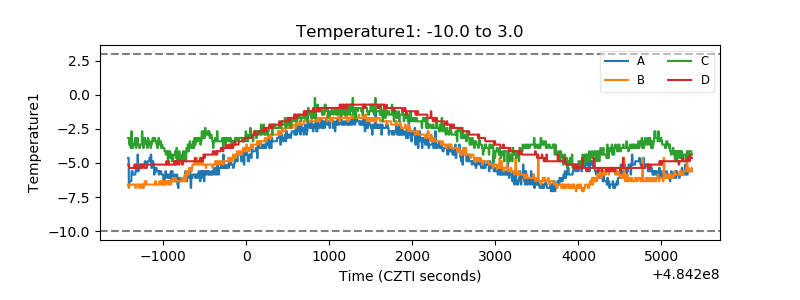 |
| Veto HV Monitor | 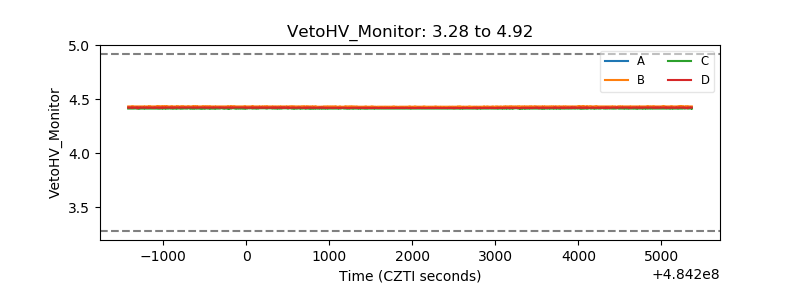 |
| Veto LLD | 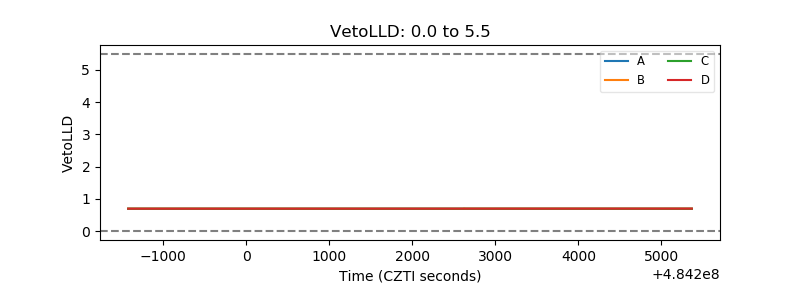 |
| Alpha Counter | 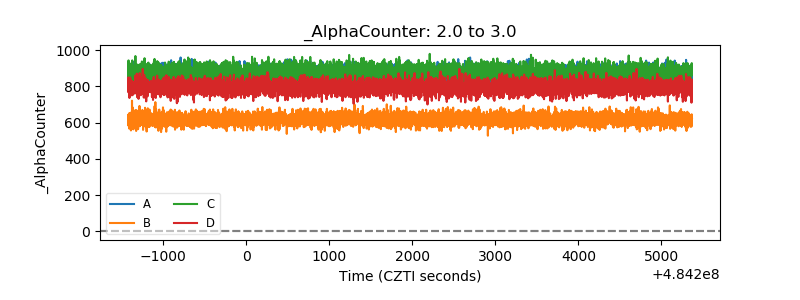 |
| _CPM_Rate | 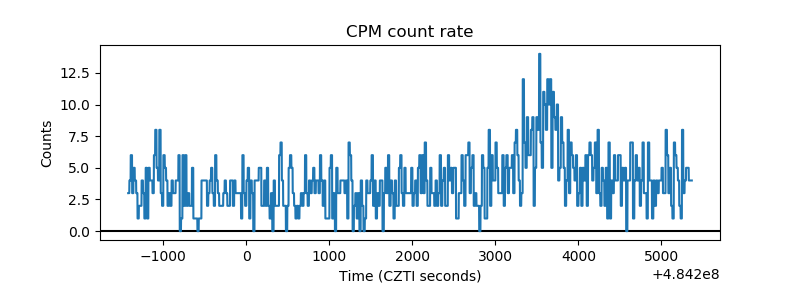 |
| CZT Counter | 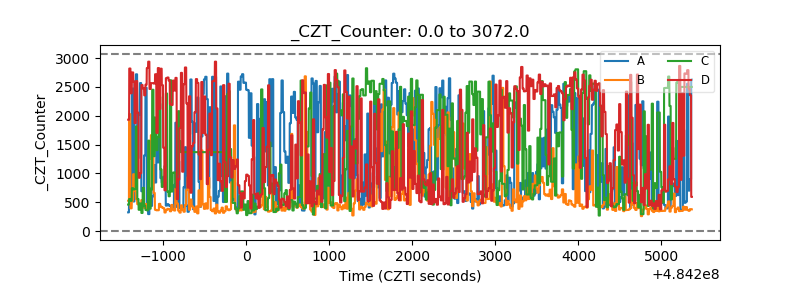 |
| +2.5 Volts monitor | 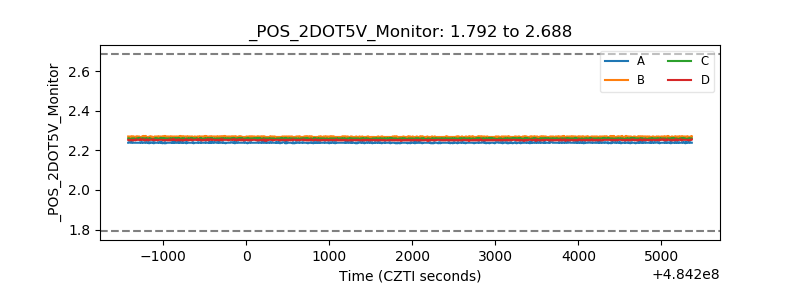 |
| +5 Volts monitor | 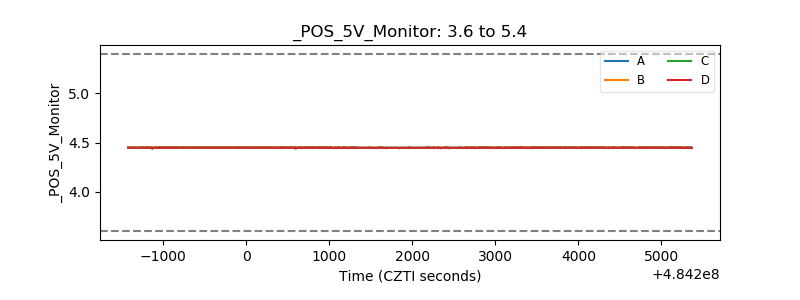 |
| _ROLL_ROT | 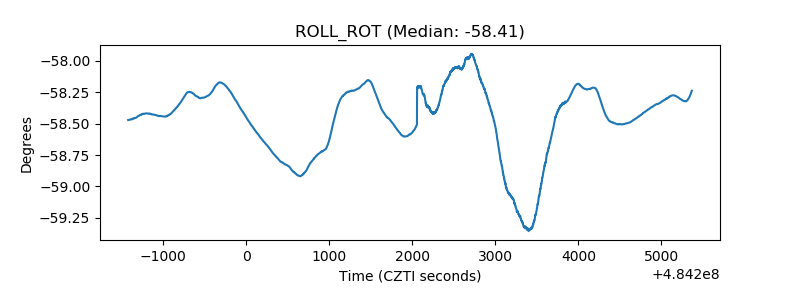 |
| _Roll_DEC | 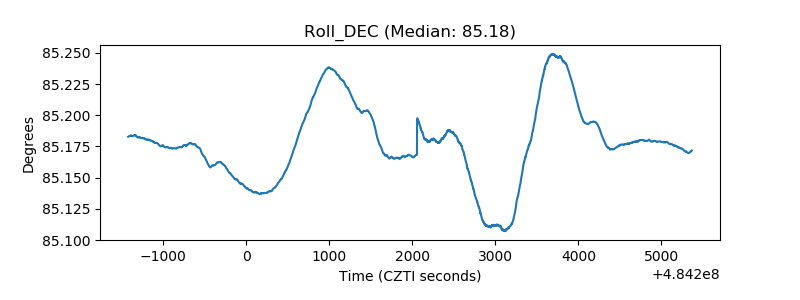 |
| _Roll_RA | 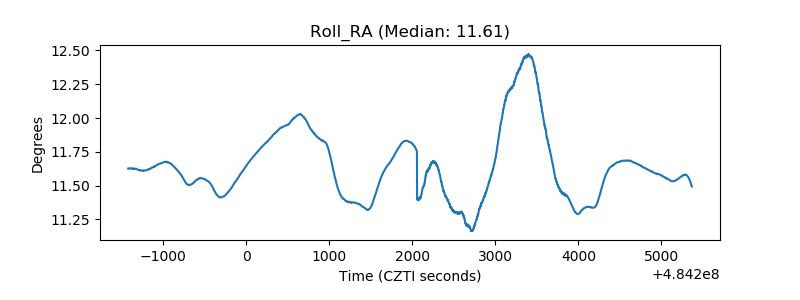 |
| Veto Counter | 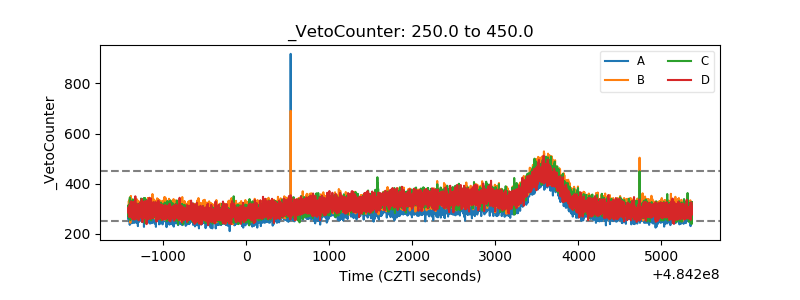 |