| Param | Original file | Final file |
|---|---|---|
| Filename | modeM0/AS1C09_011T06_9000006468_51951cztM0_level2.fits | modeM0/AS1C09_011T06_9000006468_51951cztM0_level2_quad_clean.evt |
| Size (bytes) | 1,010,540,160 | 88,237,440 |
| Size | 963.7 MB | 84.1 MB |
| Events in quadrant A | 8,975,433 | 563,364 |
| Events in quadrant B | 4,123,050 | 752,793 |
| Events in quadrant C | 12,390,300 | 406,935 |
| Events in quadrant D | 11,325,409 | 414,144 |
| Mode M0 | |||
|---|---|---|---|
| Quadrant | BADHDUFLAG | Total packets | Discarded packets |
| A | 0 | 31918 | 0 |
| B | 0 | 17735 | 0 |
| C | 0 | 42043 | 0 |
| D | 0 | 39042 | 0 |
| Mode SS | |||
|---|---|---|---|
| Quadrant | BADHDUFLAG | Total packets | Discarded packets |
| A | 0 | 154 | 0 |
| B | 0 | 154 | 0 |
| C | 0 | 154 | 0 |
| D | 0 | 154 | 0 |
| Quadrant | Total seconds | Saturated seconds | Saturation percentage |
|---|---|---|---|
| A | 7669 | 1695 | 22.101969% |
| B | 7670 | 125 | 1.629726% |
| C | 7670 | 3452 | 45.006519% |
| D | 7670 | 2885 | 37.614081% |
Noise dominated data is calculated using 1-second bins in cleaned event files. If a bin has >2000 counts, and if more than 50% of those come from <1% of pixels, then it is considered to be noise-dominated and hence unusable.
| Quadrant | # 1 sec bins | Bins with >0 counts | Bins with >2000 counts | High rate bins dominated by noise | Noise dominated (total time) | Noise dominated (detector-on time) | Marked lightcurve |
|---|---|---|---|---|---|---|---|
| A | 7669 | 7669 | 1352 | 1352 | 17.63% | 17.63% | 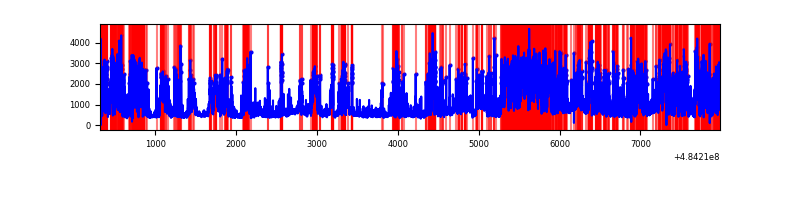 |
| B | 7670 | 7670 | 56 | 56 | 0.73% | 0.73% | 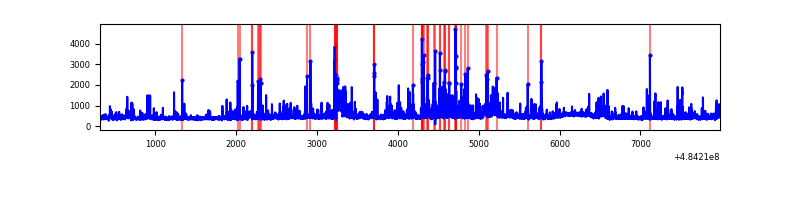 |
| C | 7670 | 7670 | 2784 | 2784 | 36.30% | 36.30% | 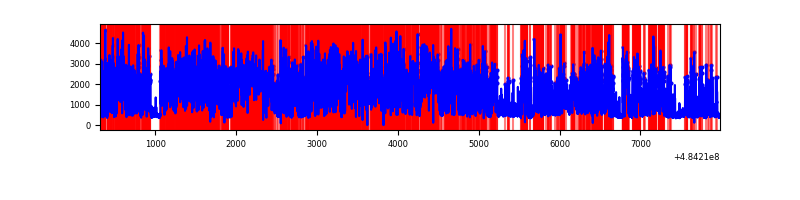 |
| D | 7670 | 7670 | 2426 | 2426 | 31.63% | 31.63% | 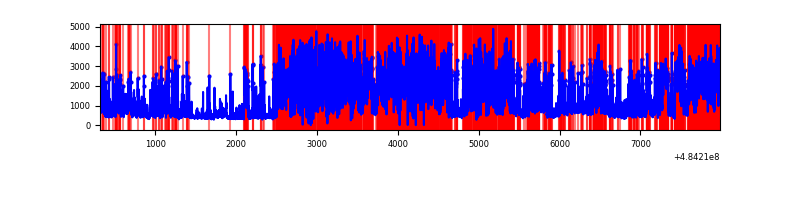 |
Top three noisy pixels from each quadrant. If the there are fewer than three noisy pixels in the level2.evt file, extra rows are filled as -1
| Pixel properties | Quadrant properties | ||||||
|---|---|---|---|---|---|---|---|
| Quadrant | DetID | PixID | Counts | Sigma | Mean | Median | Sigma |
| A | 7 | 64 | 2472616 | 14043.2 | 710 | 692 | 176.0 |
| A | 4 | 159 | 2191180 | 12444.34 | 710 | 692 | 176.0 |
| A | 4 | 249 | 345660 | 1959.79 | 710 | 692 | 176.0 |
| B | 4 | 81 | 151359 | 894.26 | 781 | 754 | 168.4 |
| B | 4 | 201 | 100236 | 590.7 | 781 | 754 | 168.4 |
| B | 10 | 44 | 68291 | 401.02 | 781 | 754 | 168.4 |
| C | 15 | 224 | 5528793 | 33773.9 | 589 | 585 | 163.7 |
| C | 13 | 3 | 2959564 | 18077.51 | 589 | 585 | 163.7 |
| C | 4 | 5 | 711978 | 4346.17 | 589 | 585 | 163.7 |
| D | 12 | 16 | 5088501 | 29613.27 | 599 | 569 | 171.8 |
| D | 6 | 42 | 1431668 | 8329.42 | 599 | 569 | 171.8 |
| D | 7 | 60 | 949462 | 5522.84 | 599 | 569 | 171.8 |
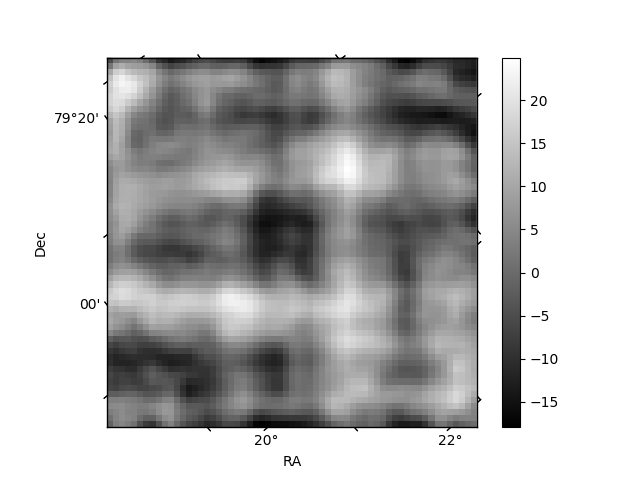
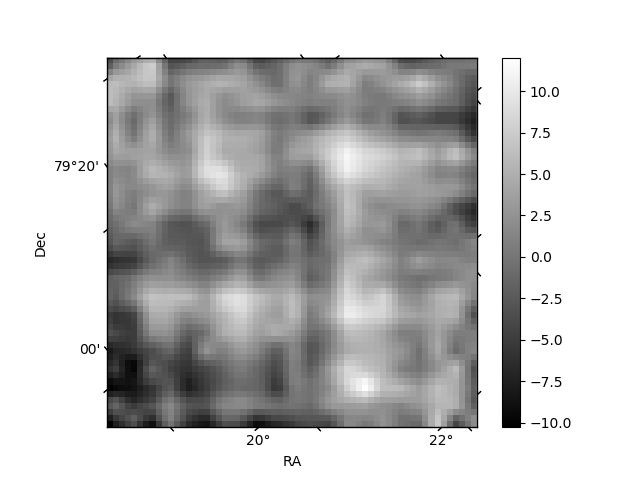
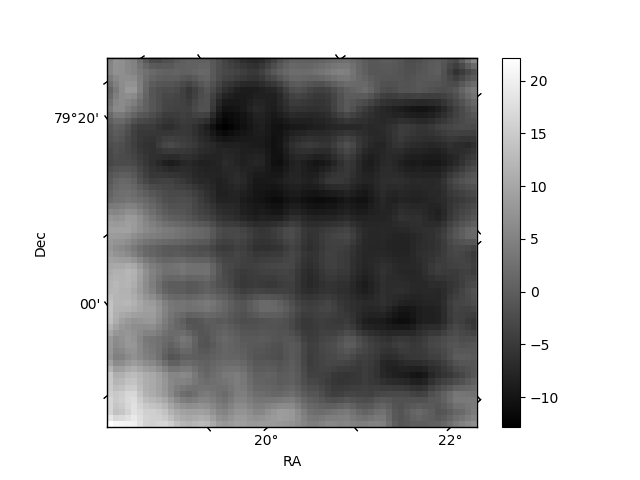
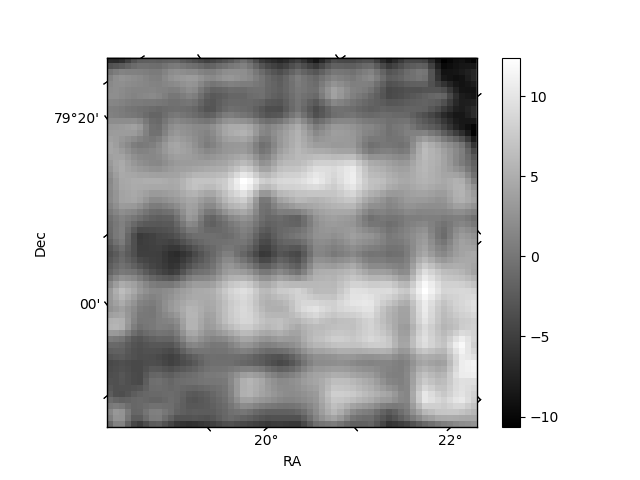
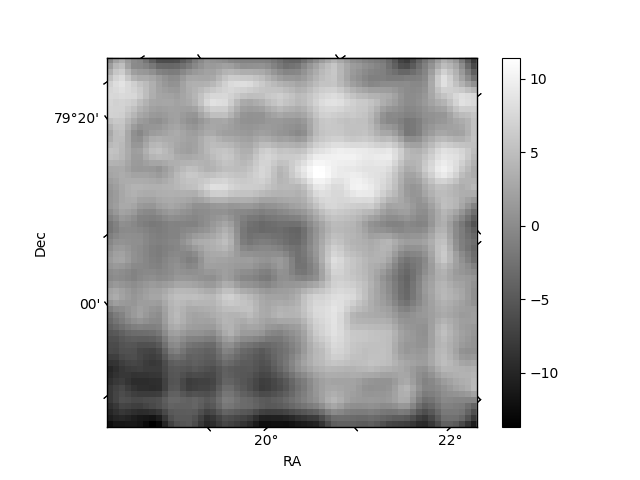
Histogram calculated using DETX and DETY for each event in the final _common_clean file
| Quadrant A | 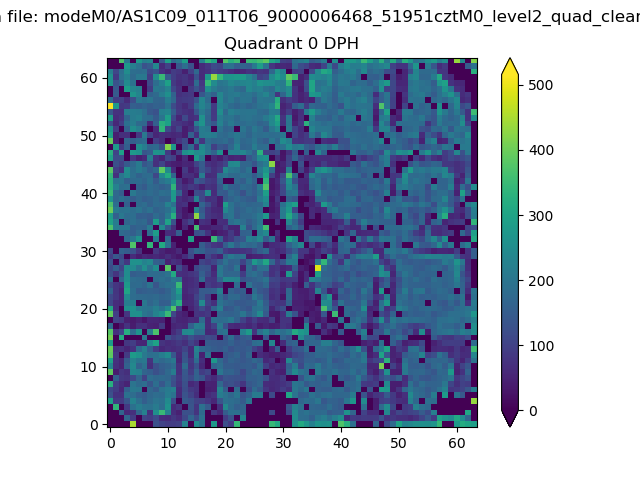 |
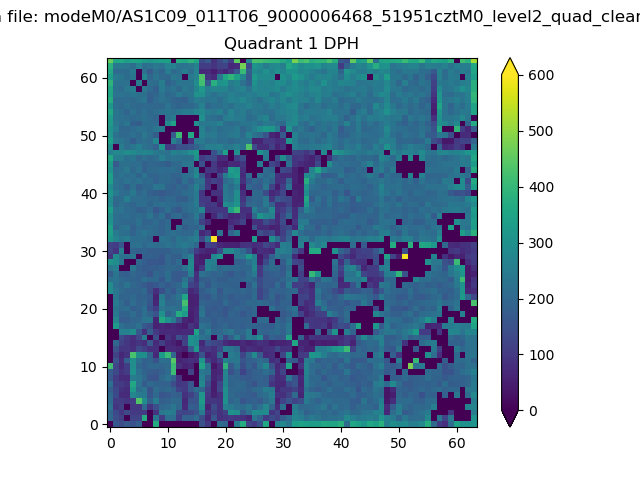 |
Quadrant B |
|---|---|---|---|
| Quadrant D | 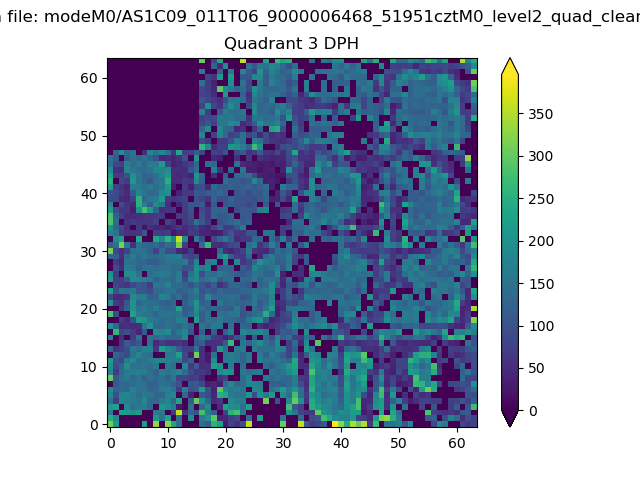 |
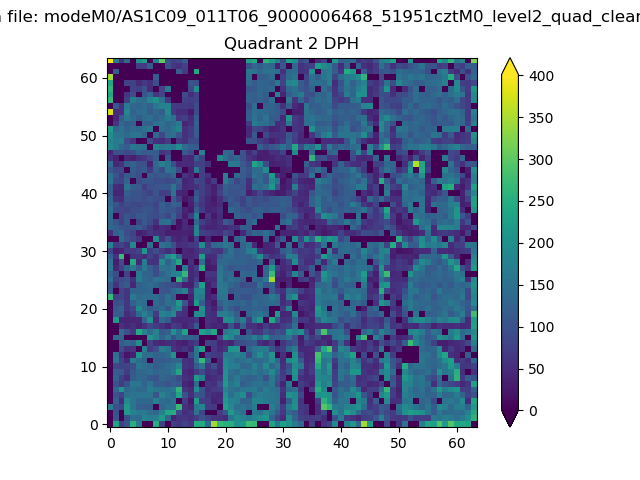 |
Quadrant C |
| Plot type | Count rate plots | Images |
|---|---|---|
| Comparison with Poisson distribution Blue bars denote a histogram of data divided into 1 sec bins. Red curve is a Poisson curve with rate = median count rate of data. |
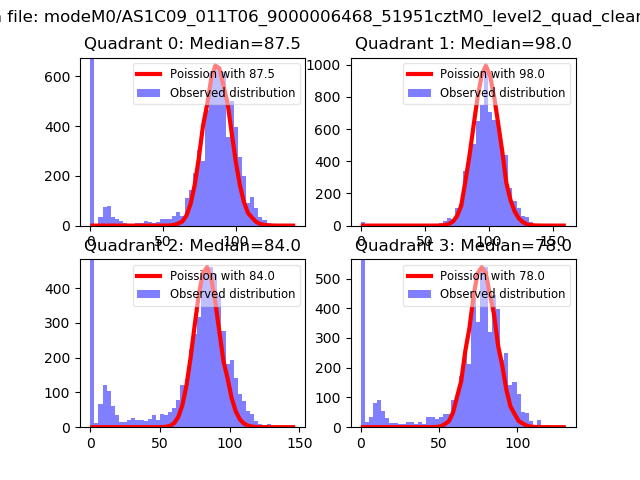 |
 |
| Quadrant-wise count rates Data is divided into 100 sec bins |
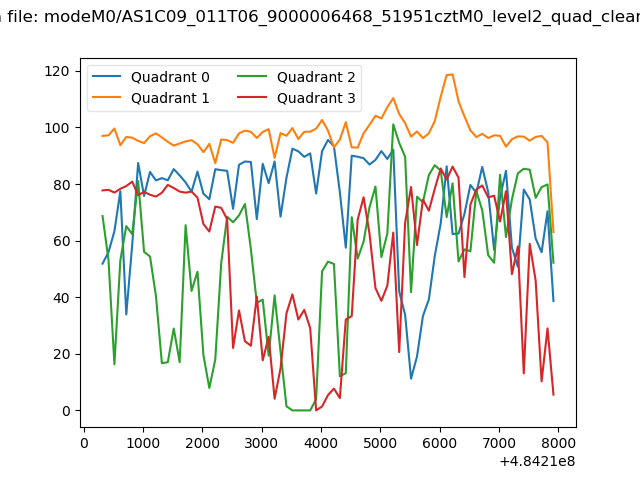 |
|
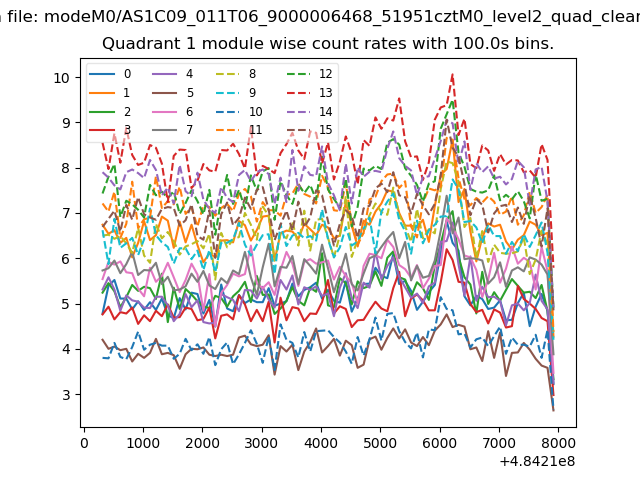
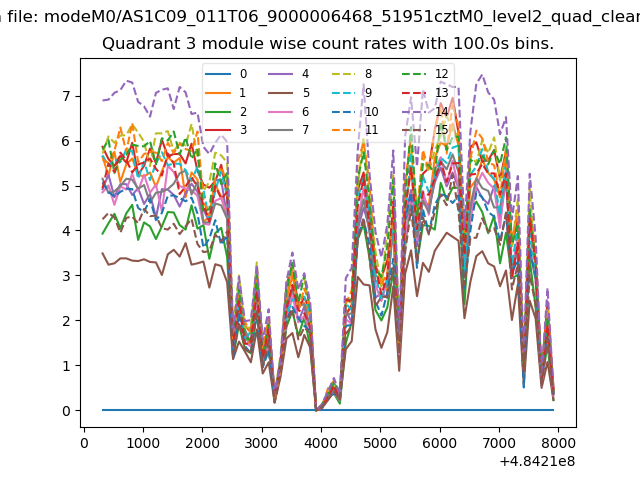
| Module-wise count rates for Quadrant A Data is divided into 100 sec bins |
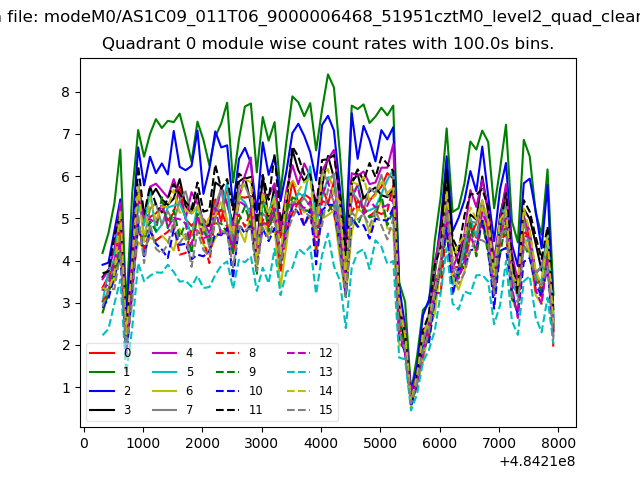 |
 |
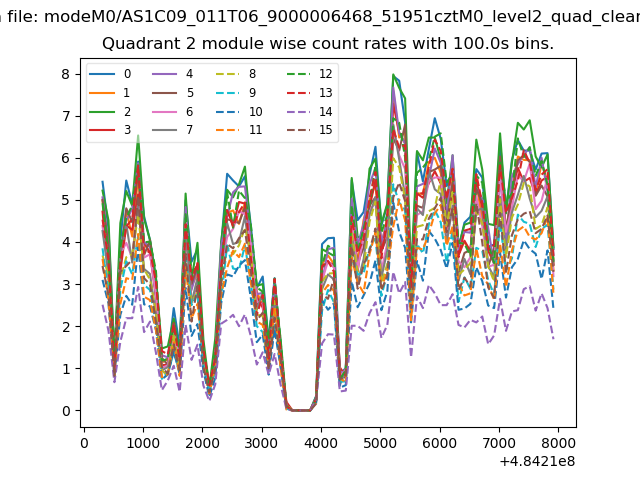
| Module-wise count rates for Quadrant B Data is divided into 100 sec bins |
 |
 |
| Module-wise count rates for Quadrant C Data is divided into 100 sec bins |
 |
 |
| Module-wise count rates for Quadrant D Data is divided into 100 sec bins |
 |
 |
| Parameter | Plot |
|---|---|
| CZT HV Monitor | 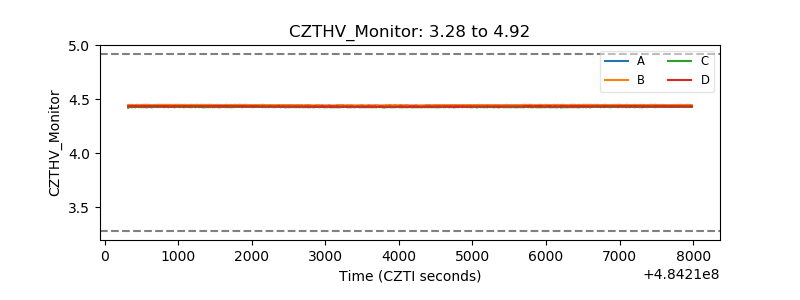 |
| D_VDD | 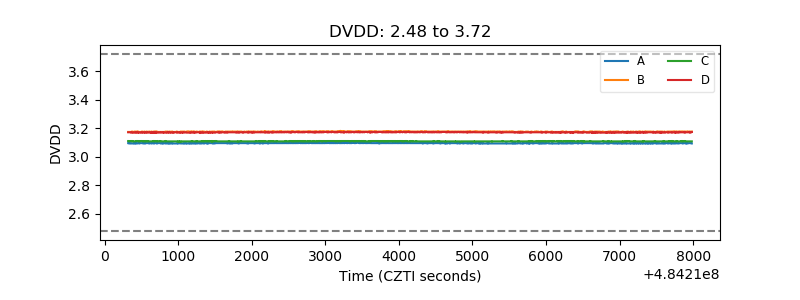 |
| Temperature 1 | 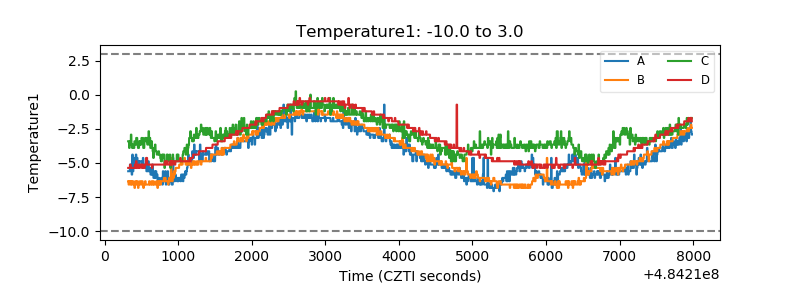 |
| Veto HV Monitor | 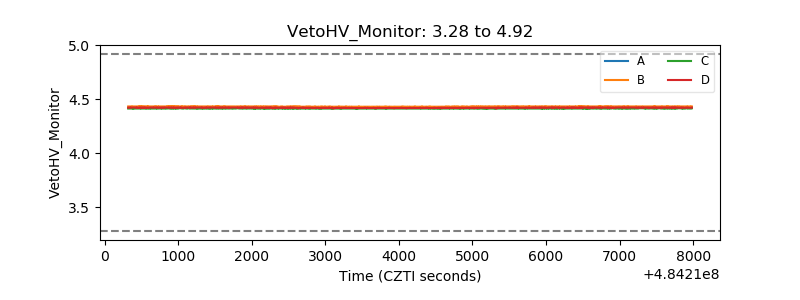 |
| Veto LLD | 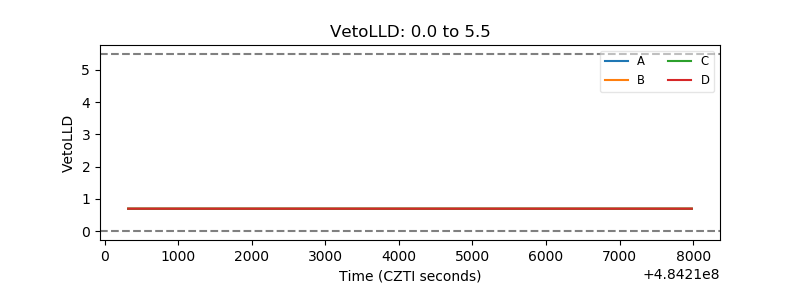 |
| Alpha Counter | 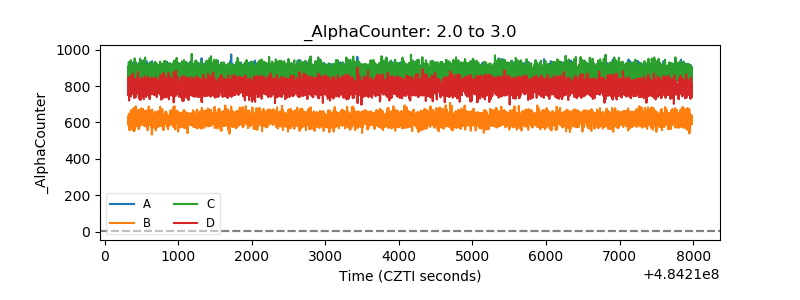 |
| _CPM_Rate | 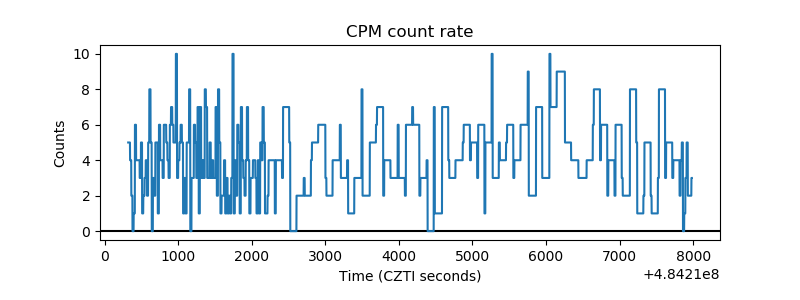 |
| CZT Counter | 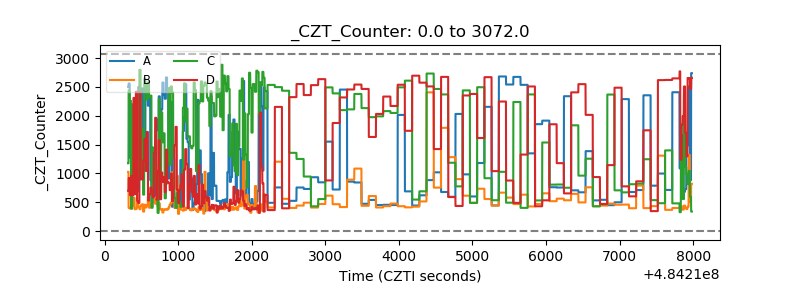 |
| +2.5 Volts monitor | 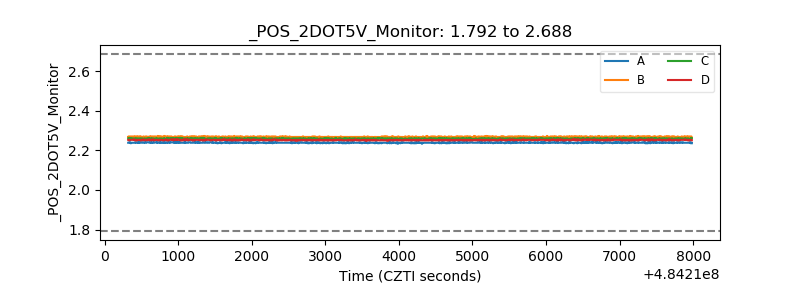 |
| +5 Volts monitor |  |
| _ROLL_ROT | 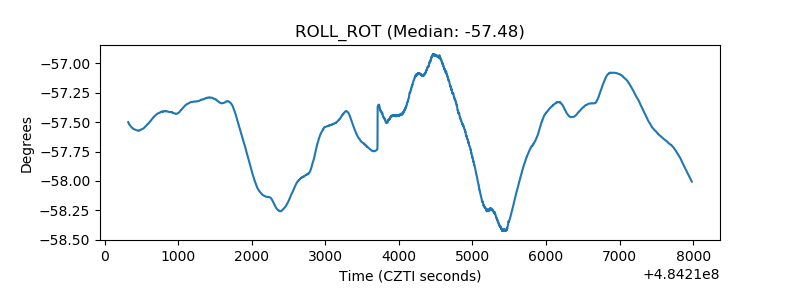 |
| _Roll_DEC | 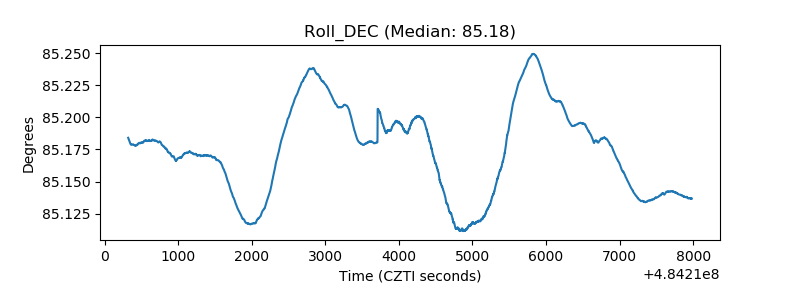 |
| _Roll_RA | 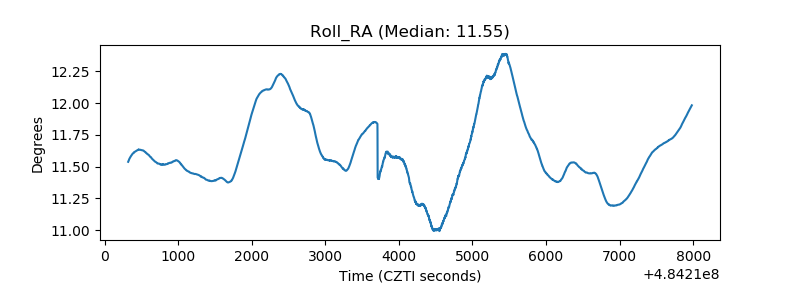 |
| Veto Counter | 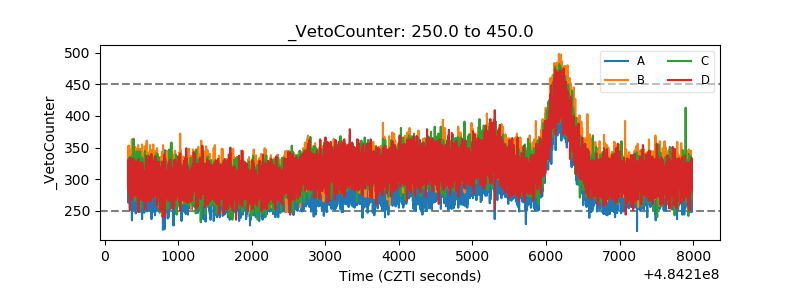 |