| Param | Original file | Final file |
|---|---|---|
| Filename | modeM0/AS1C09_011T06_9000006468_51954cztM0_level2.fits | modeM0/AS1C09_011T06_9000006468_51954cztM0_level2_quad_clean.evt |
| Size (bytes) | 2,550,775,680 | 198,017,280 |
| Size | 2.4 GB | 188.8 MB |
| Events in quadrant A | 28,102,285 | 973,923 |
| Events in quadrant B | 10,776,117 | 1,770,315 |
| Events in quadrant C | 25,116,640 | 1,048,999 |
| Events in quadrant D | 29,017,817 | 938,027 |
| Mode M0 | |||
|---|---|---|---|
| Quadrant | BADHDUFLAG | Total packets | Discarded packets |
| A | 0 | 96042 | 3 |
| B | 0 | 44710 | 3 |
| C | 0 | 87277 | 3 |
| D | 0 | 98950 | 3 |
| Mode M9 | |||
|---|---|---|---|
| Quadrant | BADHDUFLAG | Total packets | Discarded packets |
| A | 0 | 12 | 0 |
| B | 0 | 12 | 0 |
| C | 0 | 12 | 0 |
| D | 0 | 12 | 0 |
| Mode SS | |||
|---|---|---|---|
| Quadrant | BADHDUFLAG | Total packets | Discarded packets |
| A | 0 | 372 | 0 |
| B | 0 | 372 | 0 |
| C | 0 | 372 | 0 |
| D | 0 | 372 | 0 |
| Quadrant | Total seconds | Saturated seconds | Saturation percentage |
|---|---|---|---|
| A | 18310 | 7744 | 42.293829% |
| B | 18311 | 535 | 2.921741% |
| C | 18311 | 6301 | 34.411010% |
| D | 18311 | 7120 | 38.883731% |
Noise dominated data is calculated using 1-second bins in cleaned event files. If a bin has >2000 counts, and if more than 50% of those come from <1% of pixels, then it is considered to be noise-dominated and hence unusable.
| Quadrant | # 1 sec bins | Bins with >0 counts | Bins with >2000 counts | High rate bins dominated by noise | Noise dominated (total time) | Noise dominated (detector-on time) | Marked lightcurve |
|---|---|---|---|---|---|---|---|
| A | 19490 | 18313 | 5961 | 5961 | 30.58% | 32.55% | 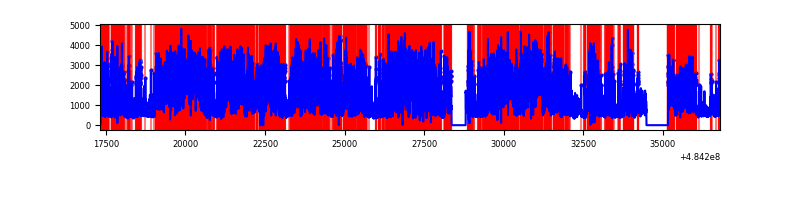 |
| B | 19491 | 18315 | 149 | 149 | 0.76% | 0.81% | 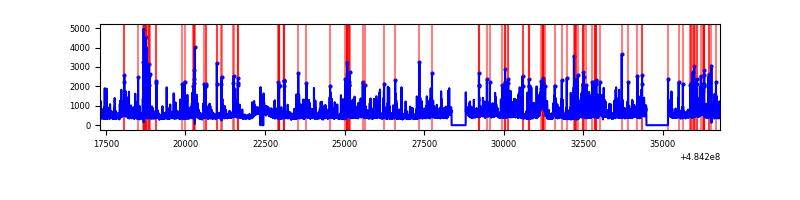 |
| C | 19491 | 18315 | 4731 | 4731 | 24.27% | 25.83% | 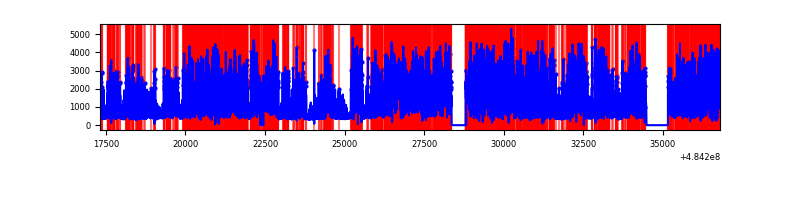 |
| D | 19491 | 18315 | 6298 | 6298 | 32.31% | 34.39% | 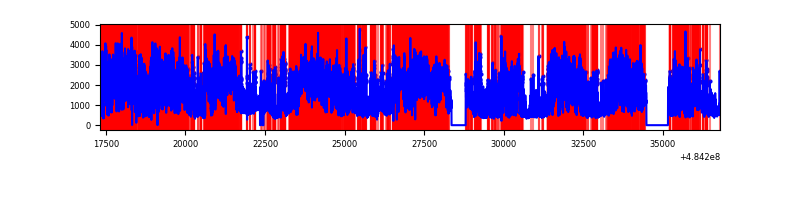 |
Top three noisy pixels from each quadrant. If the there are fewer than three noisy pixels in the level2.evt file, extra rows are filled as -1
| Pixel properties | Quadrant properties | ||||||
|---|---|---|---|---|---|---|---|
| Quadrant | DetID | PixID | Counts | Sigma | Mean | Median | Sigma |
| A | 4 | 159 | 11063857 | 29039.39 | 1529 | 1490 | 380.9 |
| A | 7 | 64 | 6677748 | 17525.58 | 1529 | 1490 | 380.9 |
| A | 4 | 249 | 1399193 | 3669.06 | 1529 | 1490 | 380.9 |
| B | 4 | 81 | 315153 | 782.83 | 1903 | 1841 | 400.2 |
| B | 0 | 216 | 287875 | 714.67 | 1903 | 1841 | 400.2 |
| B | 4 | 171 | 257613 | 639.06 | 1903 | 1841 | 400.2 |
| C | 15 | 224 | 12645466 | 29068.02 | 1563 | 1544 | 435.0 |
| C | 14 | 245 | 3483284 | 8004.42 | 1563 | 1544 | 435.0 |
| C | 4 | 5 | 742250 | 1702.86 | 1563 | 1544 | 435.0 |
| D | 2 | 172 | 7144236 | 15962.71 | 1578 | 1509 | 447.5 |
| D | 6 | 42 | 7047920 | 15747.46 | 1578 | 1509 | 447.5 |
| D | 7 | 60 | 2723376 | 6082.88 | 1578 | 1509 | 447.5 |
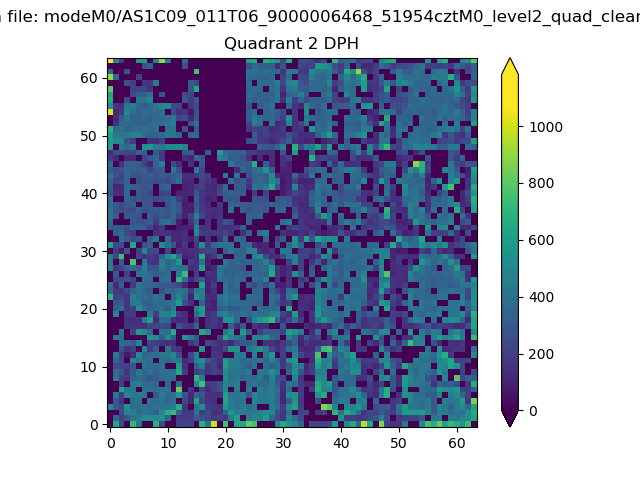
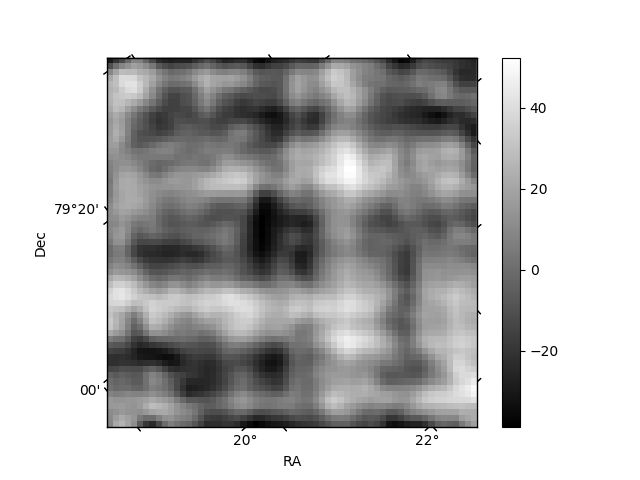
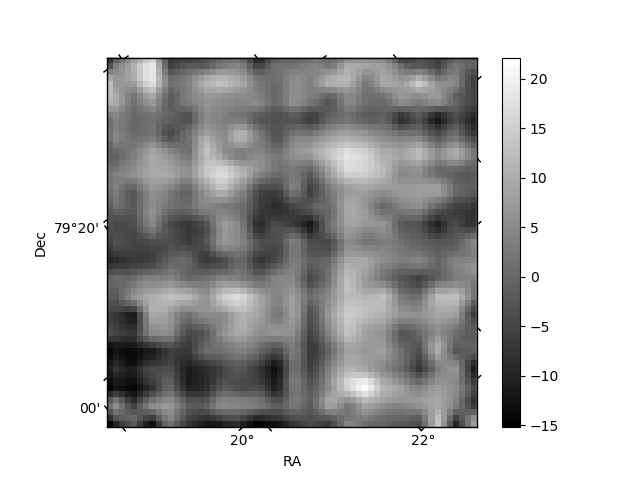
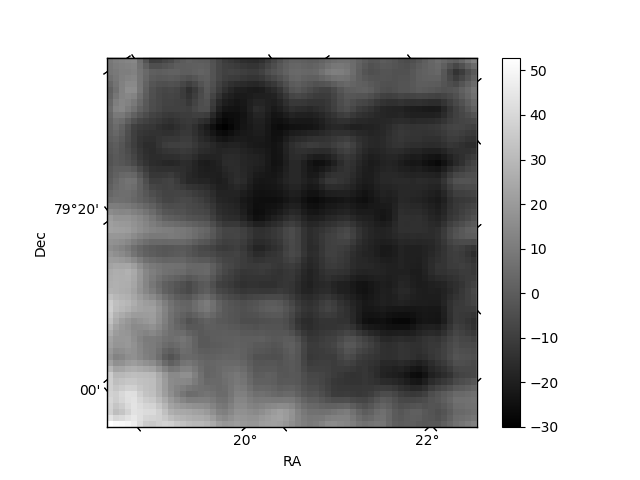
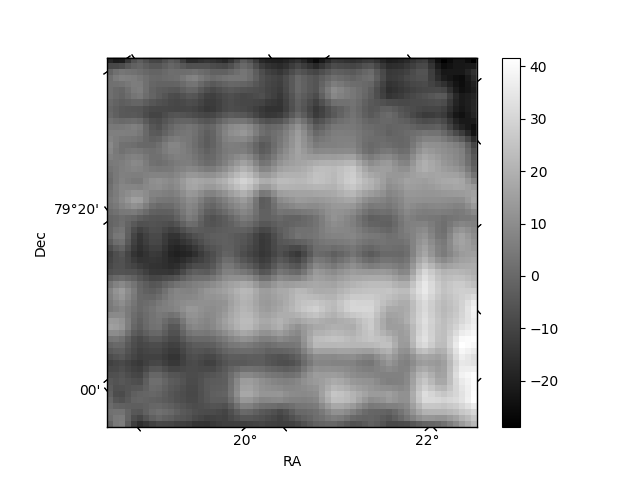
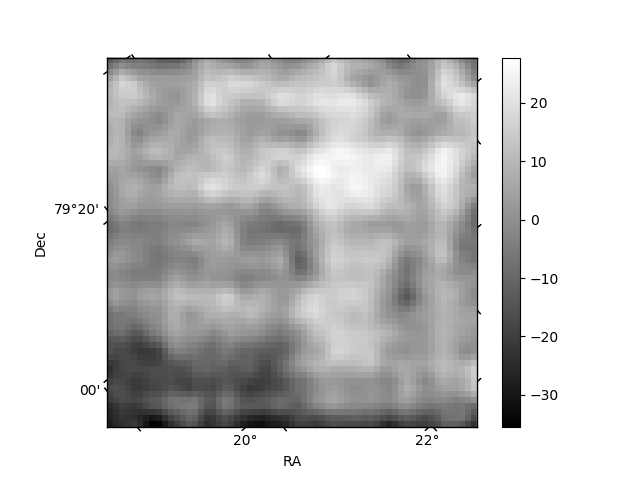
Histogram calculated using DETX and DETY for each event in the final _common_clean file
| Quadrant A | 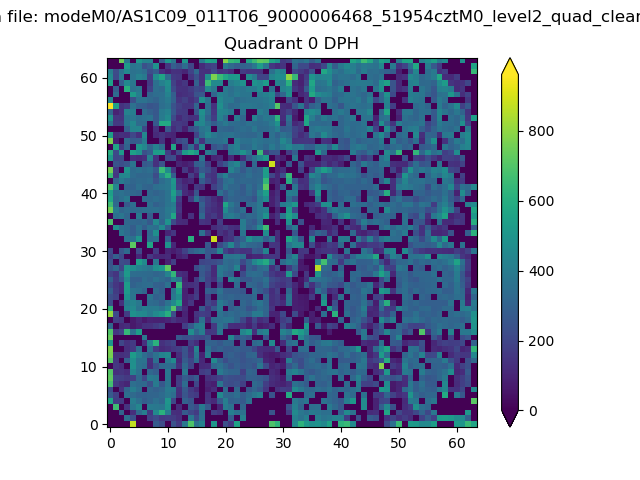 |
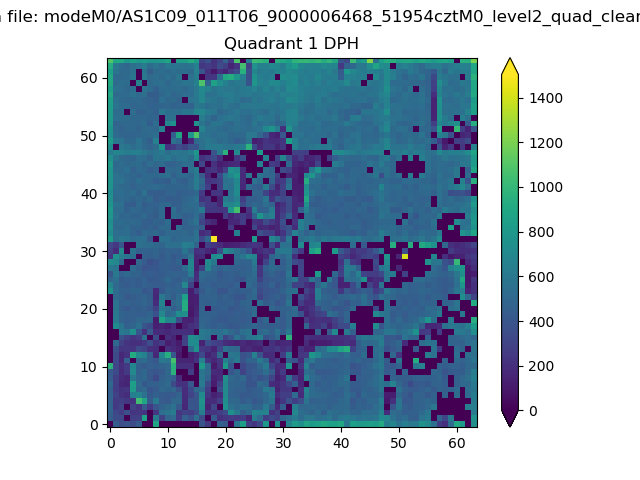 |
Quadrant B |
|---|---|---|---|
| Quadrant D | 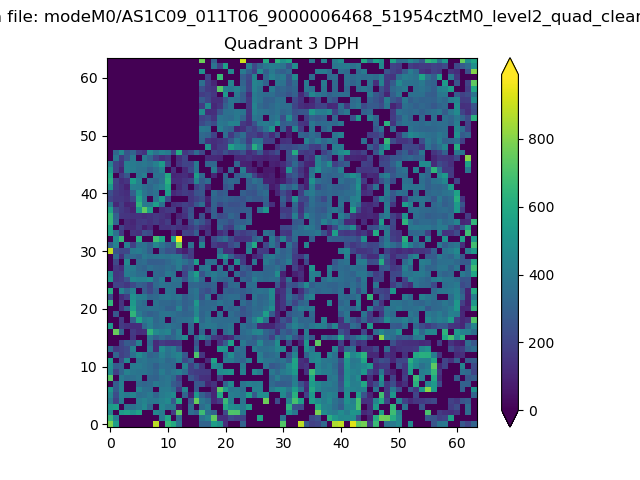 |
 |
Quadrant C |
| Plot type | Count rate plots | Images |
|---|---|---|
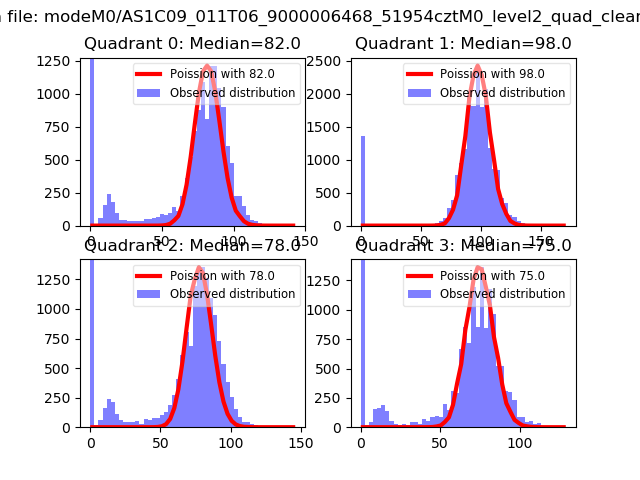
| Comparison with Poisson distribution Blue bars denote a histogram of data divided into 1 sec bins. Red curve is a Poisson curve with rate = median count rate of data. |
 |
 |
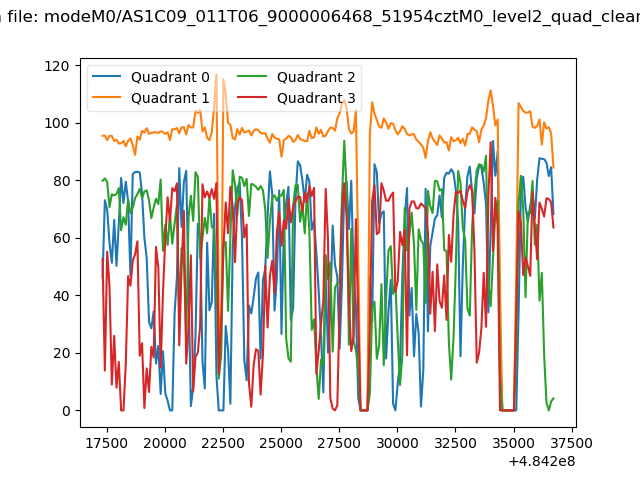
| Quadrant-wise count rates Data is divided into 100 sec bins |
 |
|
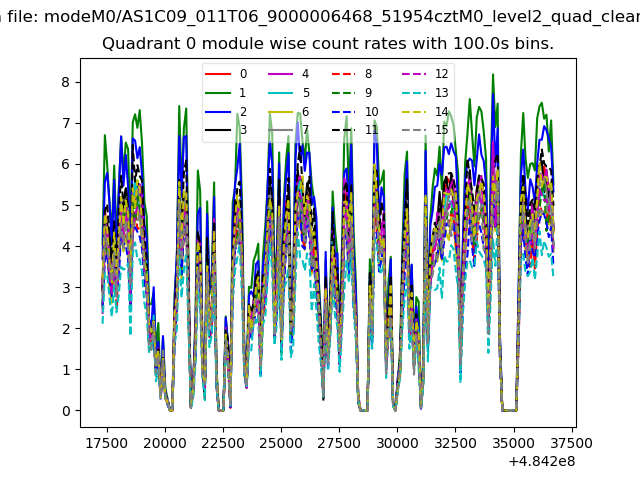
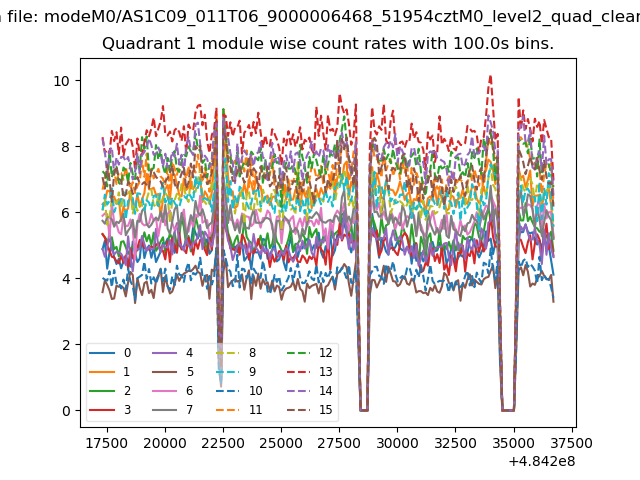
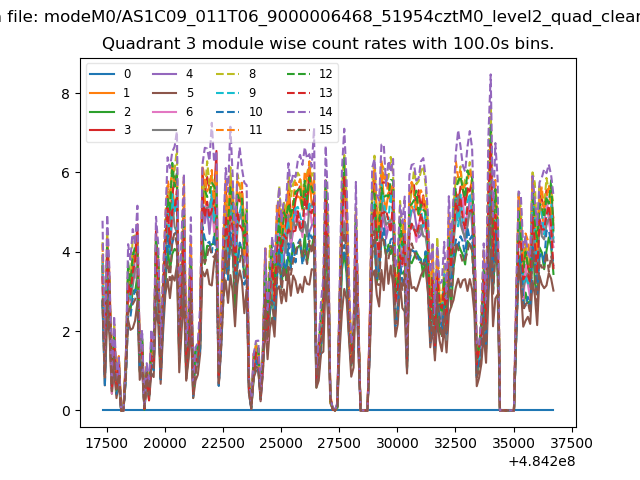
| Module-wise count rates for Quadrant A Data is divided into 100 sec bins |
 |
 |
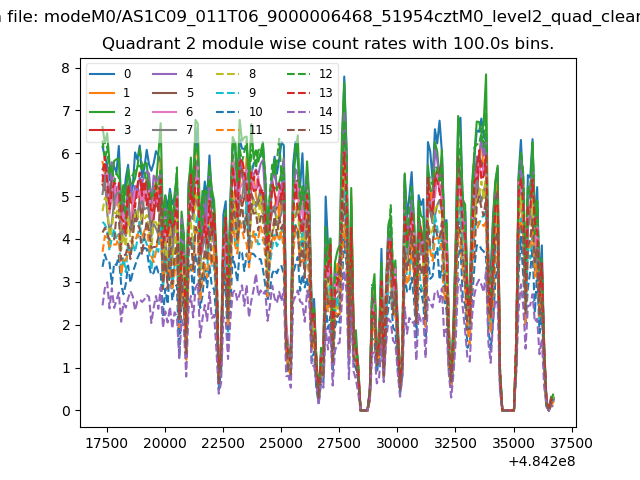
| Module-wise count rates for Quadrant B Data is divided into 100 sec bins |
 |
 |
| Module-wise count rates for Quadrant C Data is divided into 100 sec bins |
 |
 |
| Module-wise count rates for Quadrant D Data is divided into 100 sec bins |
 |
 |
| Parameter | Plot |
|---|---|
| CZT HV Monitor | 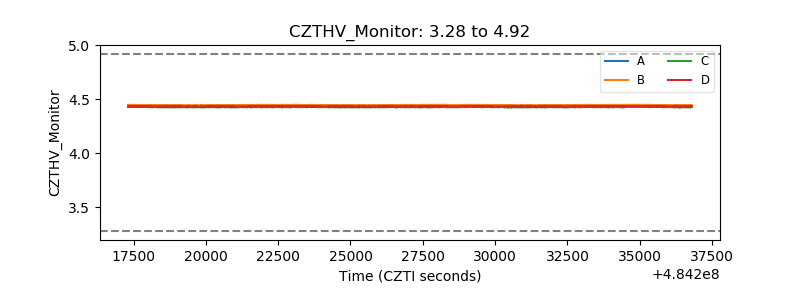 |
| D_VDD | 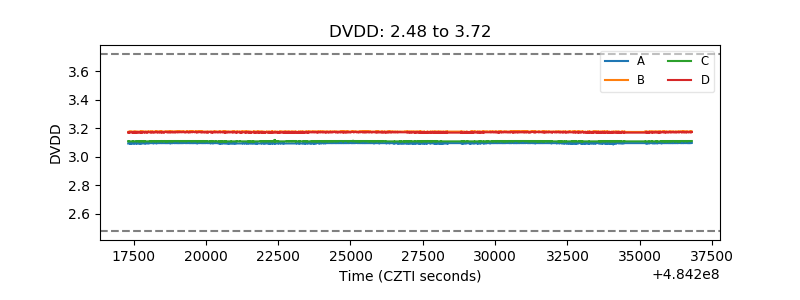 |
| Temperature 1 | 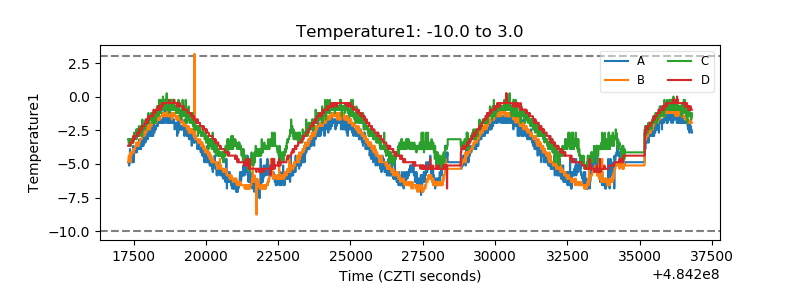 |
| Veto HV Monitor | 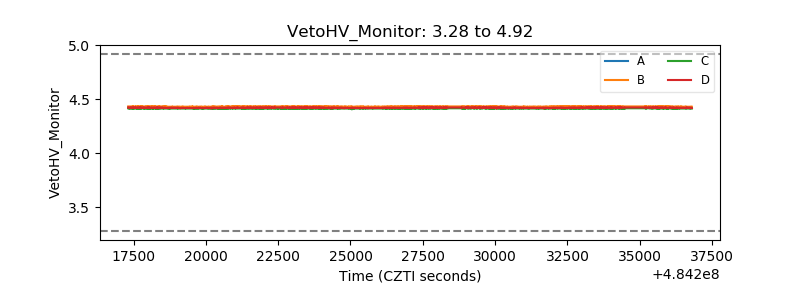 |
| Veto LLD | 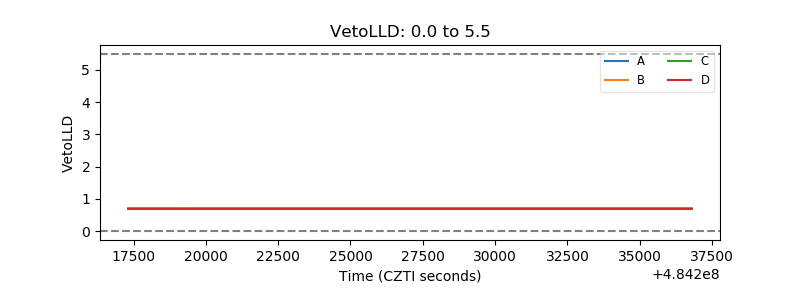 |
| Alpha Counter | 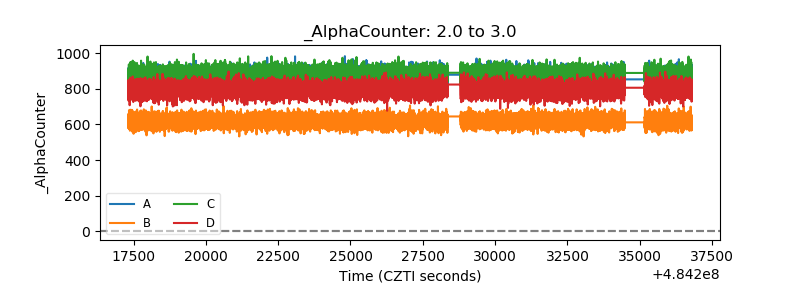 |
| _CPM_Rate | 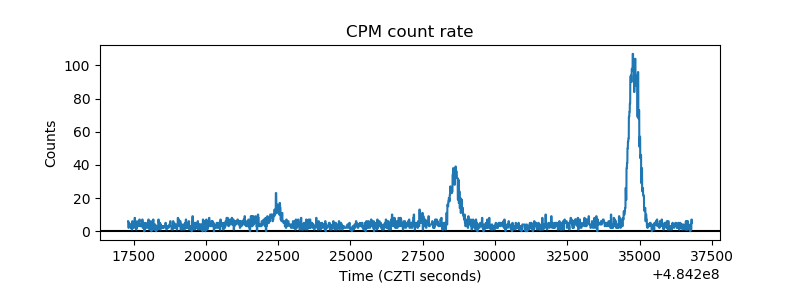 |
| CZT Counter | 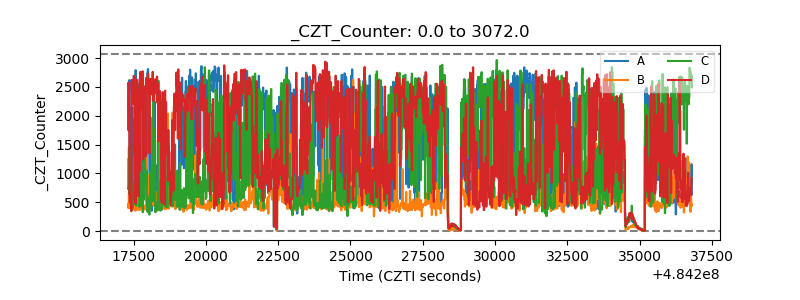 |
| +2.5 Volts monitor |  |
| +5 Volts monitor |  |
| _ROLL_ROT | 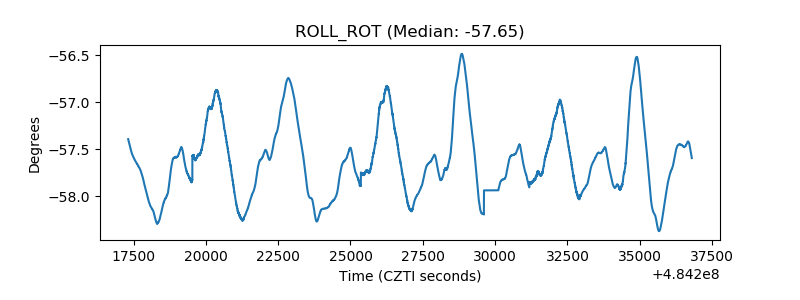 |
| _Roll_DEC | 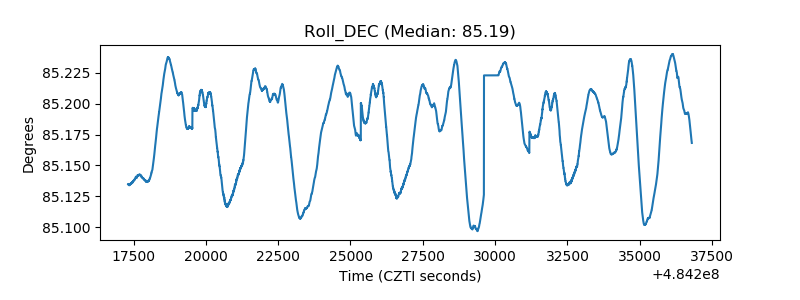 |
| _Roll_RA | 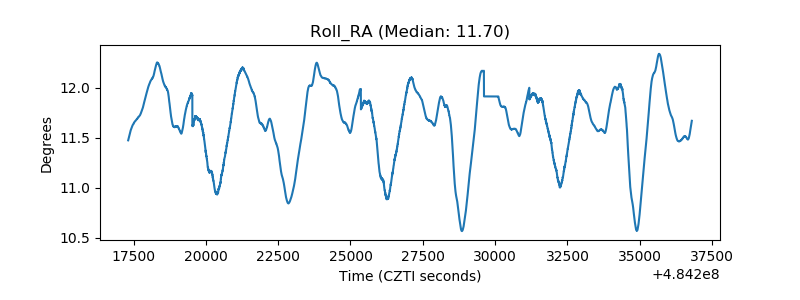 |
| Veto Counter | 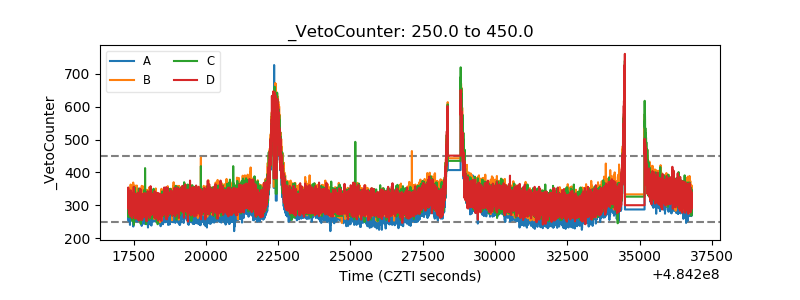 |