| Param | Original file | Final file |
|---|---|---|
| Filename | modeM0/AS1C09_011T06_9000006468_51955cztM0_level2.fits | modeM0/AS1C09_011T06_9000006468_51955cztM0_level2_quad_clean.evt |
| Size (bytes) | 766,414,080 | 79,646,400 |
| Size | 730.9 MB | 76.0 MB |
| Events in quadrant A | 6,733,743 | 498,126 |
| Events in quadrant B | 3,960,092 | 636,188 |
| Events in quadrant C | 10,369,231 | 346,810 |
| Events in quadrant D | 6,809,270 | 481,442 |
| Mode M0 | |||
|---|---|---|---|
| Quadrant | BADHDUFLAG | Total packets | Discarded packets |
| A | 0 | 24353 | 1 |
| B | 0 | 16296 | 2 |
| C | 0 | 35253 | 1 |
| D | 0 | 24729 | 1 |
| Mode M9 | |||
|---|---|---|---|
| Quadrant | BADHDUFLAG | Total packets | Discarded packets |
| A | 0 | 9 | 0 |
| B | 0 | 9 | 0 |
| C | 0 | 9 | 0 |
| D | 0 | 9 | 0 |
| Mode SS | |||
|---|---|---|---|
| Quadrant | BADHDUFLAG | Total packets | Discarded packets |
| A | 0 | 130 | 0 |
| B | 0 | 130 | 0 |
| C | 0 | 130 | 0 |
| D | 0 | 130 | 0 |
| Quadrant | Total seconds | Saturated seconds | Saturation percentage |
|---|---|---|---|
| A | 6432 | 1222 | 18.998756% |
| B | 6432 | 207 | 3.218284% |
| C | 6432 | 2936 | 45.646766% |
| D | 6432 | 920 | 14.303483% |
Noise dominated data is calculated using 1-second bins in cleaned event files. If a bin has >2000 counts, and if more than 50% of those come from <1% of pixels, then it is considered to be noise-dominated and hence unusable.
| Quadrant | # 1 sec bins | Bins with >0 counts | Bins with >2000 counts | High rate bins dominated by noise | Noise dominated (total time) | Noise dominated (detector-on time) | Marked lightcurve |
|---|---|---|---|---|---|---|---|
| A | 7307 | 6432 | 855 | 855 | 11.70% | 13.29% | 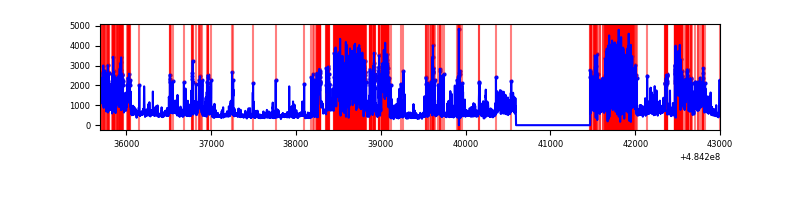 |
| B | 7307 | 6433 | 87 | 87 | 1.19% | 1.35% | 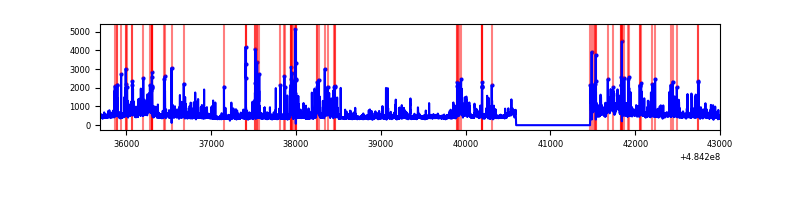 |
| C | 7307 | 6432 | 2225 | 2225 | 30.45% | 34.59% | 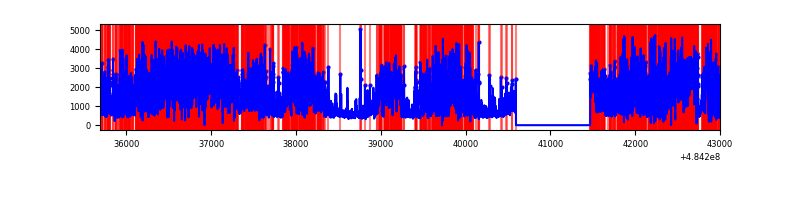 |
| D | 7307 | 6433 | 795 | 795 | 10.88% | 12.36% | 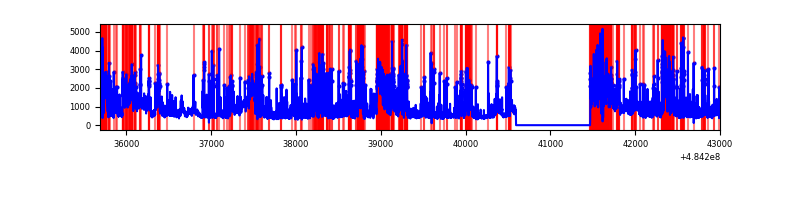 |
Top three noisy pixels from each quadrant. If the there are fewer than three noisy pixels in the level2.evt file, extra rows are filled as -1
| Pixel properties | Quadrant properties | ||||||
|---|---|---|---|---|---|---|---|
| Quadrant | DetID | PixID | Counts | Sigma | Mean | Median | Sigma |
| A | 4 | 159 | 1263017 | 8164.89 | 615 | 599 | 154.6 |
| A | 7 | 174 | 745278 | 4816.33 | 615 | 599 | 154.6 |
| A | 7 | 64 | 692510 | 4475.04 | 615 | 599 | 154.6 |
| B | 7 | 252 | 147198 | 1025.66 | 665 | 642 | 142.9 |
| B | 4 | 170 | 129201 | 899.71 | 665 | 642 | 142.9 |
| B | 10 | 247 | 126658 | 881.91 | 665 | 642 | 142.9 |
| C | 15 | 224 | 6282272 | 44843.69 | 500 | 496 | 140.1 |
| C | 4 | 5 | 816567 | 5825.68 | 500 | 496 | 140.1 |
| C | 14 | 245 | 402382 | 2868.94 | 500 | 496 | 140.1 |
| D | 6 | 42 | 1090364 | 6319.14 | 615 | 588 | 172.5 |
| D | 2 | 172 | 829240 | 4805.0 | 615 | 588 | 172.5 |
| D | 12 | 16 | 614295 | 3558.62 | 615 | 588 | 172.5 |
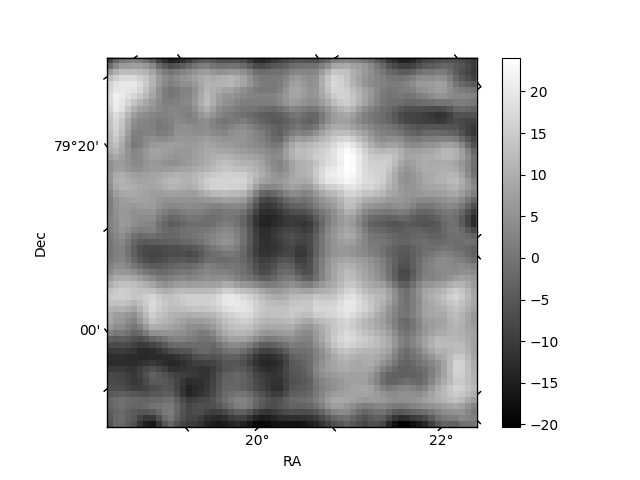
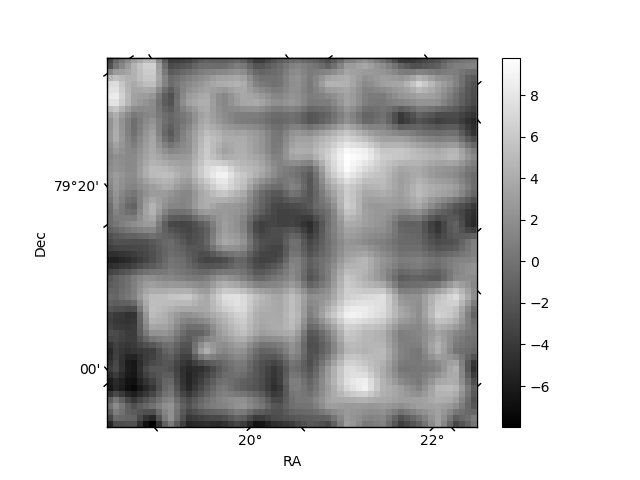
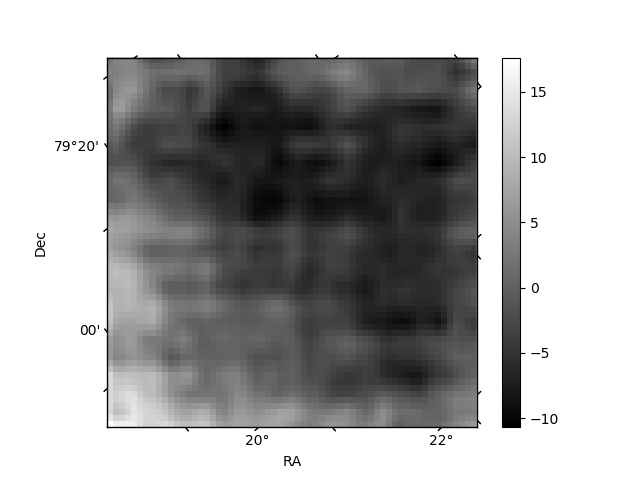
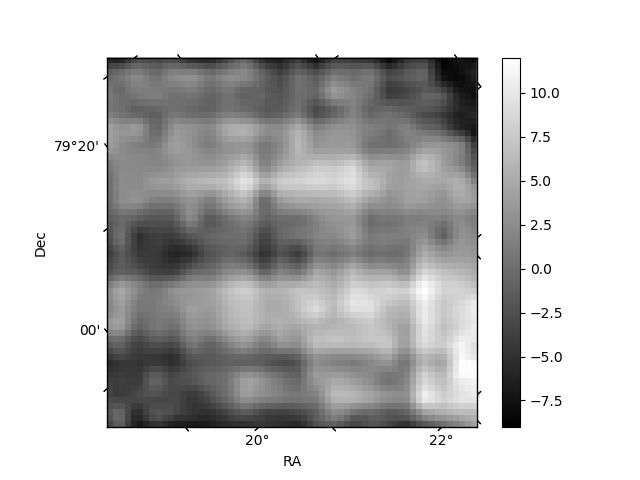
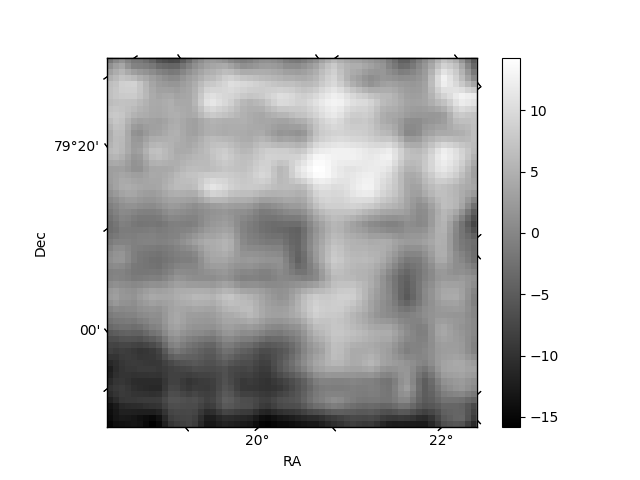
Histogram calculated using DETX and DETY for each event in the final _common_clean file
| Quadrant A | 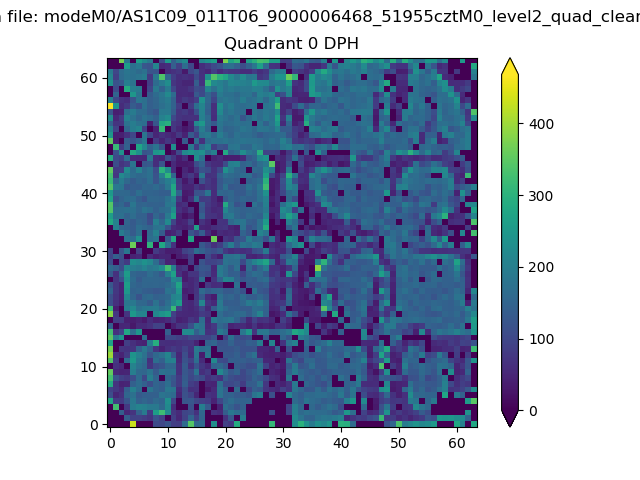 |
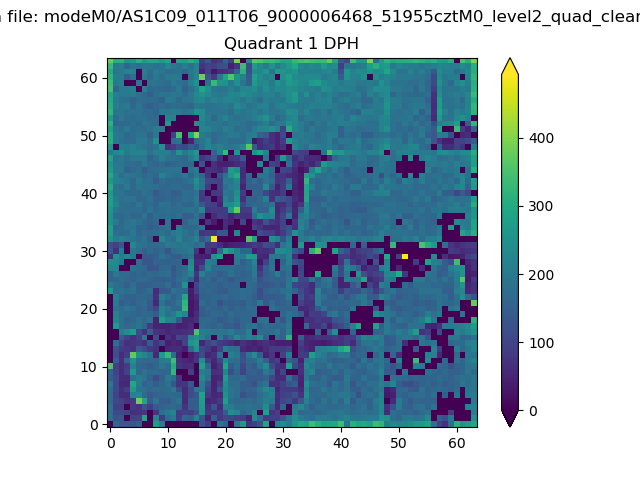 |
Quadrant B |
|---|---|---|---|
| Quadrant D | 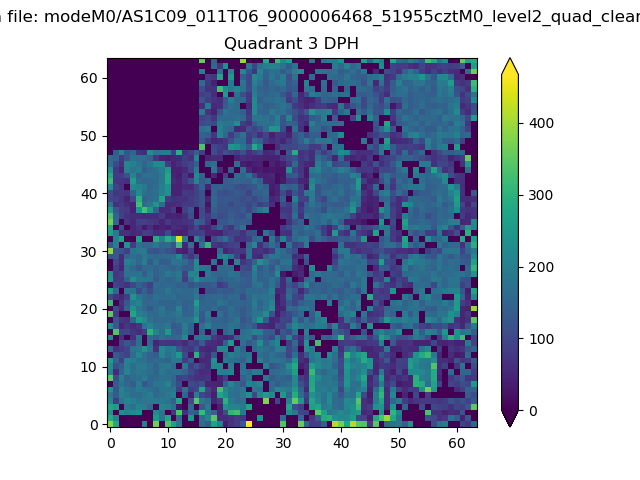 |
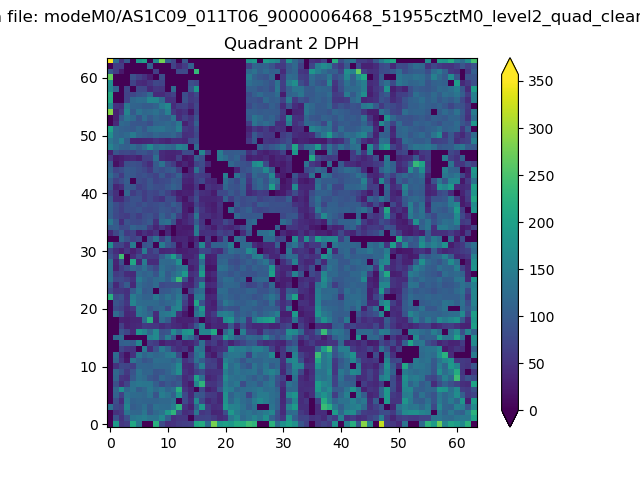 |
Quadrant C |
| Plot type | Count rate plots | Images |
|---|---|---|
| Comparison with Poisson distribution Blue bars denote a histogram of data divided into 1 sec bins. Red curve is a Poisson curve with rate = median count rate of data. |
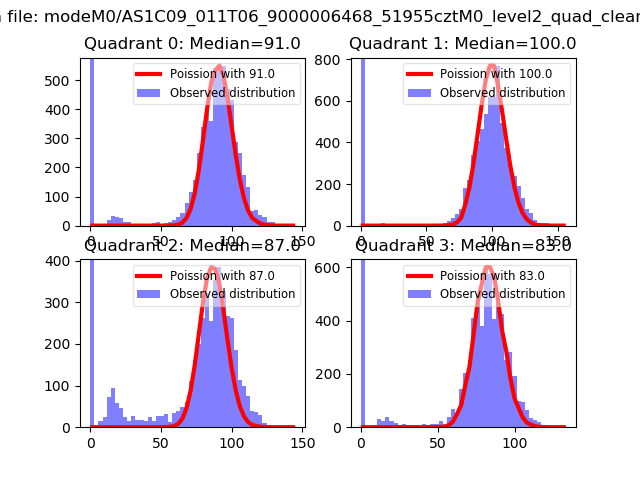 |
 |
| Quadrant-wise count rates Data is divided into 100 sec bins |
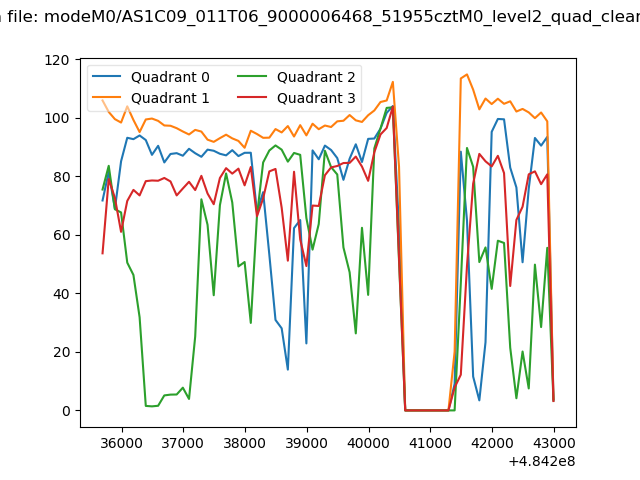 |
|
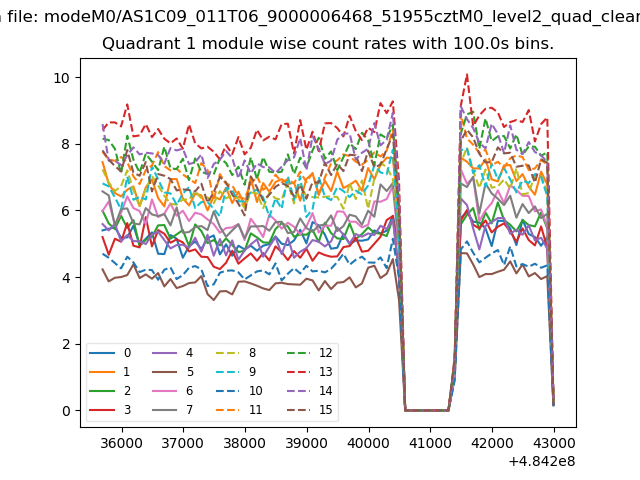
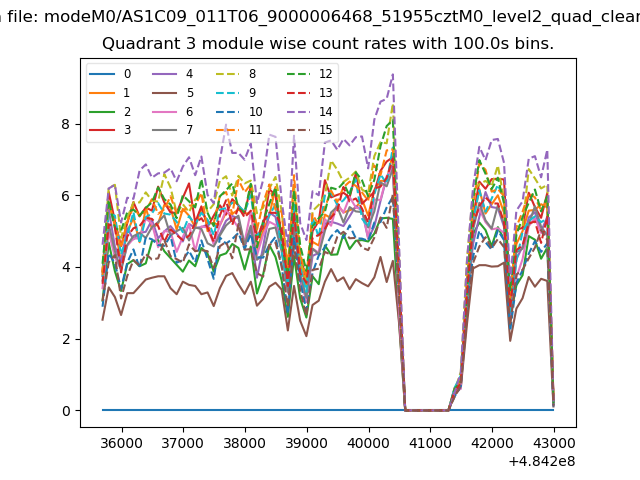
| Module-wise count rates for Quadrant A Data is divided into 100 sec bins |
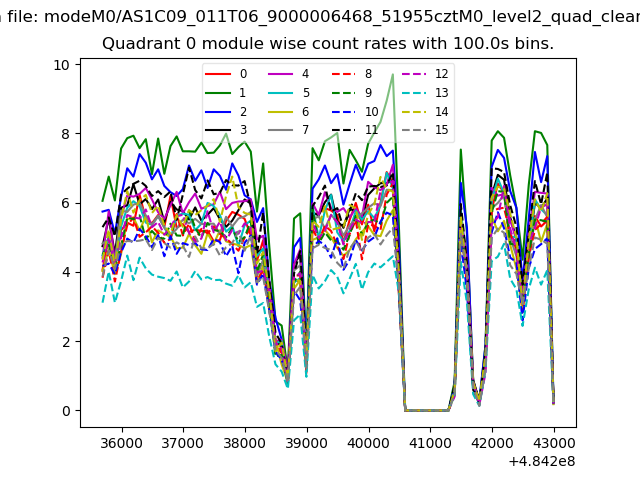 |
 |
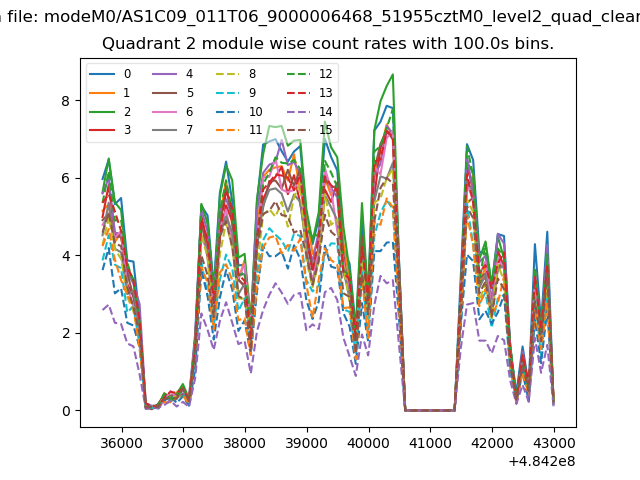
| Module-wise count rates for Quadrant B Data is divided into 100 sec bins |
 |
 |
| Module-wise count rates for Quadrant C Data is divided into 100 sec bins |
 |
 |
| Module-wise count rates for Quadrant D Data is divided into 100 sec bins |
 |
 |
| Parameter | Plot |
|---|---|
| CZT HV Monitor | 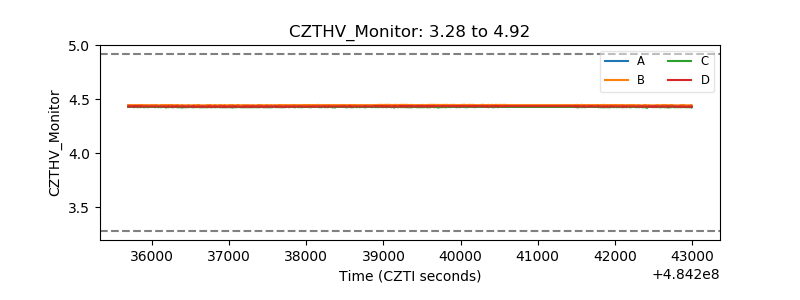 |
| D_VDD | 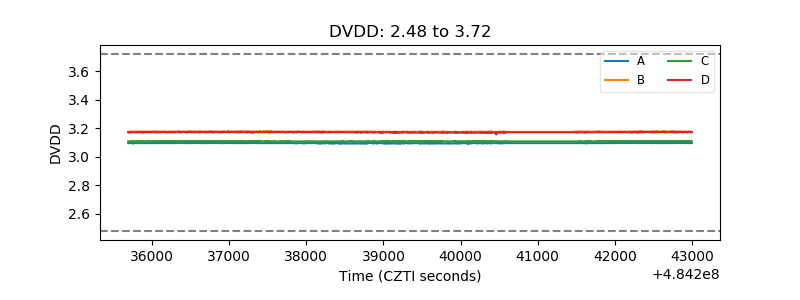 |
| Temperature 1 | 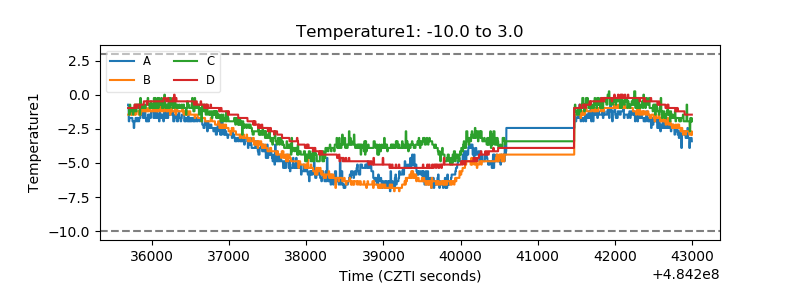 |
| Veto HV Monitor |  |
| Veto LLD | 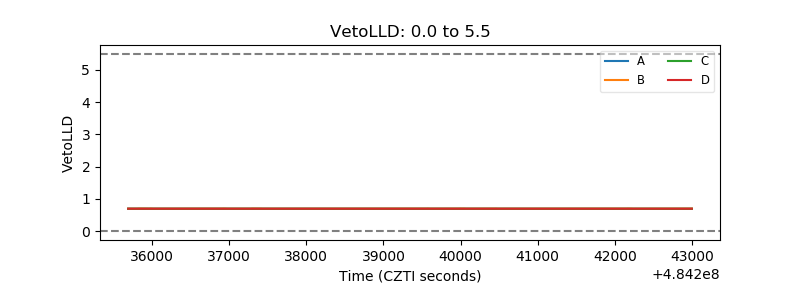 |
| Alpha Counter | 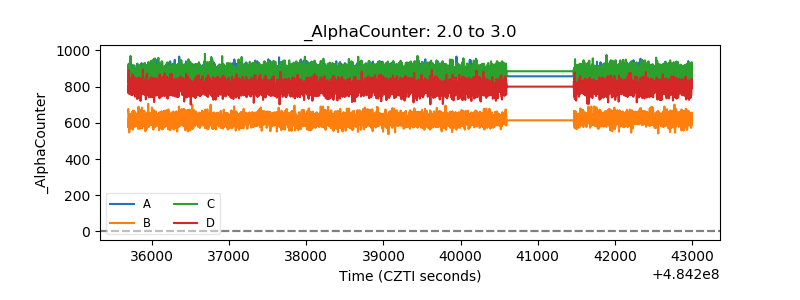 |
| _CPM_Rate | 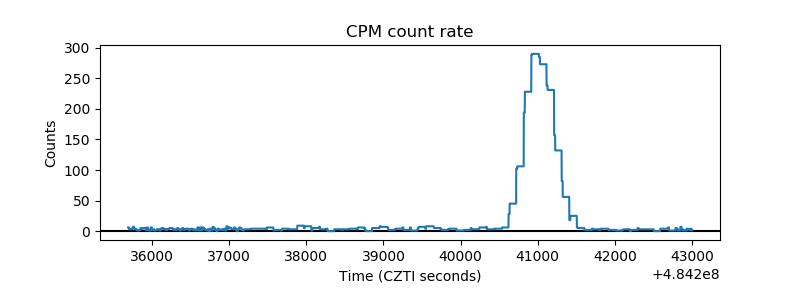 |
| CZT Counter | 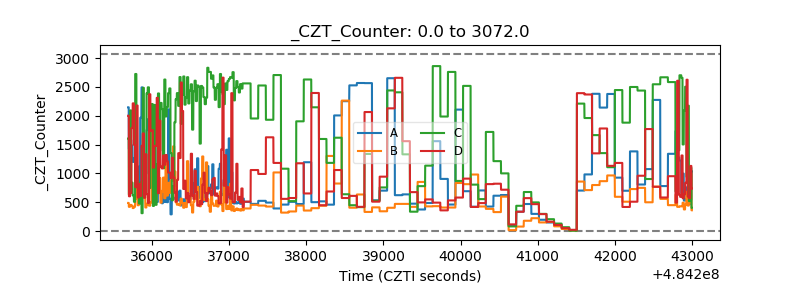 |
| +2.5 Volts monitor | 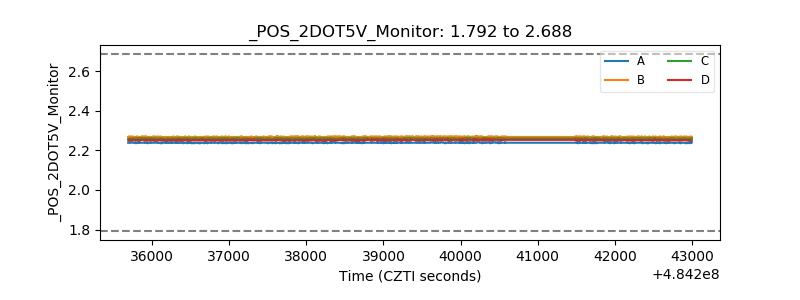 |
| +5 Volts monitor |  |
| _ROLL_ROT | 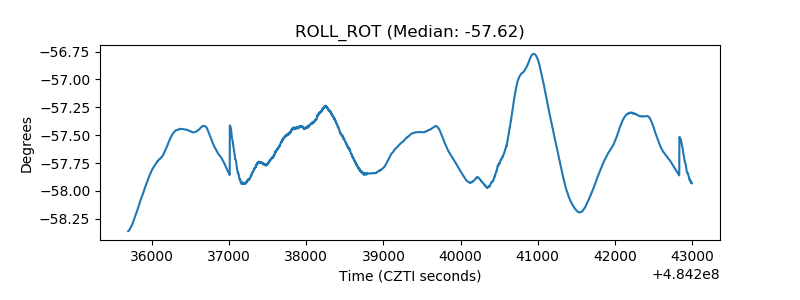 |
| _Roll_DEC | 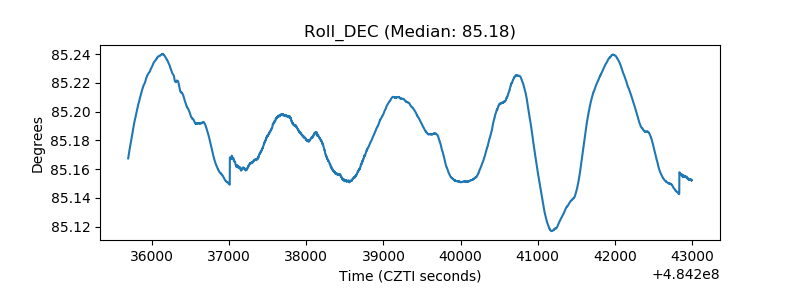 |
| _Roll_RA | 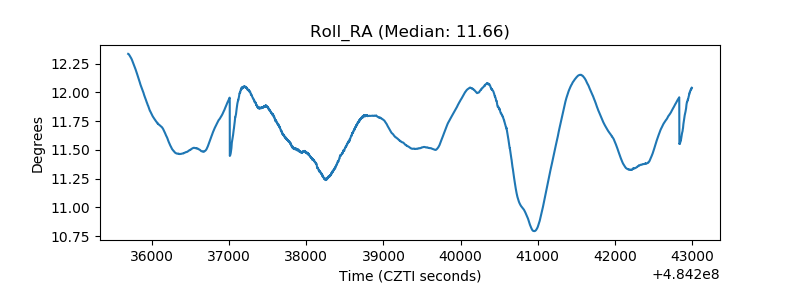 |
| Veto Counter | 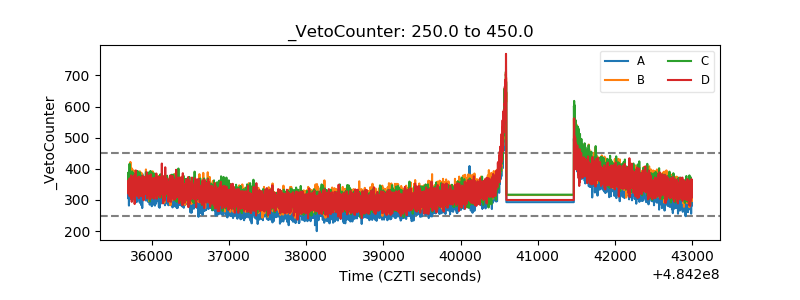 |