| Param | Original file | Final file |
|---|---|---|
| Filename | modeM0/AS1C09_011T06_9000006468_51957cztM0_level2.fits | modeM0/AS1C09_011T06_9000006468_51957cztM0_level2_quad_clean.evt |
| Size (bytes) | 835,948,800 | 76,006,080 |
| Size | 797.2 MB | 72.5 MB |
| Events in quadrant A | 8,554,035 | 442,393 |
| Events in quadrant B | 4,465,055 | 588,642 |
| Events in quadrant C | 8,706,257 | 420,721 |
| Events in quadrant D | 8,735,152 | 412,455 |
| Mode M0 | |||
|---|---|---|---|
| Quadrant | BADHDUFLAG | Total packets | Discarded packets |
| A | 0 | 29772 | 1 |
| B | 0 | 17687 | 1 |
| C | 0 | 30209 | 1 |
| D | 0 | 30318 | 1 |
| Mode M9 | |||
|---|---|---|---|
| Quadrant | BADHDUFLAG | Total packets | Discarded packets |
| A | 0 | 11 | 0 |
| B | 0 | 11 | 0 |
| C | 0 | 11 | 0 |
| D | 0 | 11 | 0 |
| Mode SS | |||
|---|---|---|---|
| Quadrant | BADHDUFLAG | Total packets | Discarded packets |
| A | 0 | 126 | 0 |
| B | 0 | 126 | 0 |
| C | 0 | 126 | 0 |
| D | 0 | 126 | 0 |
| Quadrant | Total seconds | Saturated seconds | Saturation percentage |
|---|---|---|---|
| A | 6257 | 1919 | 30.669650% |
| B | 6257 | 560 | 8.949976% |
| C | 6257 | 2070 | 33.082947% |
| D | 6258 | 1675 | 26.765740% |
Noise dominated data is calculated using 1-second bins in cleaned event files. If a bin has >2000 counts, and if more than 50% of those come from <1% of pixels, then it is considered to be noise-dominated and hence unusable.
| Quadrant | # 1 sec bins | Bins with >0 counts | Bins with >2000 counts | High rate bins dominated by noise | Noise dominated (total time) | Noise dominated (detector-on time) | Marked lightcurve |
|---|---|---|---|---|---|---|---|
| A | 7287 | 6258 | 1400 | 1400 | 19.21% | 22.37% | 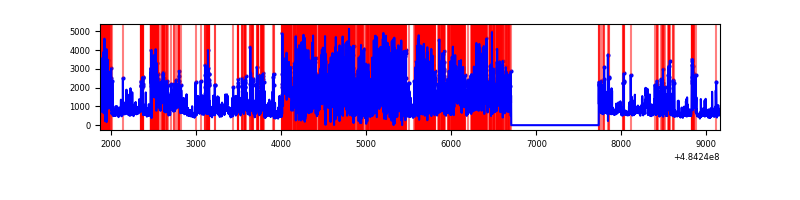 |
| B | 7287 | 6258 | 372 | 372 | 5.10% | 5.94% | 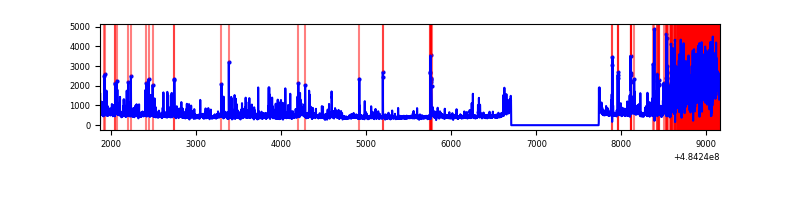 |
| C | 7287 | 6258 | 1601 | 1601 | 21.97% | 25.58% | 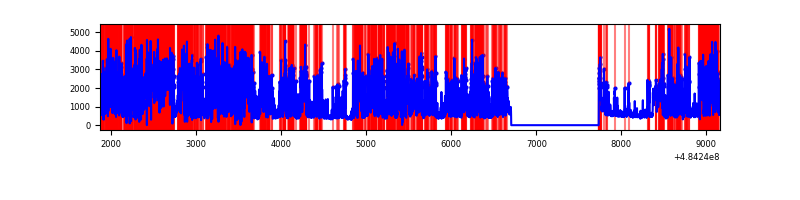 |
| D | 7288 | 6259 | 1612 | 1612 | 22.12% | 25.75% | 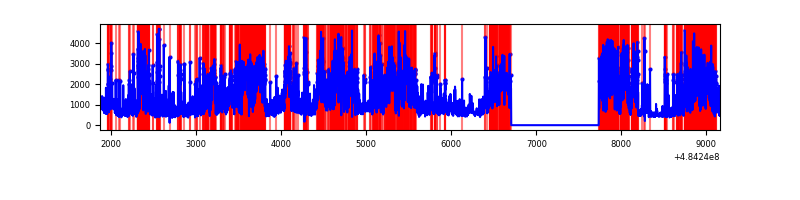 |
Top three noisy pixels from each quadrant. If the there are fewer than three noisy pixels in the level2.evt file, extra rows are filled as -1
| Pixel properties | Quadrant properties | ||||||
|---|---|---|---|---|---|---|---|
| Quadrant | DetID | PixID | Counts | Sigma | Mean | Median | Sigma |
| A | 7 | 174 | 3314465 | 23680.6 | 554 | 539 | 139.9 |
| A | 7 | 64 | 1504812 | 10749.21 | 554 | 539 | 139.9 |
| A | 12 | 3 | 235377 | 1678.1 | 554 | 539 | 139.9 |
| B | 10 | 41 | 1177190 | 8768.04 | 628 | 607 | 134.2 |
| B | 4 | 170 | 92320 | 683.46 | 628 | 607 | 134.2 |
| B | 0 | 216 | 85850 | 635.24 | 628 | 607 | 134.2 |
| C | 15 | 224 | 5348758 | 35314.0 | 542 | 534 | 151.4 |
| C | 4 | 5 | 388619 | 2562.5 | 542 | 534 | 151.4 |
| C | 13 | 3 | 299418 | 1973.51 | 542 | 534 | 151.4 |
| D | 6 | 42 | 2043267 | 12704.74 | 562 | 536 | 160.8 |
| D | 12 | 16 | 1675474 | 10417.26 | 562 | 536 | 160.8 |
| D | 2 | 172 | 900002 | 5594.22 | 562 | 536 | 160.8 |
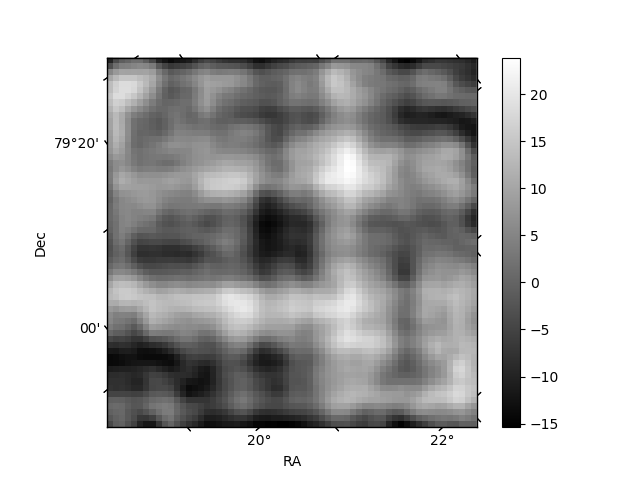
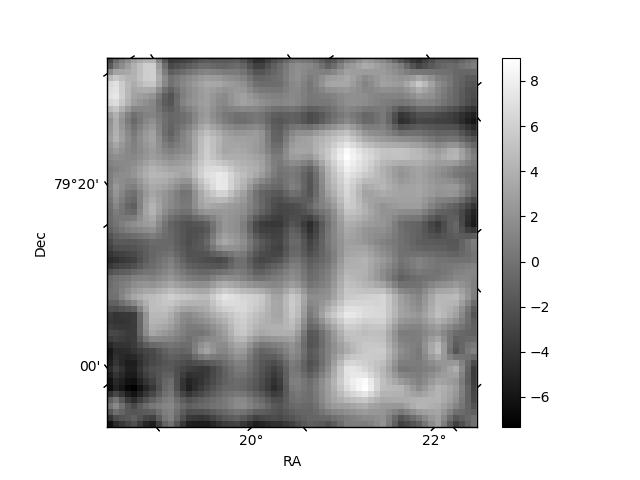
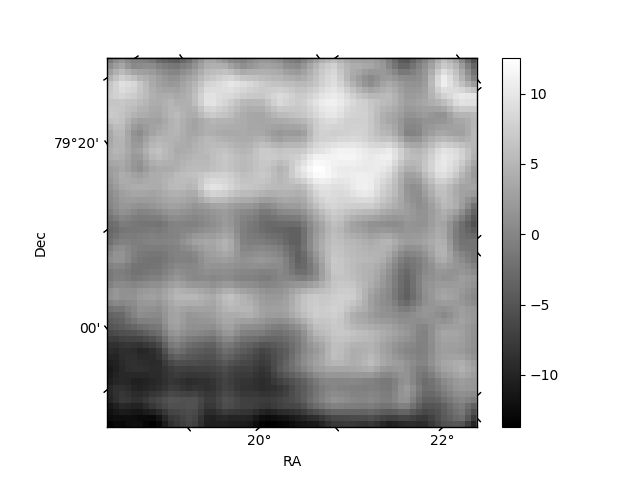
Histogram calculated using DETX and DETY for each event in the final _common_clean file
| Quadrant A | 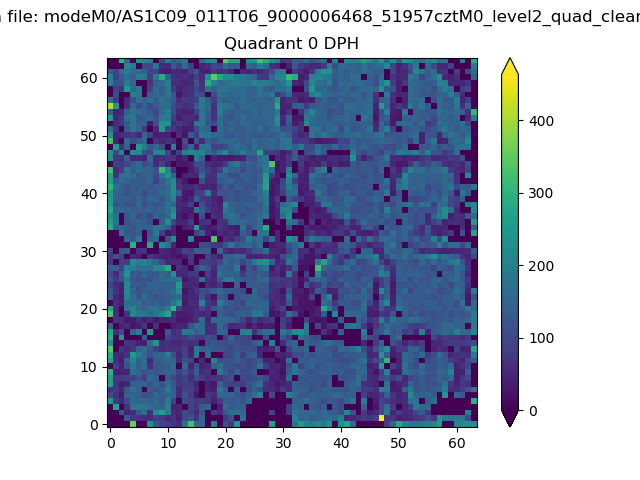 |
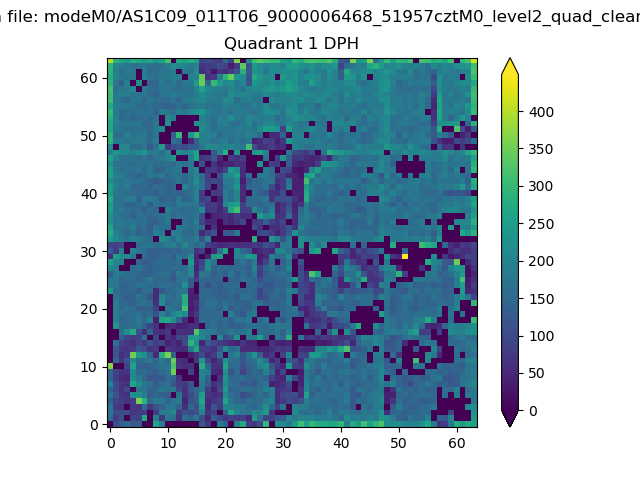 |
Quadrant B |
|---|---|---|---|
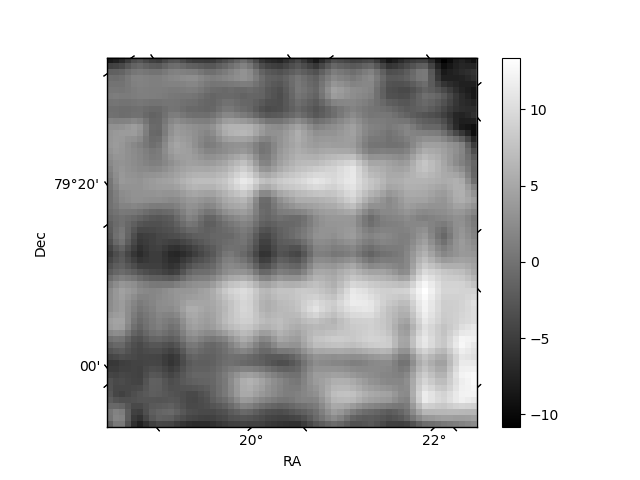
| Quadrant D | 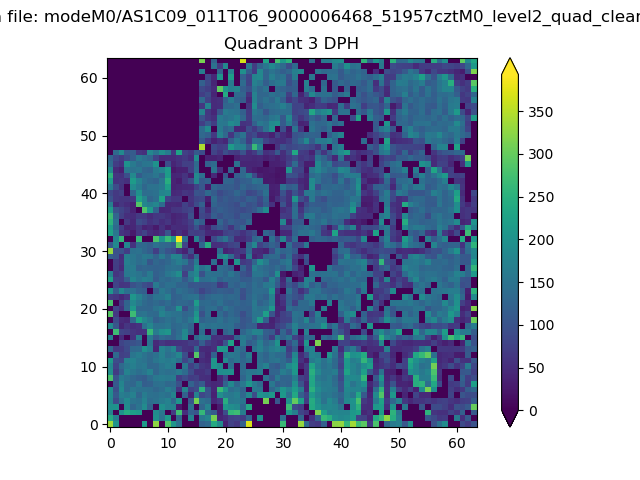 |
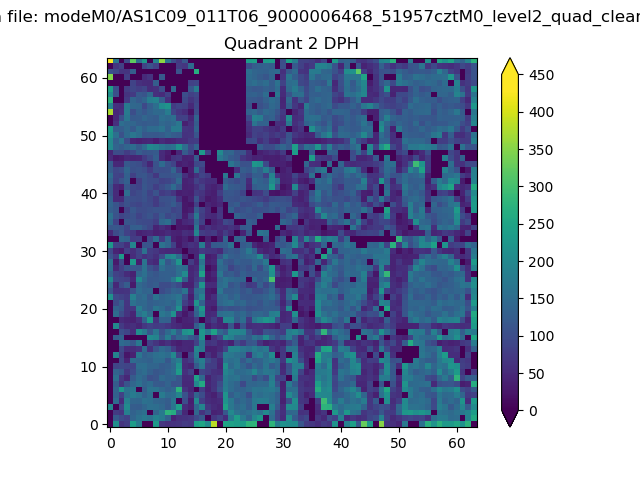 |
Quadrant C |
| Plot type | Count rate plots | Images |
|---|---|---|
| Comparison with Poisson distribution Blue bars denote a histogram of data divided into 1 sec bins. Red curve is a Poisson curve with rate = median count rate of data. |
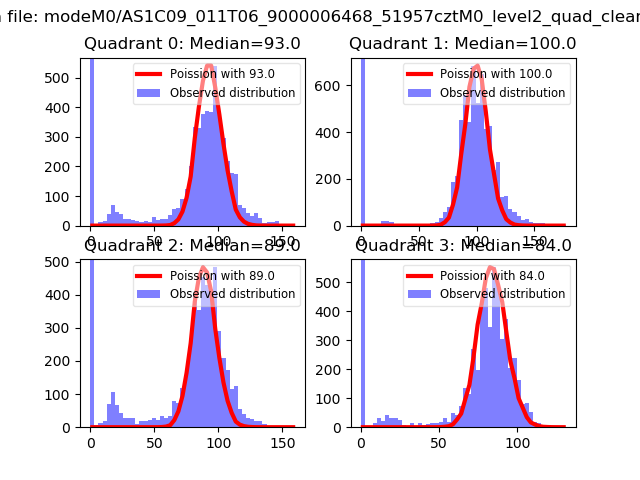 |
 |
| Quadrant-wise count rates Data is divided into 100 sec bins |
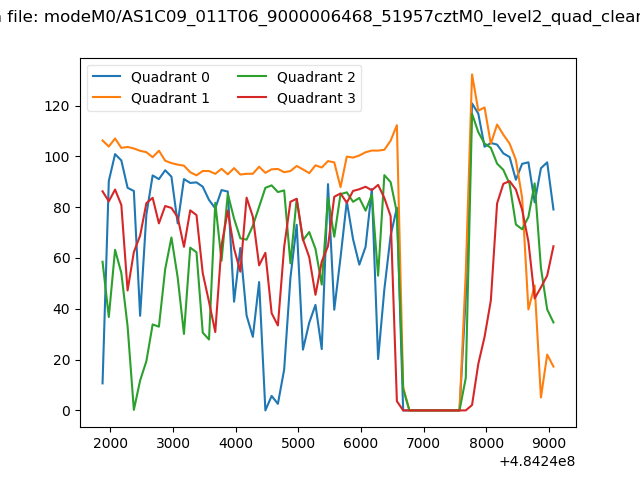 |
|
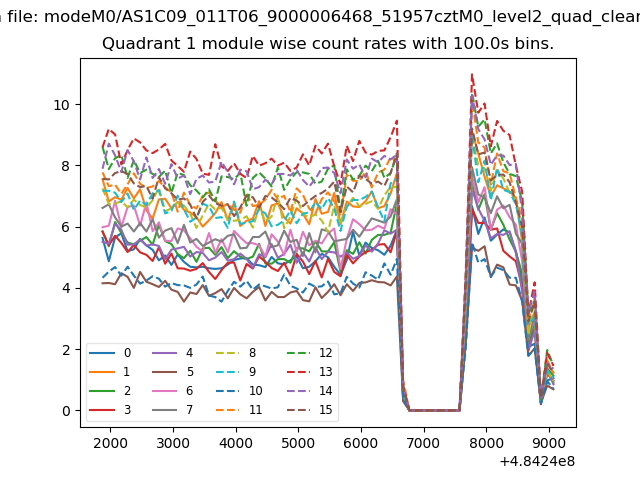
| Module-wise count rates for Quadrant A Data is divided into 100 sec bins |
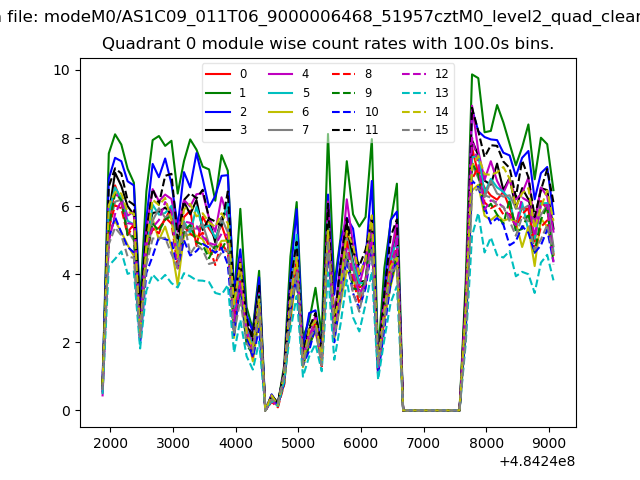 |
 |
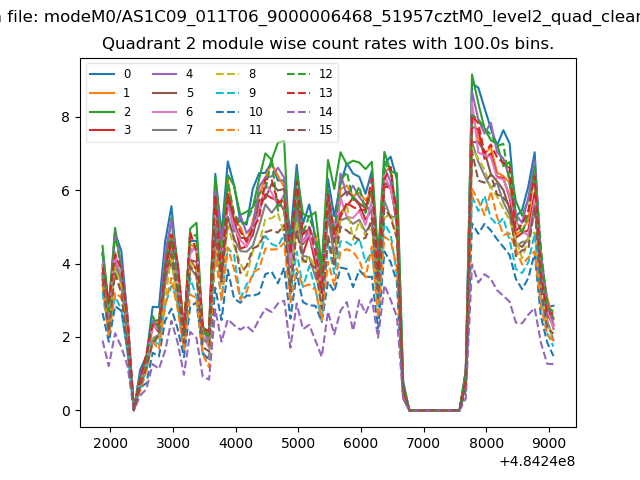
| Module-wise count rates for Quadrant B Data is divided into 100 sec bins |
 |
 |
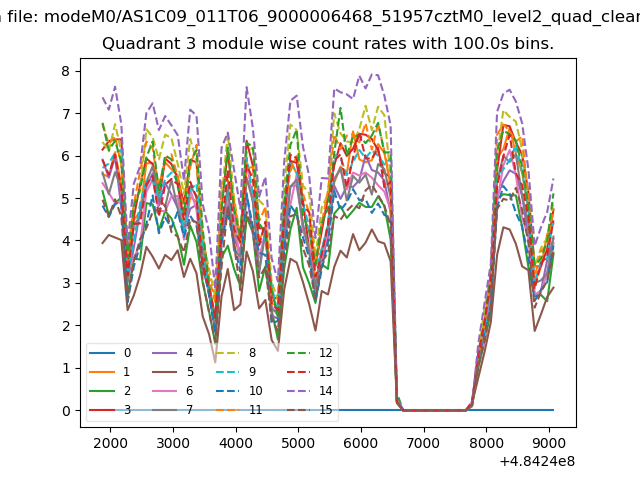
| Module-wise count rates for Quadrant C Data is divided into 100 sec bins |
 |
 |
| Module-wise count rates for Quadrant D Data is divided into 100 sec bins |
 |
 |
| Parameter | Plot |
|---|---|
| CZT HV Monitor | 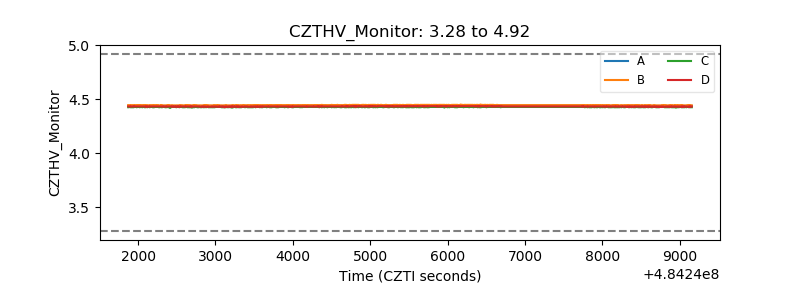 |
| D_VDD | 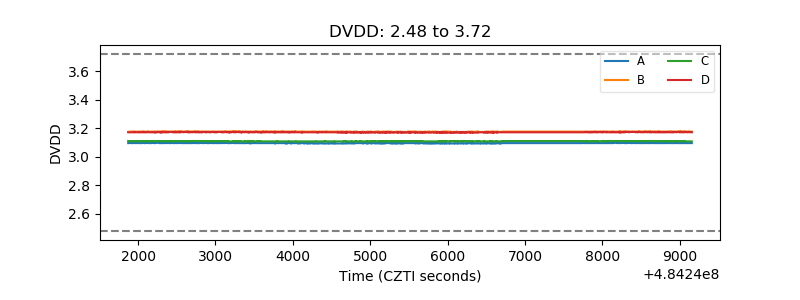 |
| Temperature 1 | 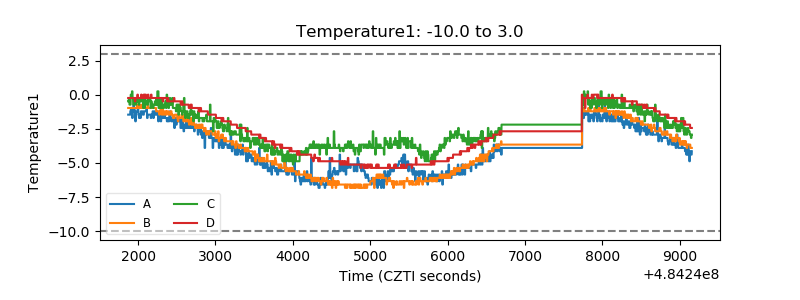 |
| Veto HV Monitor | 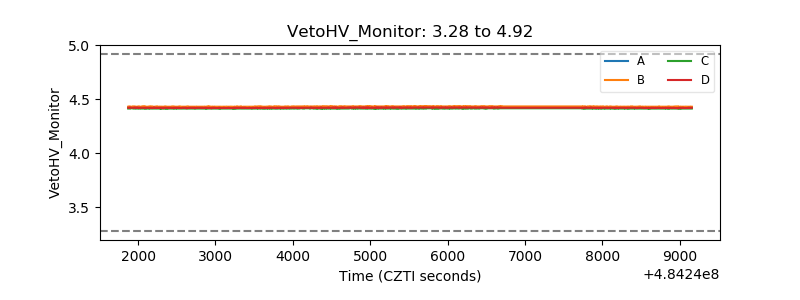 |
| Veto LLD | 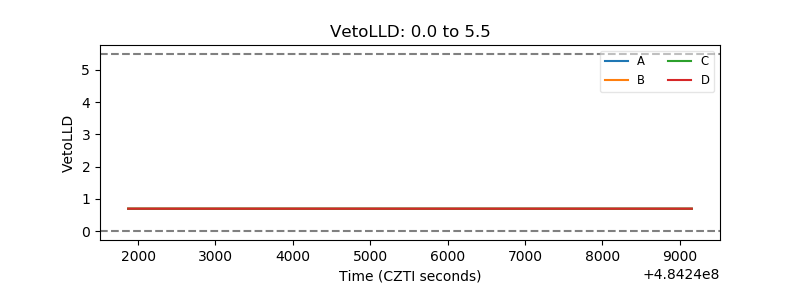 |
| Alpha Counter | 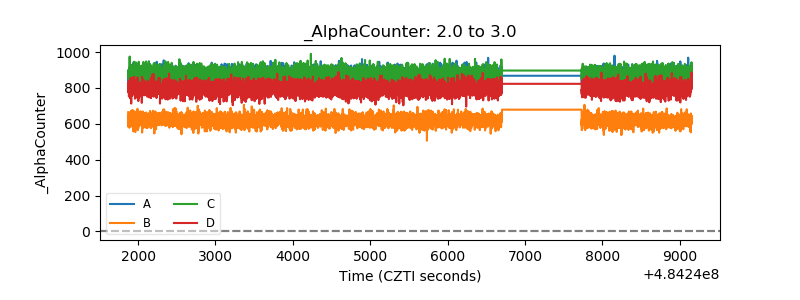 |
| _CPM_Rate | 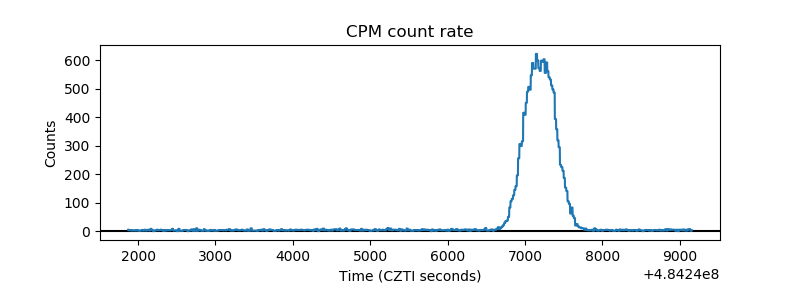 |
| CZT Counter | 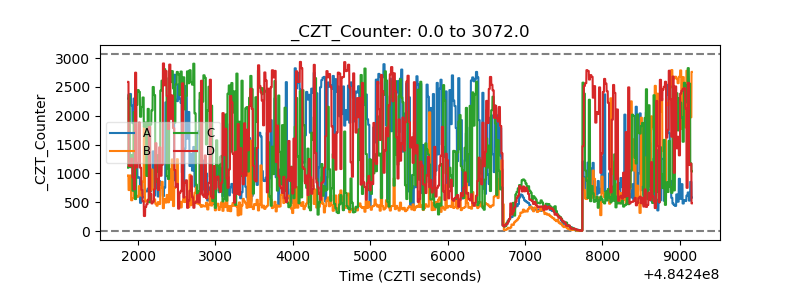 |
| +2.5 Volts monitor | 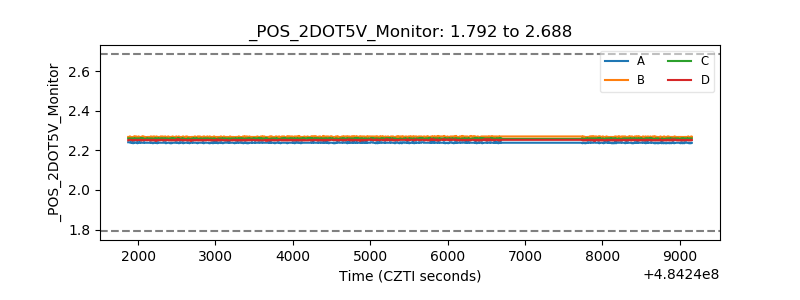 |
| +5 Volts monitor | 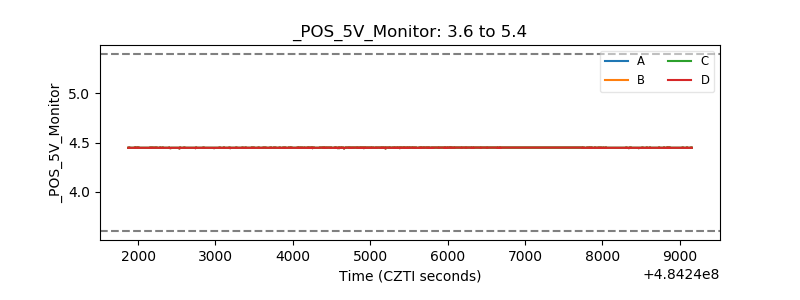 |
| _ROLL_ROT | 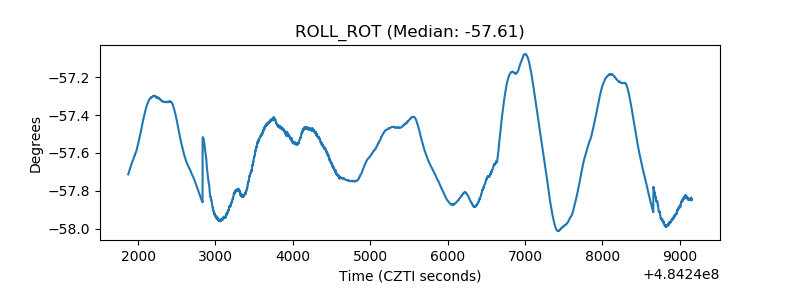 |
| _Roll_DEC | 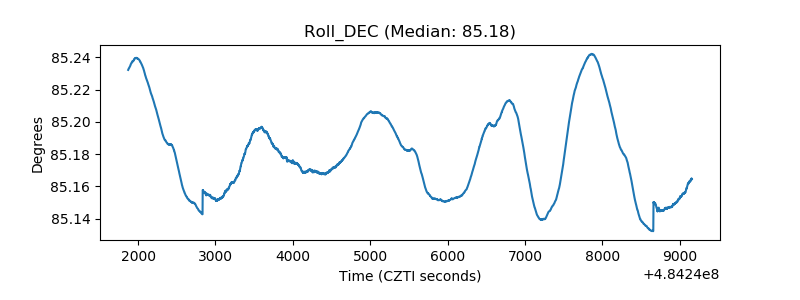 |
| _Roll_RA | 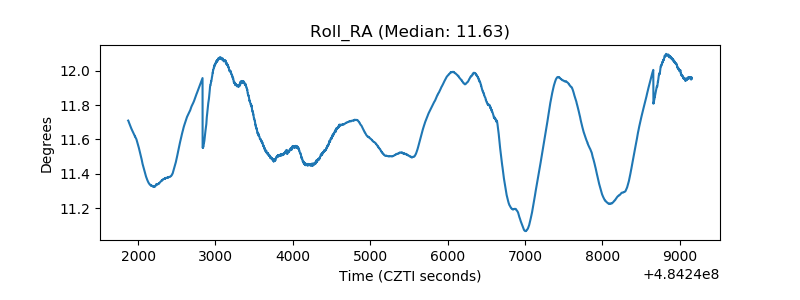 |
| Veto Counter | 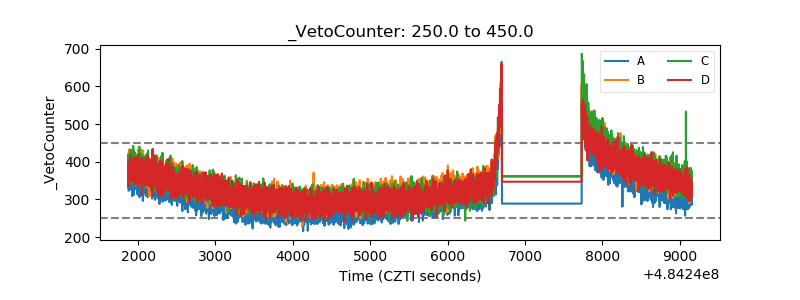 |