| Param | Original file | Final file |
|---|---|---|
| Filename | modeM0/AS1C09_011T06_9000006468_51958cztM0_level2.fits | modeM0/AS1C09_011T06_9000006468_51958cztM0_level2_quad_clean.evt |
| Size (bytes) | 767,367,360 | 80,657,280 |
| Size | 731.8 MB | 76.9 MB |
| Events in quadrant A | 5,010,297 | 567,410 |
| Events in quadrant B | 5,813,757 | 565,713 |
| Events in quadrant C | 8,580,010 | 417,070 |
| Events in quadrant D | 8,519,737 | 456,173 |
| Mode M0 | |||
|---|---|---|---|
| Quadrant | BADHDUFLAG | Total packets | Discarded packets |
| A | 0 | 19174 | 1 |
| B | 0 | 21567 | 1 |
| C | 0 | 29802 | 1 |
| D | 0 | 29548 | 3 |
| Mode M9 | |||
|---|---|---|---|
| Quadrant | BADHDUFLAG | Total packets | Discarded packets |
| A | 0 | 11 | 0 |
| B | 0 | 11 | 0 |
| C | 0 | 11 | 0 |
| D | 0 | 11 | 0 |
| Mode SS | |||
|---|---|---|---|
| Quadrant | BADHDUFLAG | Total packets | Discarded packets |
| A | 0 | 128 | 0 |
| B | 0 | 128 | 0 |
| C | 0 | 128 | 0 |
| D | 0 | 128 | 0 |
| Quadrant | Total seconds | Saturated seconds | Saturation percentage |
|---|---|---|---|
| A | 6233 | 427 | 6.850634% |
| B | 6234 | 1006 | 16.137312% |
| C | 6234 | 2115 | 33.926853% |
| D | 6233 | 1375 | 22.060003% |
Noise dominated data is calculated using 1-second bins in cleaned event files. If a bin has >2000 counts, and if more than 50% of those come from <1% of pixels, then it is considered to be noise-dominated and hence unusable.
| Quadrant | # 1 sec bins | Bins with >0 counts | Bins with >2000 counts | High rate bins dominated by noise | Noise dominated (total time) | Noise dominated (detector-on time) | Marked lightcurve |
|---|---|---|---|---|---|---|---|
| A | 7338 | 6234 | 283 | 283 | 3.86% | 4.54% | 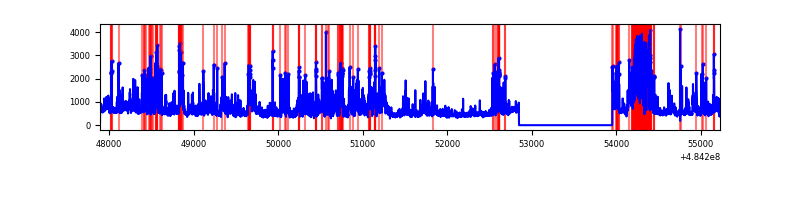 |
| B | 7339 | 6235 | 738 | 738 | 10.06% | 11.84% | 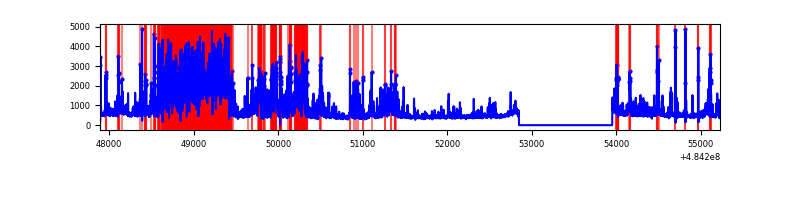 |
| C | 7339 | 6234 | 1530 | 1530 | 20.85% | 24.54% | 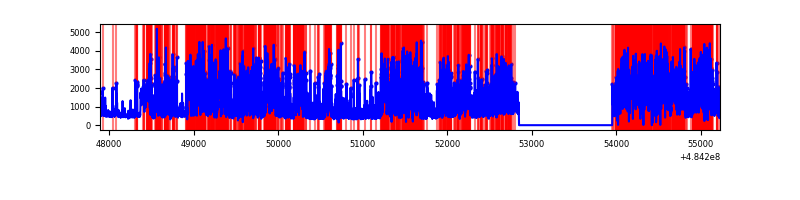 |
| D | 7338 | 6234 | 1418 | 1418 | 19.32% | 22.75% | 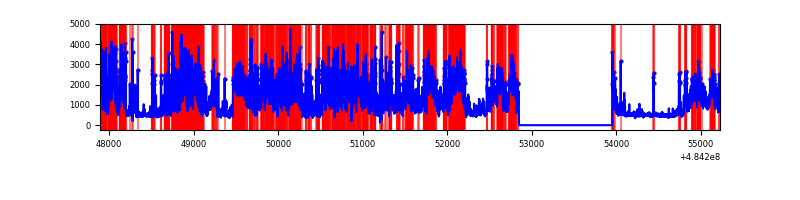 |
Top three noisy pixels from each quadrant. If the there are fewer than three noisy pixels in the level2.evt file, extra rows are filled as -1
| Pixel properties | Quadrant properties | ||||||
|---|---|---|---|---|---|---|---|
| Quadrant | DetID | PixID | Counts | Sigma | Mean | Median | Sigma |
| A | 7 | 64 | 1610914 | 10103.7 | 640 | 623 | 159.4 |
| A | 4 | 249 | 170801 | 1067.77 | 640 | 623 | 159.4 |
| A | 4 | 3 | 145473 | 908.86 | 640 | 623 | 159.4 |
| B | 10 | 41 | 2114391 | 16275.27 | 616 | 597 | 129.9 |
| B | 8 | 3 | 171038 | 1312.32 | 616 | 597 | 129.9 |
| B | 8 | 234 | 125749 | 963.61 | 616 | 597 | 129.9 |
| C | 15 | 224 | 5265721 | 35832.31 | 527 | 521 | 146.9 |
| C | 4 | 5 | 505902 | 3439.37 | 527 | 521 | 146.9 |
| C | 13 | 3 | 159981 | 1085.2 | 527 | 521 | 146.9 |
| D | 6 | 42 | 2714486 | 16351.97 | 589 | 562 | 166.0 |
| D | 12 | 16 | 1658756 | 9990.97 | 589 | 562 | 166.0 |
| D | 2 | 172 | 631873 | 3803.78 | 589 | 562 | 166.0 |
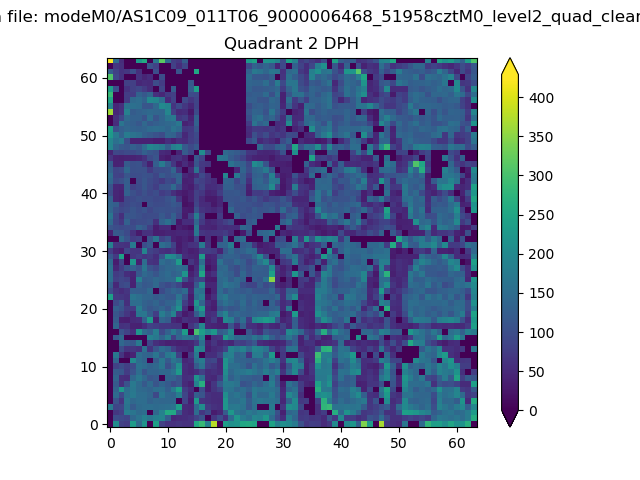
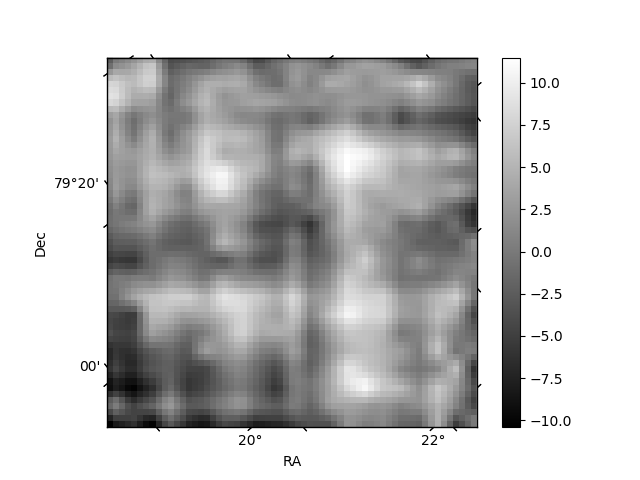
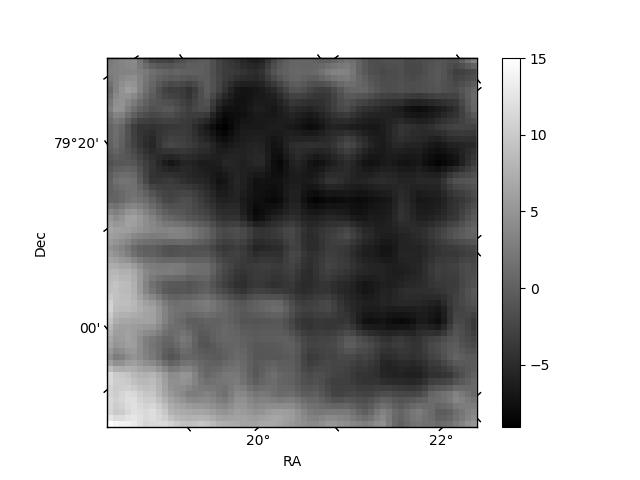
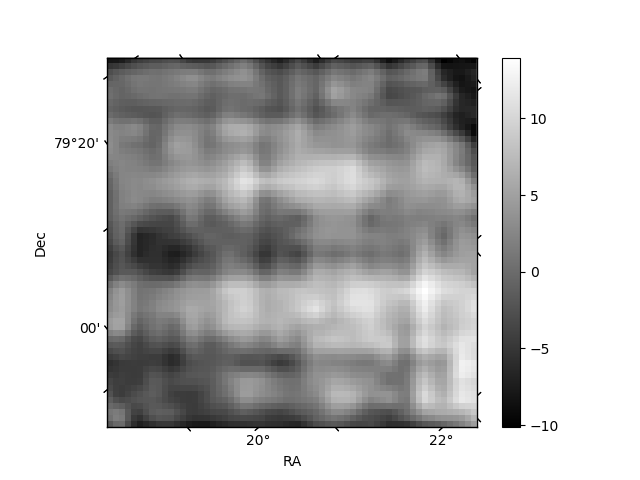
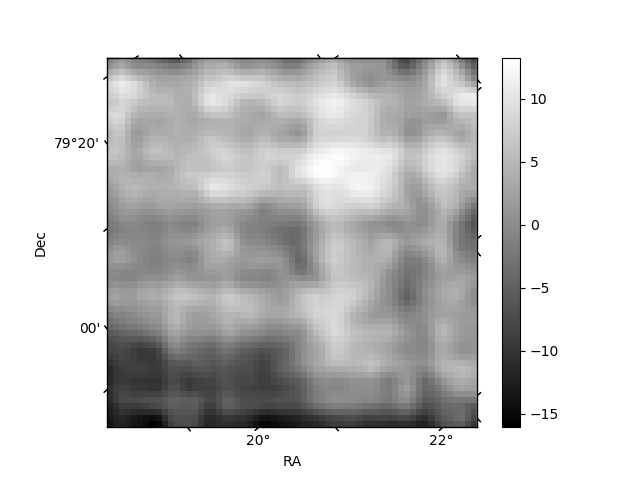
Histogram calculated using DETX and DETY for each event in the final _common_clean file
| Quadrant A | 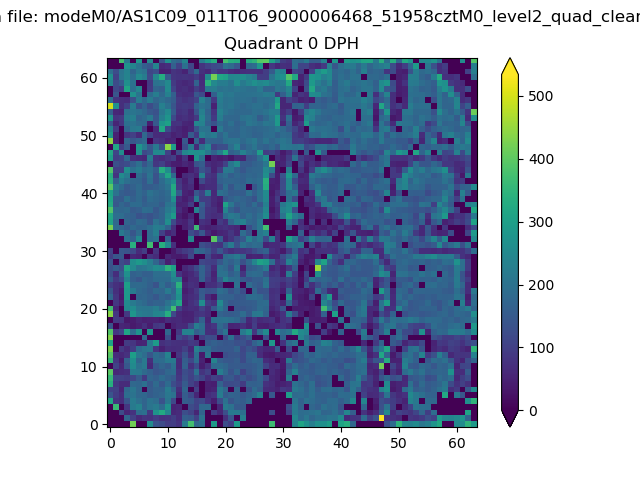 |
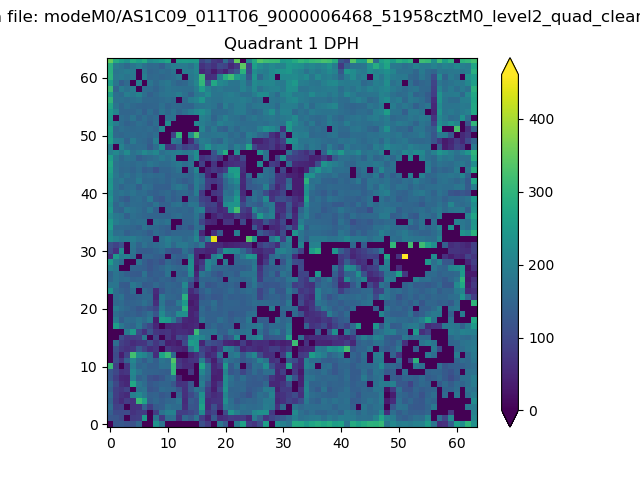 |
Quadrant B |
|---|---|---|---|
| Quadrant D | 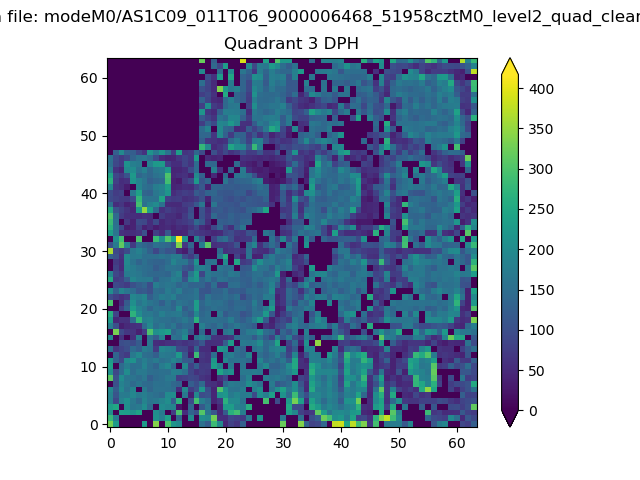 |
 |
Quadrant C |
| Plot type | Count rate plots | Images |
|---|---|---|
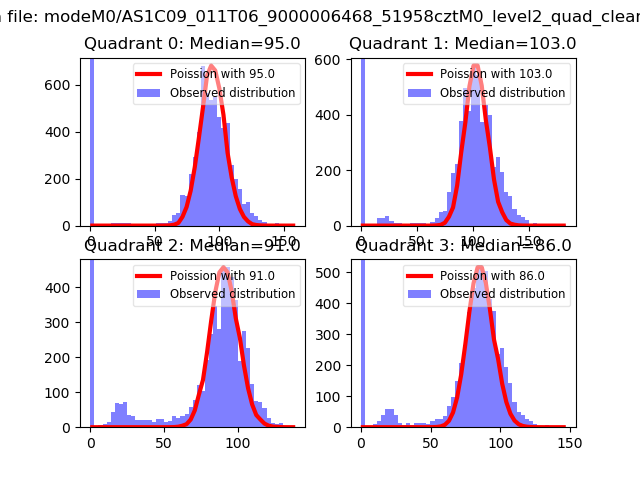
| Comparison with Poisson distribution Blue bars denote a histogram of data divided into 1 sec bins. Red curve is a Poisson curve with rate = median count rate of data. |
 |
 |
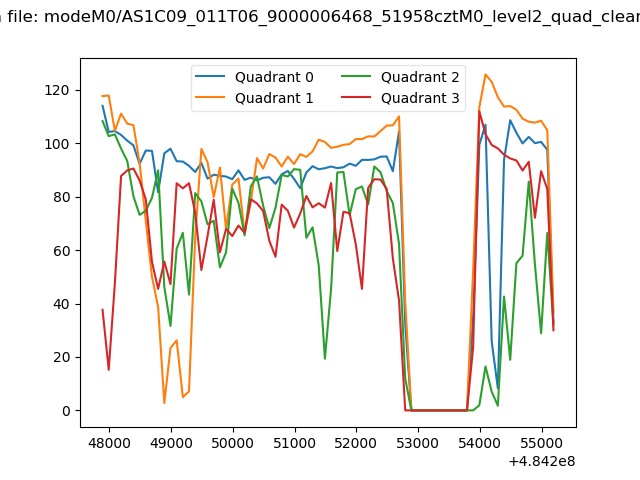
| Quadrant-wise count rates Data is divided into 100 sec bins |
 |
|
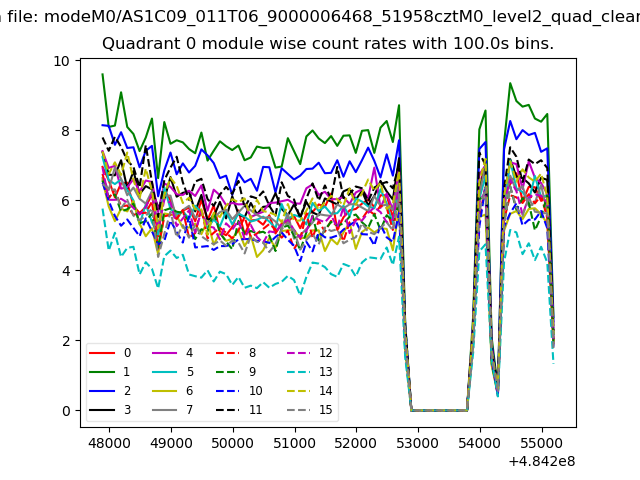
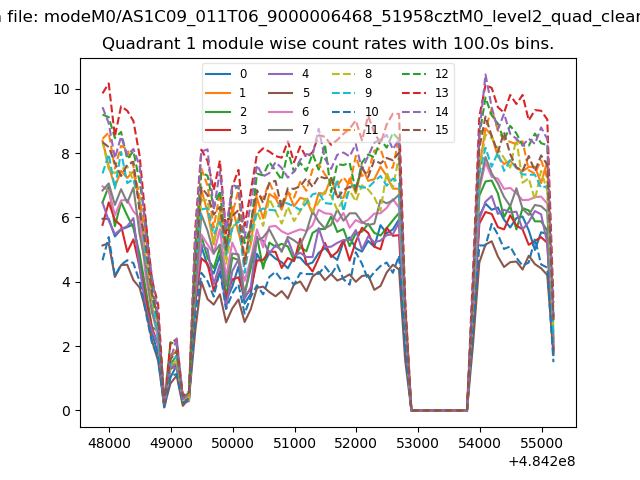
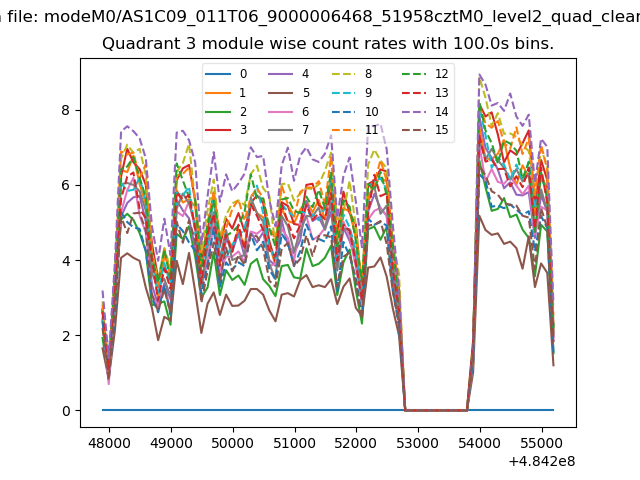
| Module-wise count rates for Quadrant A Data is divided into 100 sec bins |
 |
 |
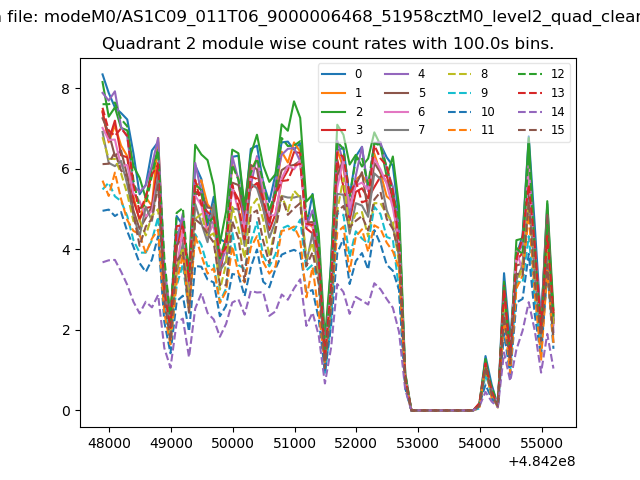
| Module-wise count rates for Quadrant B Data is divided into 100 sec bins |
 |
 |
| Module-wise count rates for Quadrant C Data is divided into 100 sec bins |
 |
 |
| Module-wise count rates for Quadrant D Data is divided into 100 sec bins |
 |
 |
| Parameter | Plot |
|---|---|
| CZT HV Monitor | 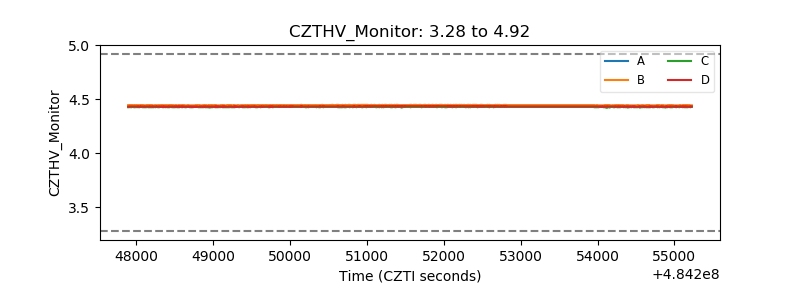 |
| D_VDD | 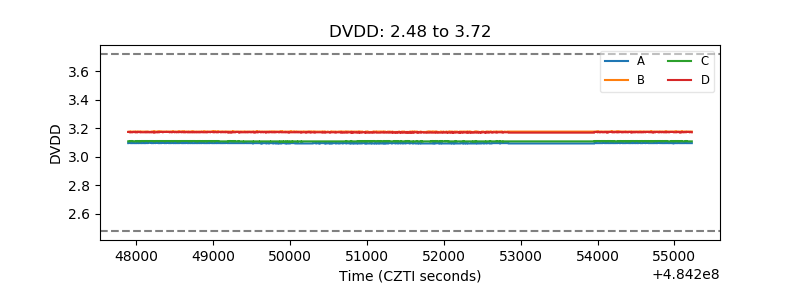 |
| Temperature 1 | 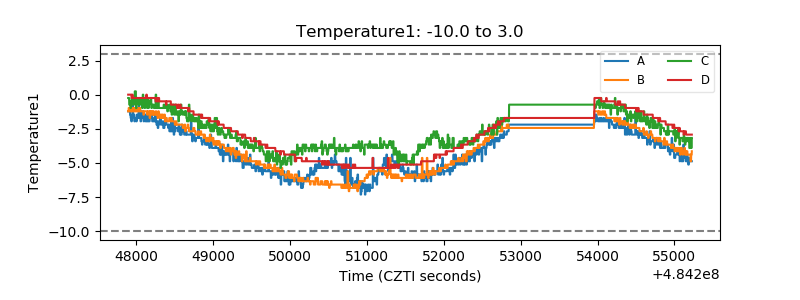 |
| Veto HV Monitor | 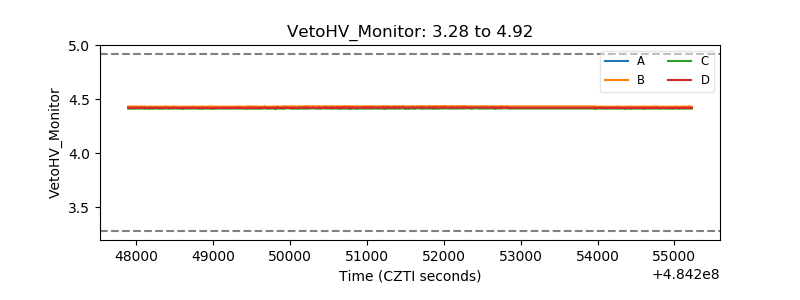 |
| Veto LLD | 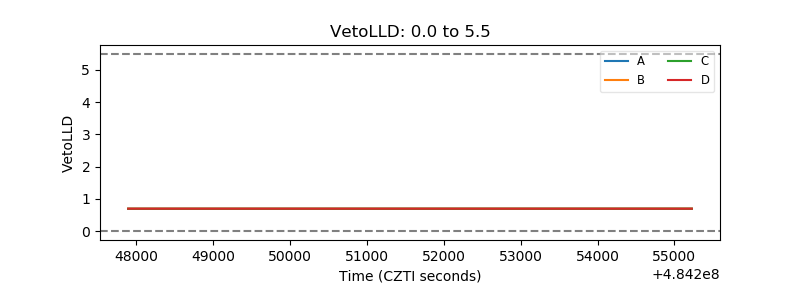 |
| Alpha Counter | 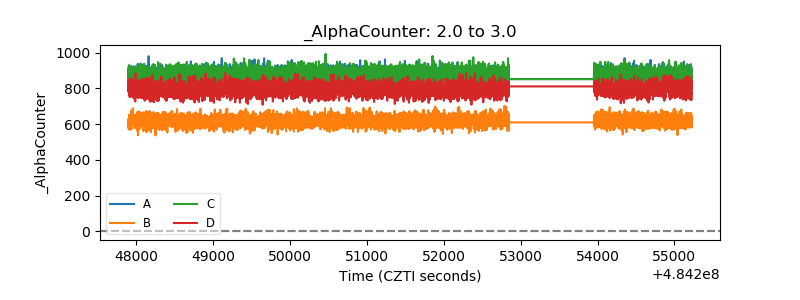 |
| _CPM_Rate | 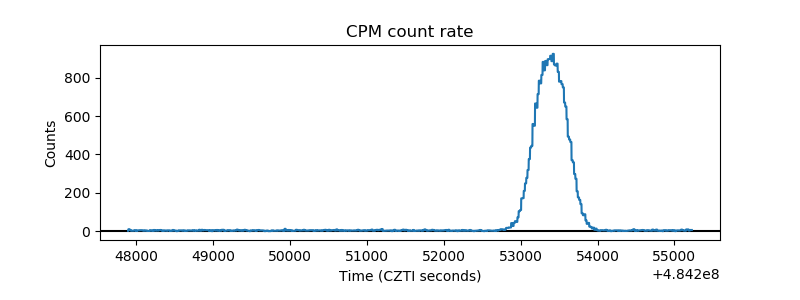 |
| CZT Counter | 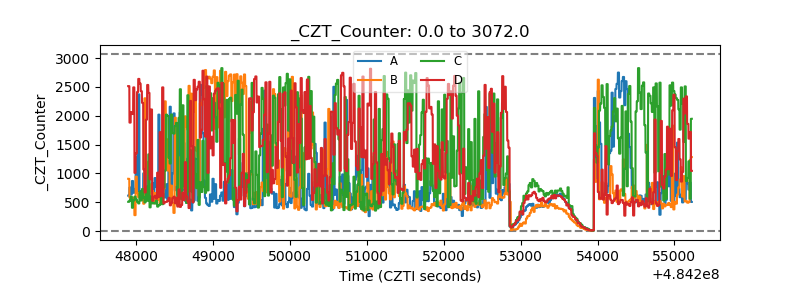 |
| +2.5 Volts monitor |  |
| +5 Volts monitor | 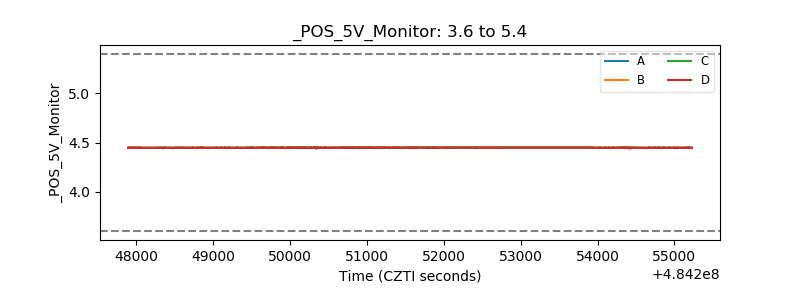 |
| _ROLL_ROT | 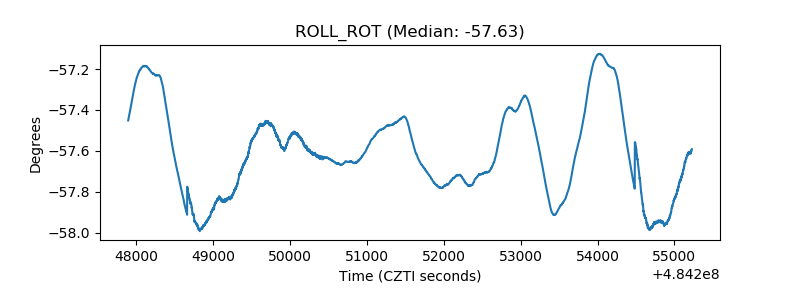 |
| _Roll_DEC | 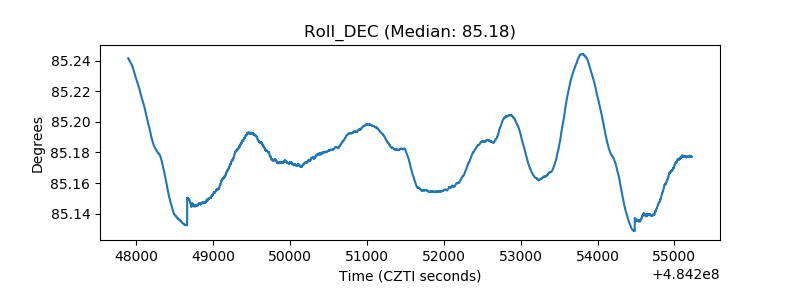 |
| _Roll_RA | 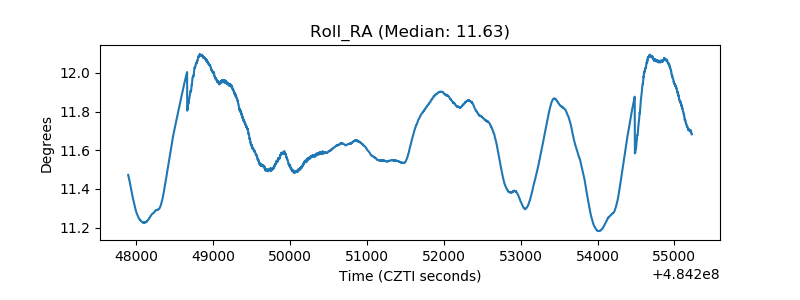 |
| Veto Counter | 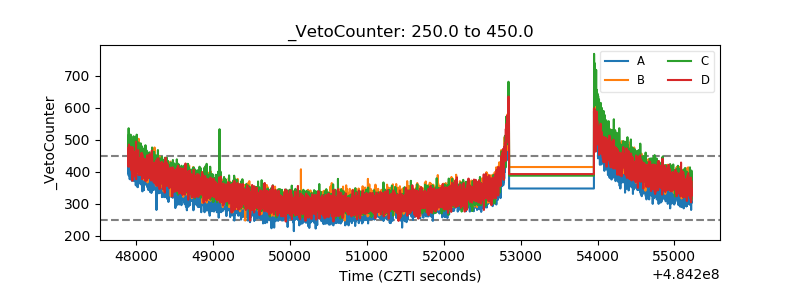 |