| Param | Original file | Final file |
|---|---|---|
| Filename | modeM0/AS1C09_011T06_9000006468_51959cztM0_level2.fits | modeM0/AS1C09_011T06_9000006468_51959cztM0_level2_quad_clean.evt |
| Size (bytes) | 758,623,680 | 81,126,720 |
| Size | 723.5 MB | 77.4 MB |
| Events in quadrant A | 6,314,062 | 523,175 |
| Events in quadrant B | 4,280,295 | 640,735 |
| Events in quadrant C | 9,778,877 | 383,372 |
| Events in quadrant D | 7,227,500 | 474,736 |
| Mode M0 | |||
|---|---|---|---|
| Quadrant | BADHDUFLAG | Total packets | Discarded packets |
| A | 0 | 23072 | 1 |
| B | 0 | 16919 | 1 |
| C | 0 | 33377 | 1 |
| D | 0 | 25734 | 1 |
| Mode M9 | |||
|---|---|---|---|
| Quadrant | BADHDUFLAG | Total packets | Discarded packets |
| A | 0 | 12 | 0 |
| B | 0 | 12 | 0 |
| C | 0 | 12 | 0 |
| D | 0 | 12 | 0 |
| Mode SS | |||
|---|---|---|---|
| Quadrant | BADHDUFLAG | Total packets | Discarded packets |
| A | 0 | 126 | 0 |
| B | 0 | 126 | 0 |
| C | 0 | 126 | 0 |
| D | 0 | 126 | 0 |
| Quadrant | Total seconds | Saturated seconds | Saturation percentage |
|---|---|---|---|
| A | 6218 | 1001 | 16.098424% |
| B | 6219 | 318 | 5.113362% |
| C | 6219 | 2577 | 41.437530% |
| D | 6219 | 1109 | 17.832449% |
Noise dominated data is calculated using 1-second bins in cleaned event files. If a bin has >2000 counts, and if more than 50% of those come from <1% of pixels, then it is considered to be noise-dominated and hence unusable.
| Quadrant | # 1 sec bins | Bins with >0 counts | Bins with >2000 counts | High rate bins dominated by noise | Noise dominated (total time) | Noise dominated (detector-on time) | Marked lightcurve |
|---|---|---|---|---|---|---|---|
| A | 7388 | 6219 | 700 | 700 | 9.47% | 11.26% | 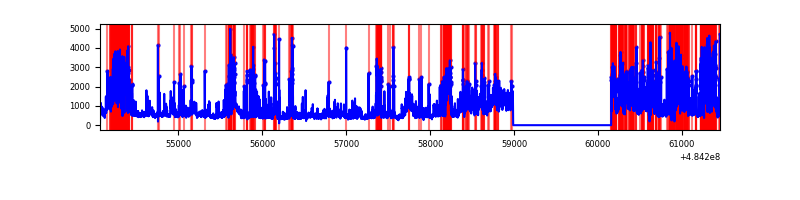 |
| B | 7389 | 6220 | 209 | 209 | 2.83% | 3.36% | 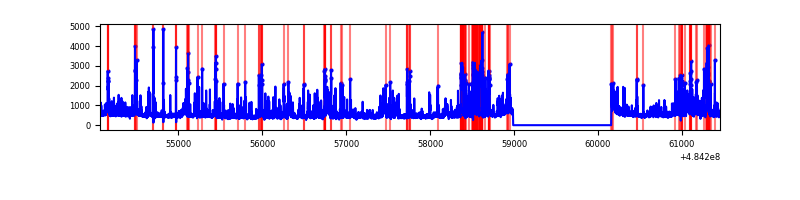 |
| C | 7389 | 6218 | 1923 | 1923 | 26.03% | 30.93% | 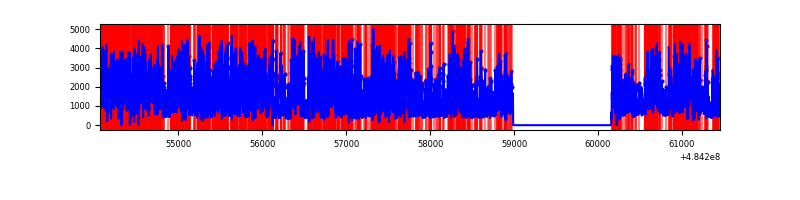 |
| D | 7389 | 6220 | 1098 | 1098 | 14.86% | 17.65% | 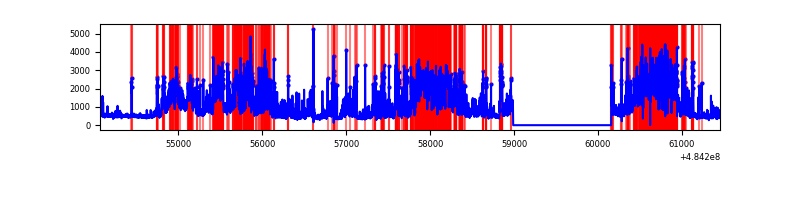 |
Top three noisy pixels from each quadrant. If the there are fewer than three noisy pixels in the level2.evt file, extra rows are filled as -1
| Pixel properties | Quadrant properties | ||||||
|---|---|---|---|---|---|---|---|
| Quadrant | DetID | PixID | Counts | Sigma | Mean | Median | Sigma |
| A | 7 | 64 | 1827647 | 12070.09 | 608 | 593 | 151.4 |
| A | 4 | 159 | 535976 | 3536.91 | 608 | 593 | 151.4 |
| A | 4 | 249 | 414806 | 2736.42 | 608 | 593 | 151.4 |
| B | 10 | 41 | 523050 | 3815.99 | 647 | 626 | 136.9 |
| B | 10 | 247 | 168629 | 1227.16 | 647 | 626 | 136.9 |
| B | 10 | 44 | 164252 | 1195.19 | 647 | 626 | 136.9 |
| C | 15 | 224 | 6631749 | 46381.64 | 509 | 504 | 143.0 |
| C | 4 | 5 | 327563 | 2287.58 | 509 | 504 | 143.0 |
| C | 15 | 230 | 159088 | 1109.2 | 509 | 504 | 143.0 |
| D | 6 | 42 | 3174899 | 18754.5 | 593 | 566 | 169.3 |
| D | 12 | 17 | 385263 | 2272.86 | 593 | 566 | 169.3 |
| D | 0 | 5 | 274260 | 1617.03 | 593 | 566 | 169.3 |
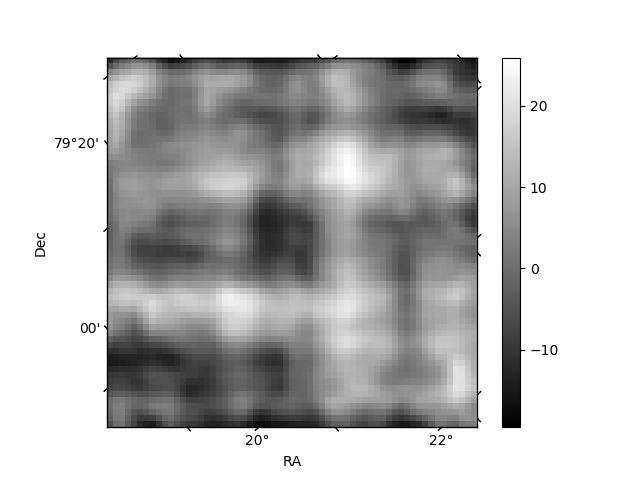
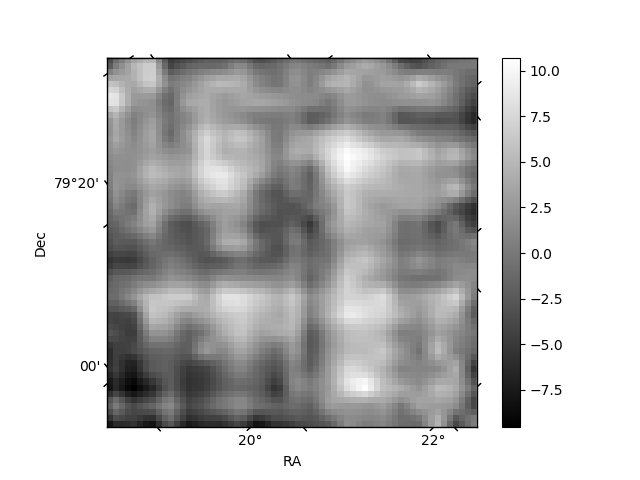
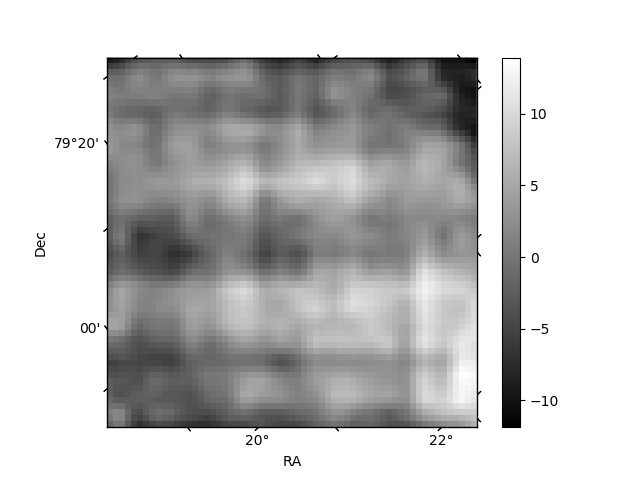
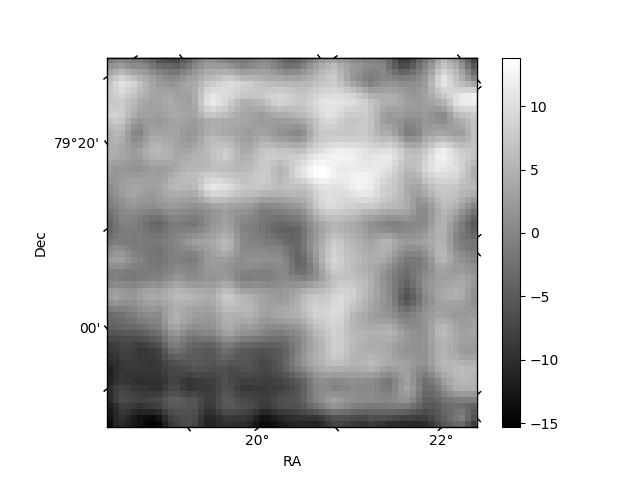
Histogram calculated using DETX and DETY for each event in the final _common_clean file
| Quadrant A | 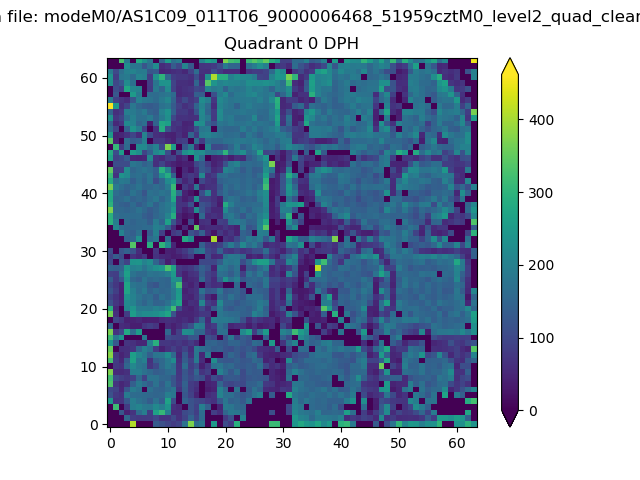 |
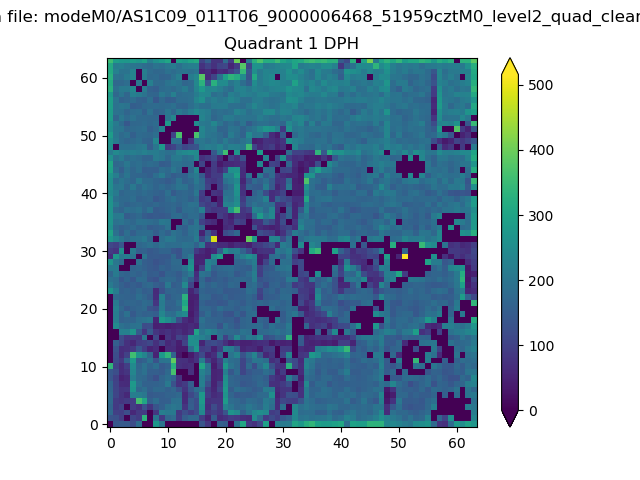 |
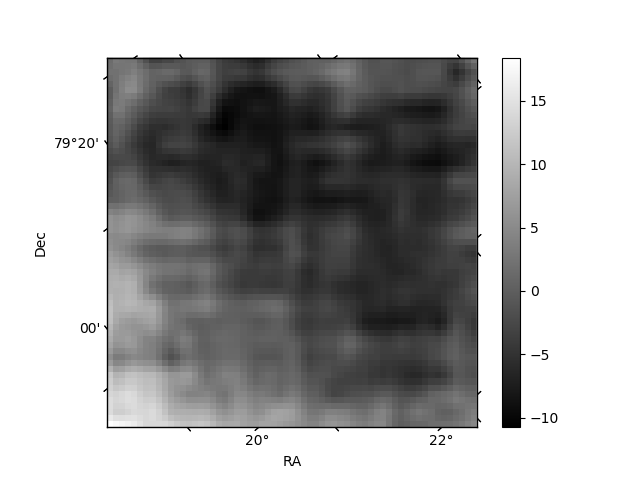
Quadrant B |
|---|---|---|---|
| Quadrant D | 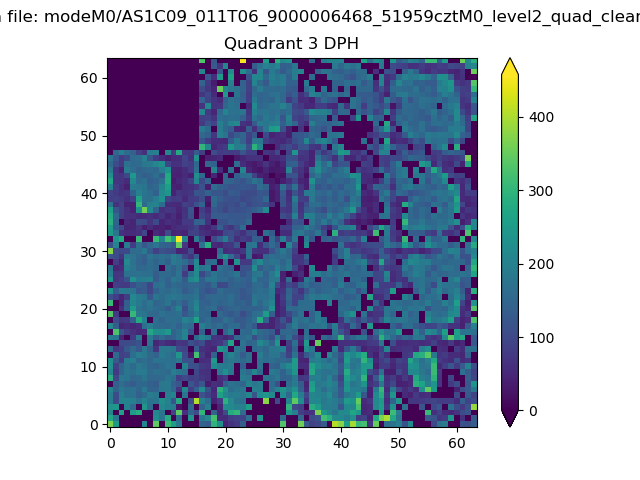 |
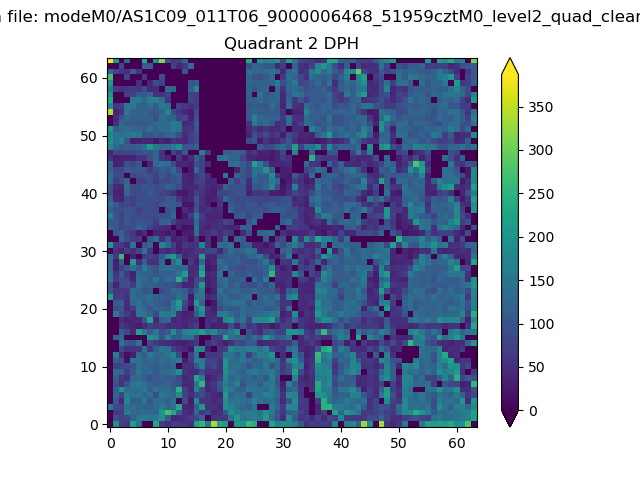 |
Quadrant C |
| Plot type | Count rate plots | Images |
|---|---|---|
| Comparison with Poisson distribution Blue bars denote a histogram of data divided into 1 sec bins. Red curve is a Poisson curve with rate = median count rate of data. |
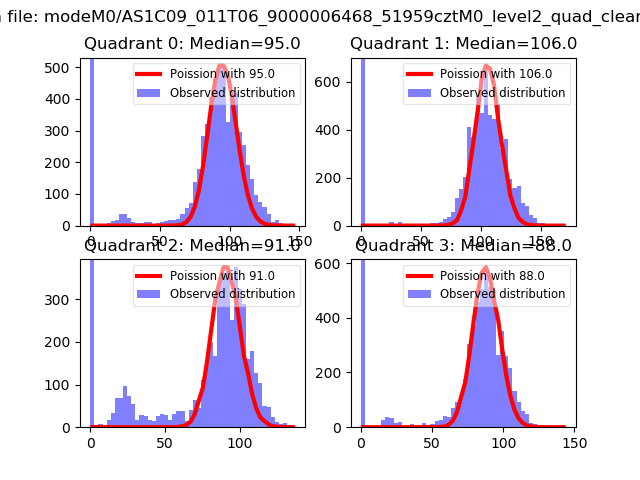 |
 |
| Quadrant-wise count rates Data is divided into 100 sec bins |
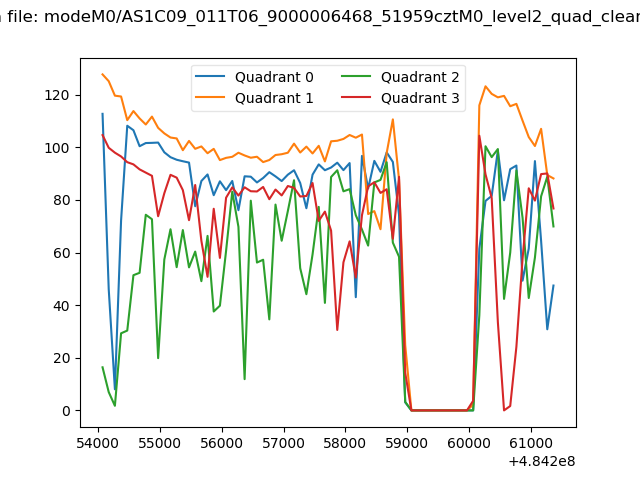 |
|
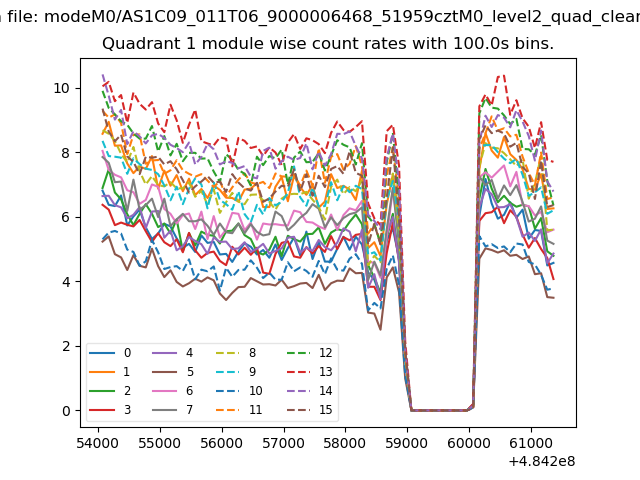
| Module-wise count rates for Quadrant A Data is divided into 100 sec bins |
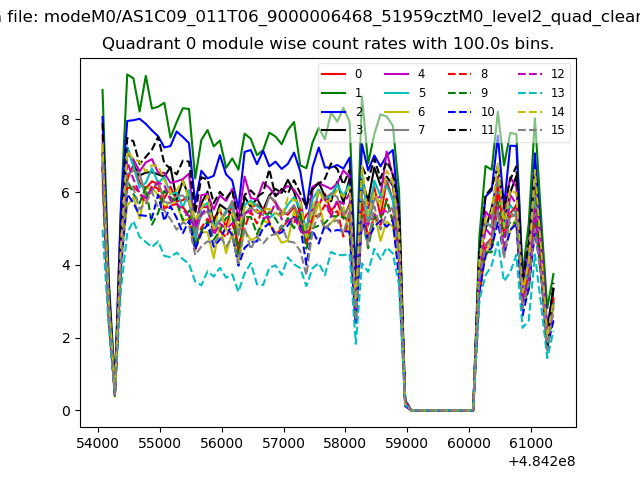 |
 |
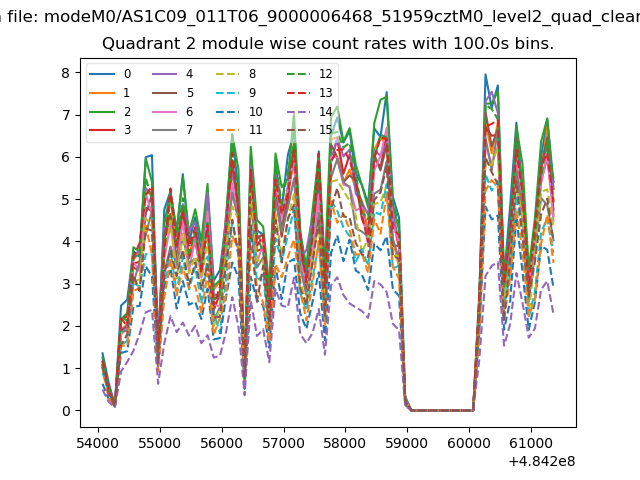
| Module-wise count rates for Quadrant B Data is divided into 100 sec bins |
 |
 |
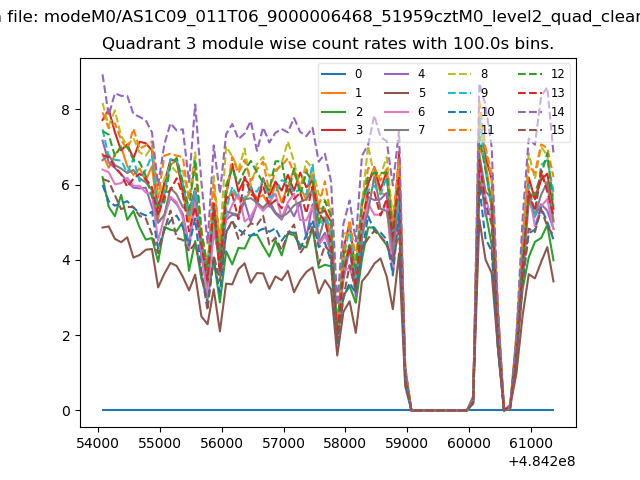
| Module-wise count rates for Quadrant C Data is divided into 100 sec bins |
 |
 |
| Module-wise count rates for Quadrant D Data is divided into 100 sec bins |
 |
 |
| Parameter | Plot |
|---|---|
| CZT HV Monitor |  |
| D_VDD | 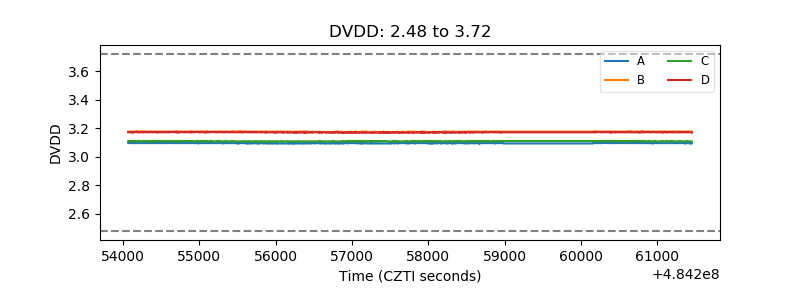 |
| Temperature 1 | 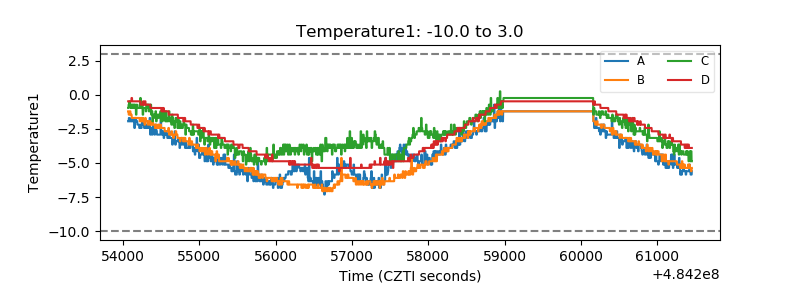 |
| Veto HV Monitor | 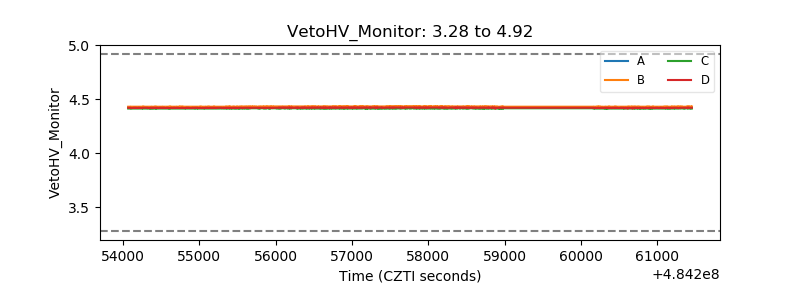 |
| Veto LLD | 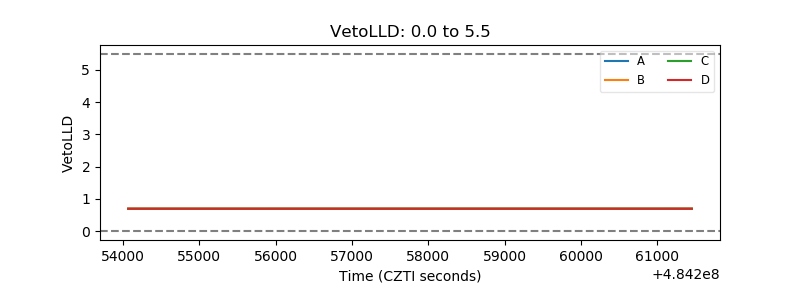 |
| Alpha Counter | 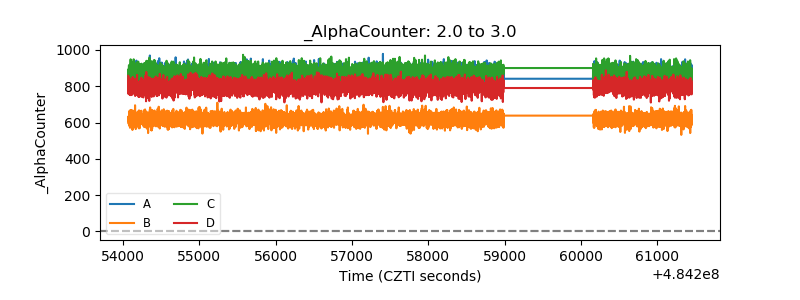 |
| _CPM_Rate | 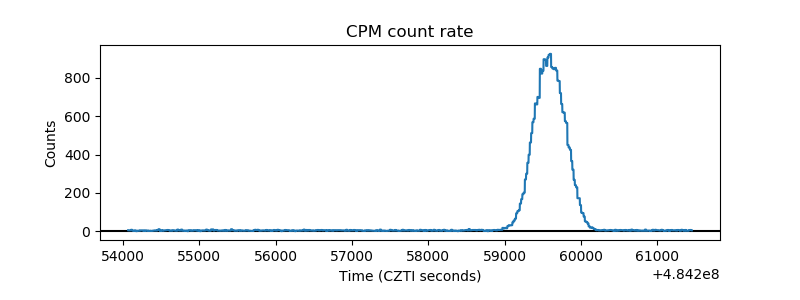 |
| CZT Counter | 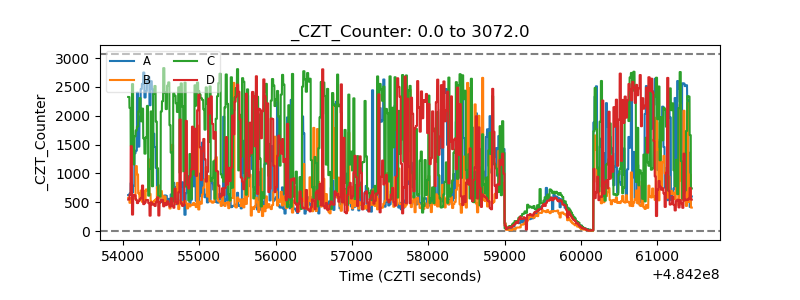 |
| +2.5 Volts monitor | 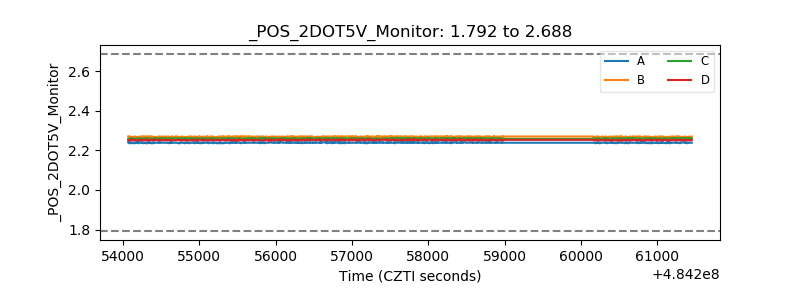 |
| +5 Volts monitor | 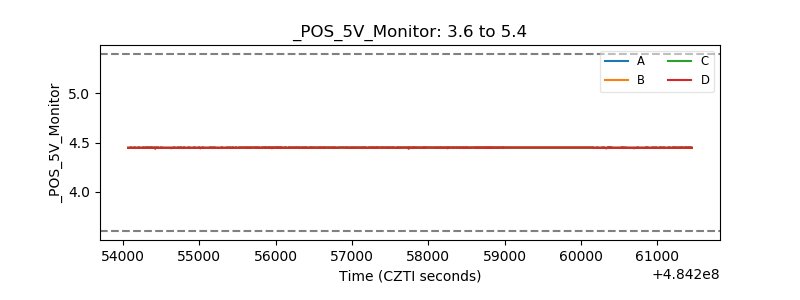 |
| _ROLL_ROT | 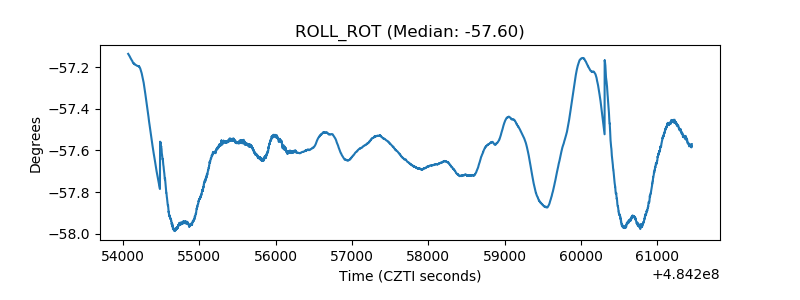 |
| _Roll_DEC | 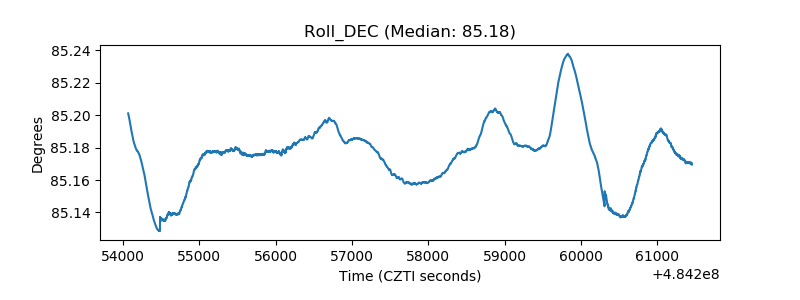 |
| _Roll_RA | 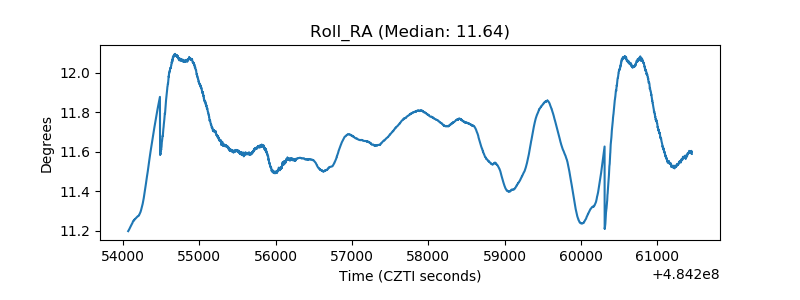 |
| Veto Counter | 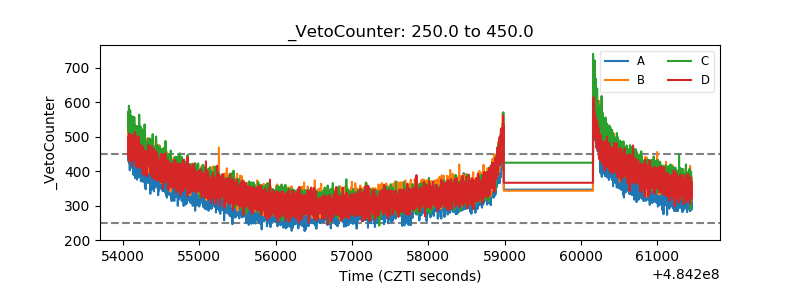 |