| Param | Original file | Final file |
|---|---|---|
| Filename | modeM0/AS1C09_011T06_9000006468_51960cztM0_level2.fits | modeM0/AS1C09_011T06_9000006468_51960cztM0_level2_quad_clean.evt |
| Size (bytes) | 930,934,080 | 78,082,560 |
| Size | 887.8 MB | 74.5 MB |
| Events in quadrant A | 10,788,615 | 374,368 |
| Events in quadrant B | 5,004,032 | 646,807 |
| Events in quadrant C | 9,461,676 | 444,179 |
| Events in quadrant D | 8,708,017 | 448,414 |
| Mode M0 | |||
|---|---|---|---|
| Quadrant | BADHDUFLAG | Total packets | Discarded packets |
| A | 0 | 36499 | 2 |
| B | 0 | 19304 | 2 |
| C | 0 | 32673 | 8 |
| D | 0 | 30322 | 2 |
| Mode M9 | |||
|---|---|---|---|
| Quadrant | BADHDUFLAG | Total packets | Discarded packets |
| A | 0 | 19 | 0 |
| B | 0 | 20 | 0 |
| C | 0 | 20 | 0 |
| D | 0 | 20 | 0 |
| Mode SS | |||
|---|---|---|---|
| Quadrant | BADHDUFLAG | Total packets | Discarded packets |
| A | 0 | 130 | 0 |
| B | 0 | 130 | 0 |
| C | 0 | 130 | 0 |
| D | 0 | 130 | 0 |
| Quadrant | Total seconds | Saturated seconds | Saturation percentage |
|---|---|---|---|
| A | 6451 | 2948 | 45.698341% |
| B | 6451 | 507 | 7.859247% |
| C | 6450 | 2198 | 34.077519% |
| D | 6450 | 1658 | 25.705426% |
Noise dominated data is calculated using 1-second bins in cleaned event files. If a bin has >2000 counts, and if more than 50% of those come from <1% of pixels, then it is considered to be noise-dominated and hence unusable.
| Quadrant | # 1 sec bins | Bins with >0 counts | Bins with >2000 counts | High rate bins dominated by noise | Noise dominated (total time) | Noise dominated (detector-on time) | Marked lightcurve |
|---|---|---|---|---|---|---|---|
| A | 7636 | 6452 | 2312 | 2312 | 30.28% | 35.83% | 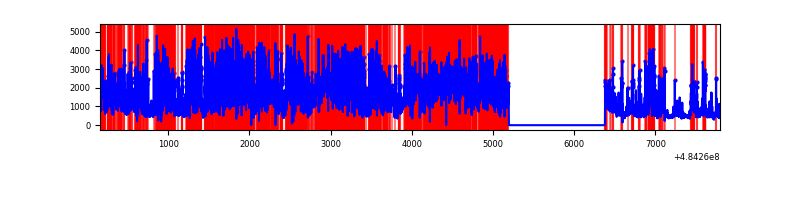 |
| B | 7636 | 6452 | 319 | 319 | 4.18% | 4.94% | 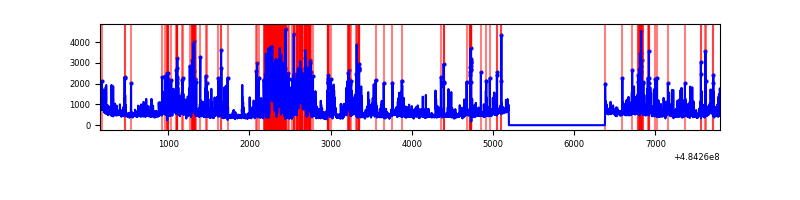 |
| C | 7635 | 6450 | 1698 | 1698 | 22.24% | 26.33% | 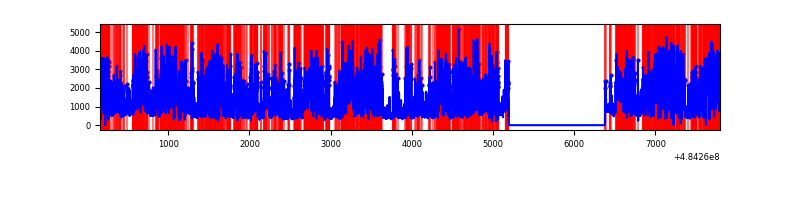 |
| D | 7635 | 6451 | 1506 | 1506 | 19.72% | 23.35% | 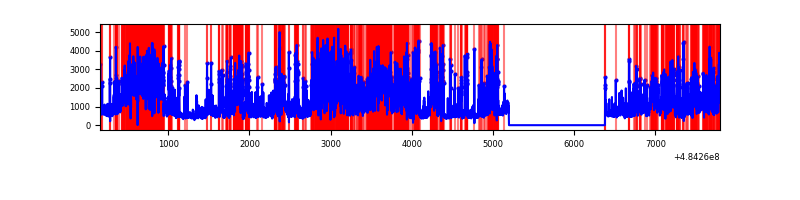 |
Top three noisy pixels from each quadrant. If the there are fewer than three noisy pixels in the level2.evt file, extra rows are filled as -1
| Pixel properties | Quadrant properties | ||||||
|---|---|---|---|---|---|---|---|
| Quadrant | DetID | PixID | Counts | Sigma | Mean | Median | Sigma |
| A | 4 | 159 | 4202700 | 31429.61 | 526 | 512 | 133.7 |
| A | 7 | 64 | 2009591 | 15026.59 | 526 | 512 | 133.7 |
| A | 4 | 95 | 1395771 | 10435.62 | 526 | 512 | 133.7 |
| B | 5 | 185 | 959303 | 6892.95 | 661 | 640 | 139.1 |
| B | 10 | 41 | 323189 | 2319.18 | 661 | 640 | 139.1 |
| B | 10 | 44 | 169126 | 1211.44 | 661 | 640 | 139.1 |
| C | 15 | 224 | 5752290 | 35998.75 | 569 | 563 | 159.8 |
| C | 13 | 3 | 339990 | 2124.4 | 569 | 563 | 159.8 |
| C | 4 | 5 | 241780 | 1509.72 | 569 | 563 | 159.8 |
| D | 6 | 42 | 1821428 | 10928.52 | 581 | 555 | 166.6 |
| D | 2 | 172 | 1348732 | 8091.49 | 581 | 555 | 166.6 |
| D | 0 | 5 | 829610 | 4975.83 | 581 | 555 | 166.6 |
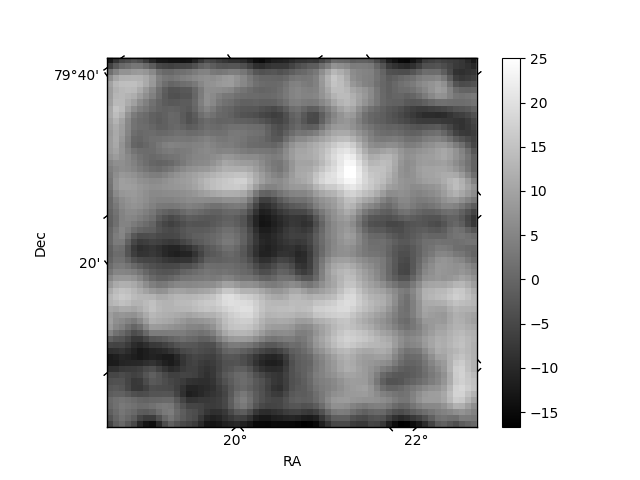
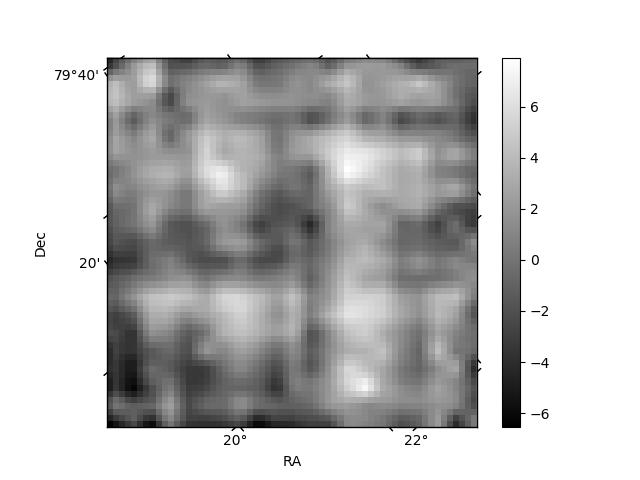
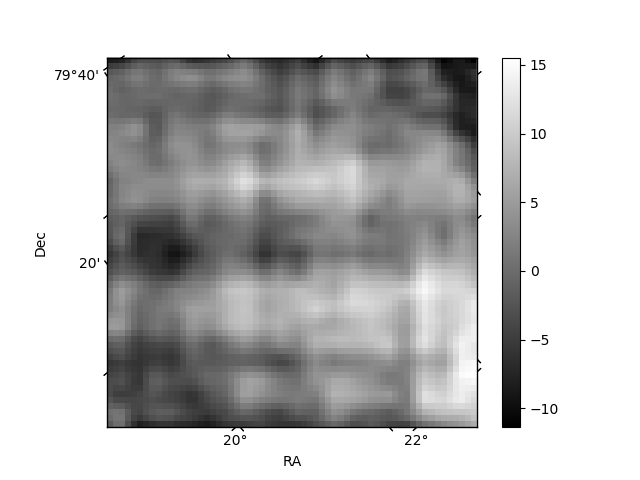
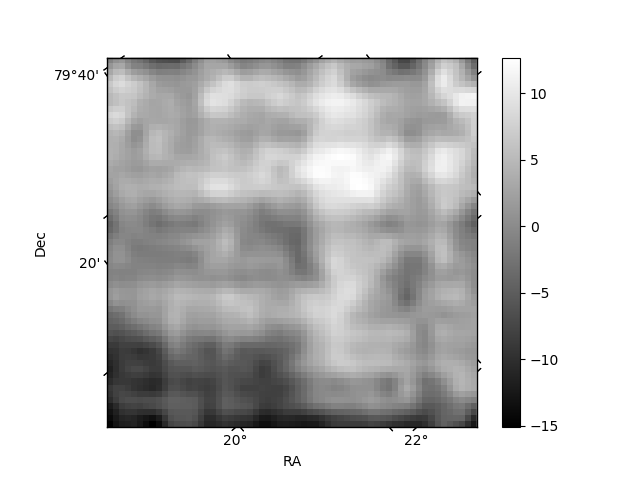
Histogram calculated using DETX and DETY for each event in the final _common_clean file
| Quadrant A | 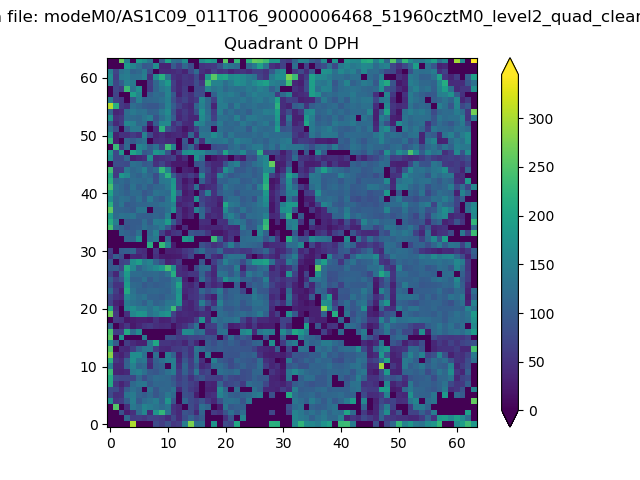 |
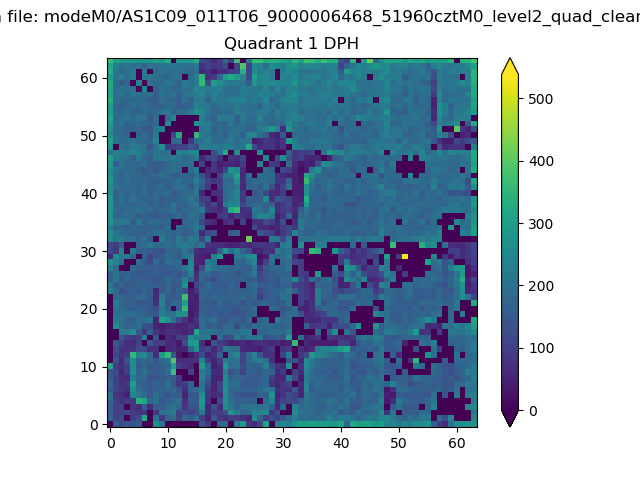 |
Quadrant B |
|---|---|---|---|
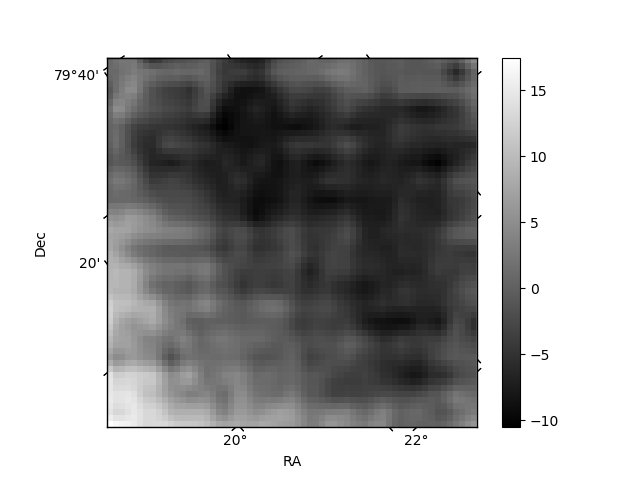
| Quadrant D | 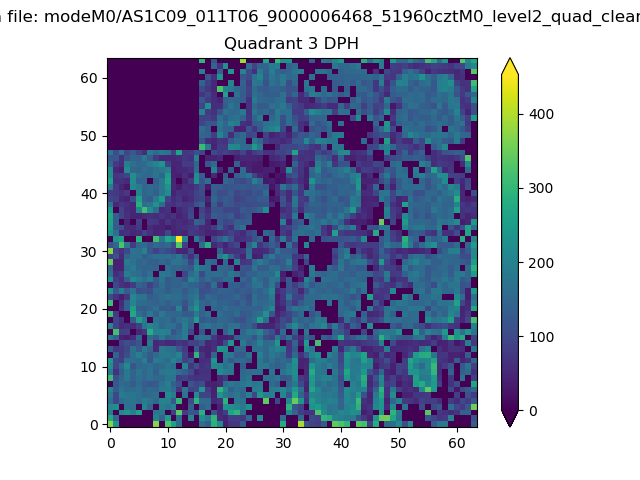 |
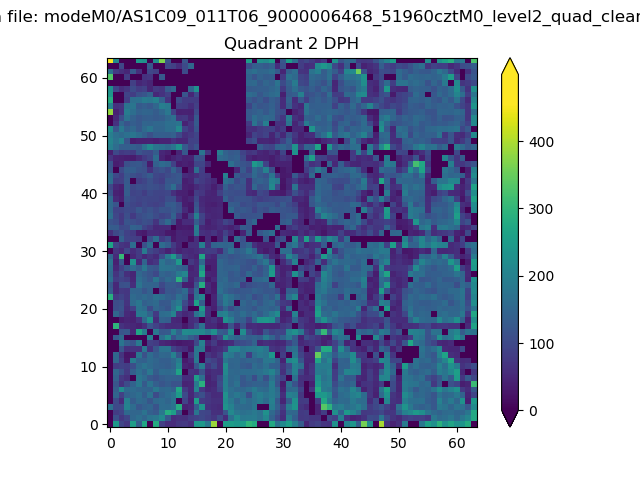 |
Quadrant C |
| Plot type | Count rate plots | Images |
|---|---|---|
| Comparison with Poisson distribution Blue bars denote a histogram of data divided into 1 sec bins. Red curve is a Poisson curve with rate = median count rate of data. |
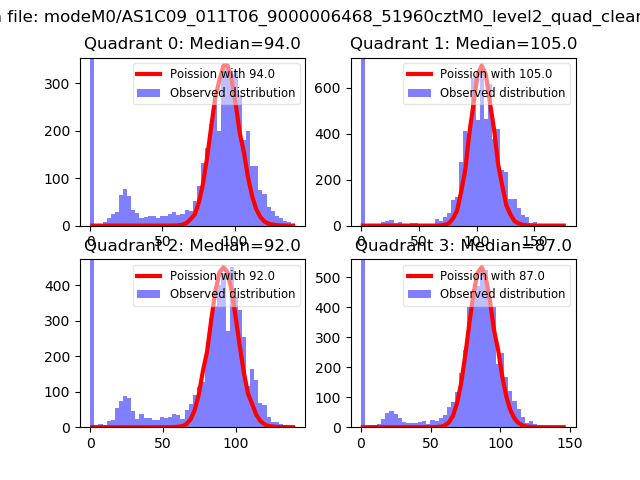 |
 |
| Quadrant-wise count rates Data is divided into 100 sec bins |
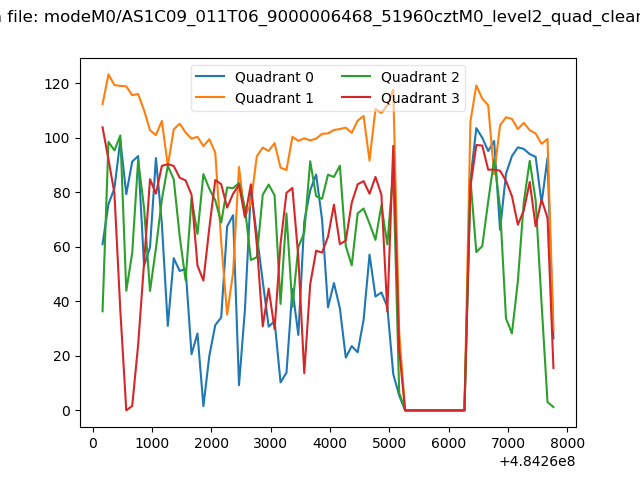 |
|
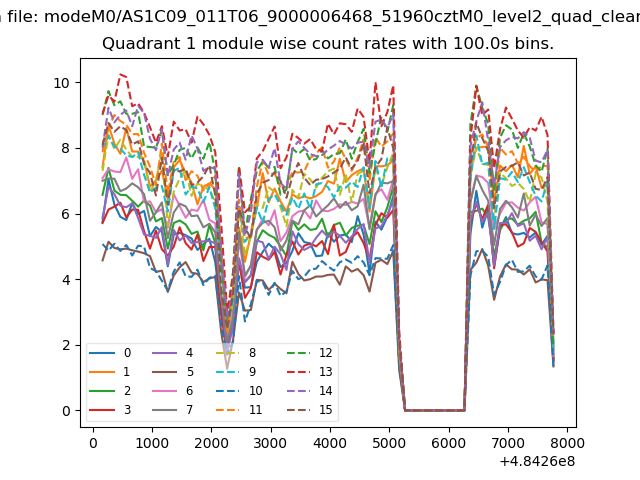
| Module-wise count rates for Quadrant A Data is divided into 100 sec bins |
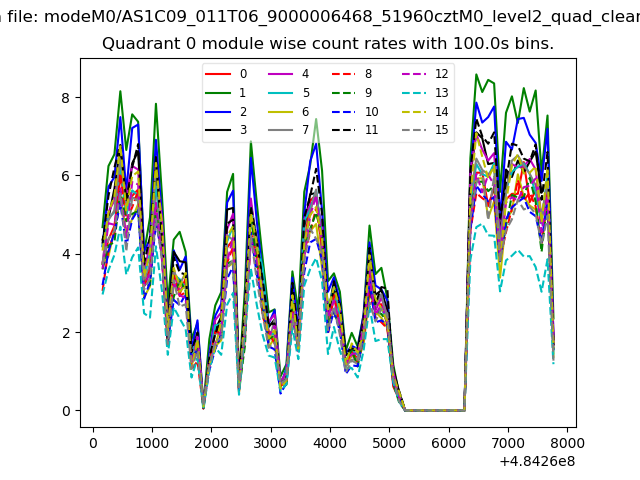 |
 |
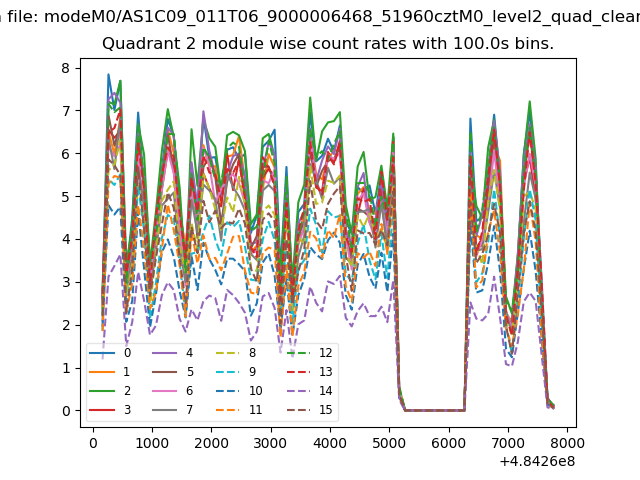
| Module-wise count rates for Quadrant B Data is divided into 100 sec bins |
 |
 |
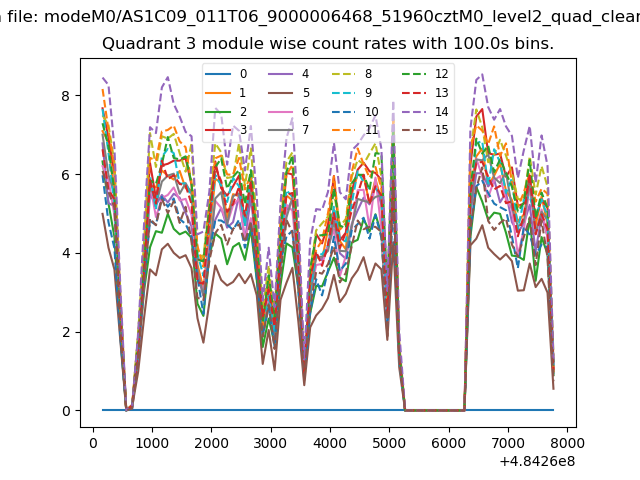
| Module-wise count rates for Quadrant C Data is divided into 100 sec bins |
 |
 |
| Module-wise count rates for Quadrant D Data is divided into 100 sec bins |
 |
 |
| Parameter | Plot |
|---|---|
| CZT HV Monitor | 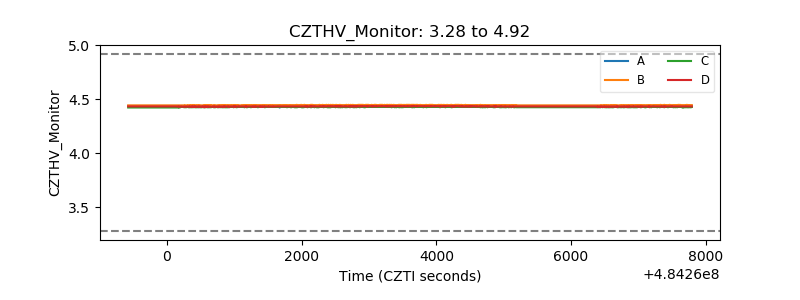 |
| D_VDD | 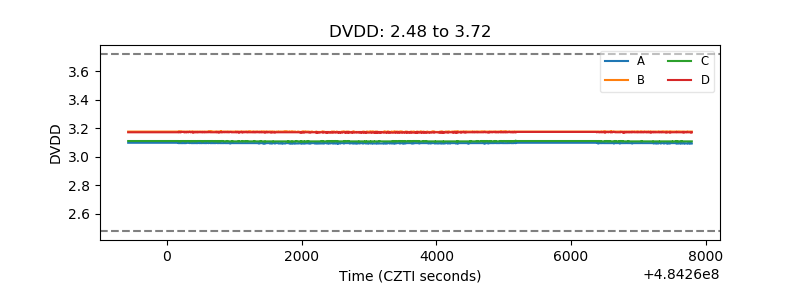 |
| Temperature 1 | 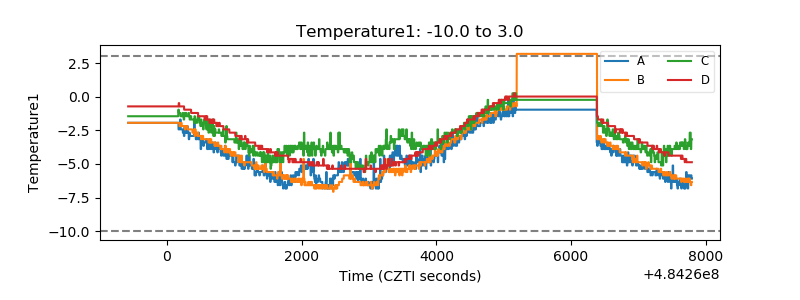 |
| Veto HV Monitor | 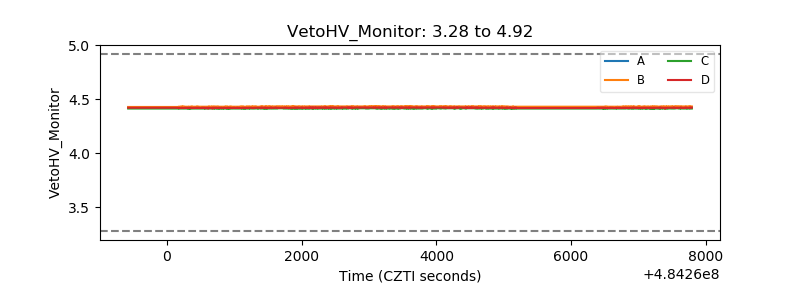 |
| Veto LLD | 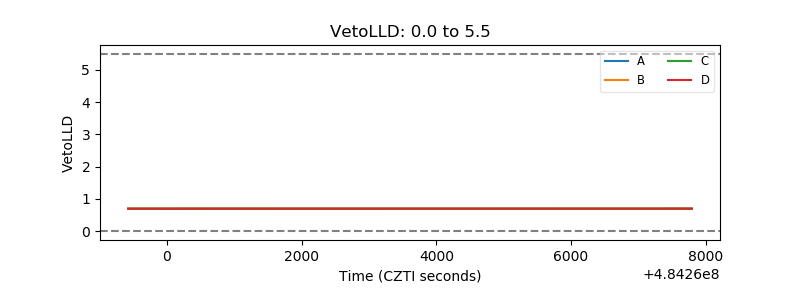 |
| Alpha Counter | 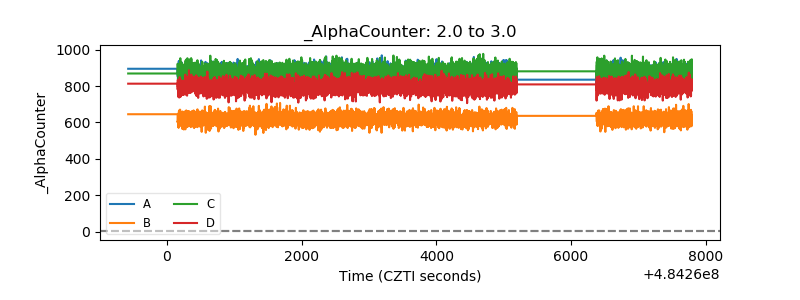 |
| _CPM_Rate | 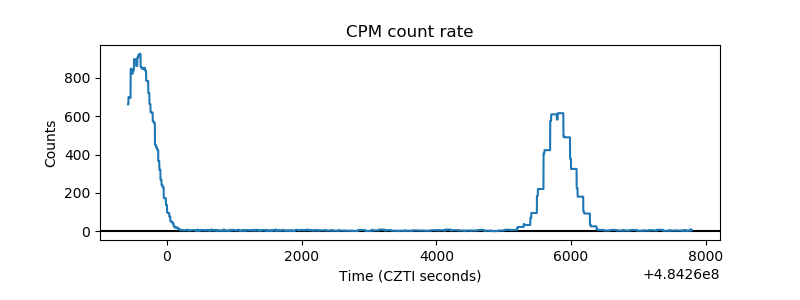 |
| CZT Counter | 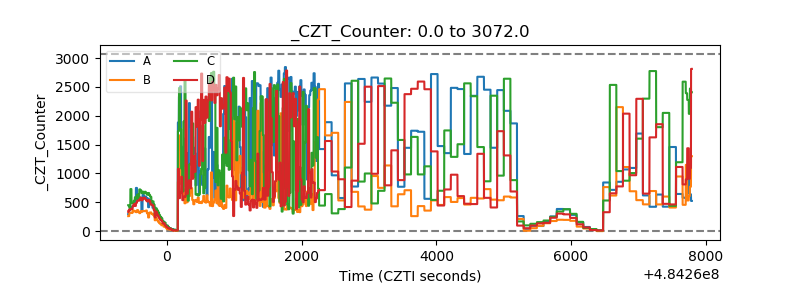 |
| +2.5 Volts monitor | 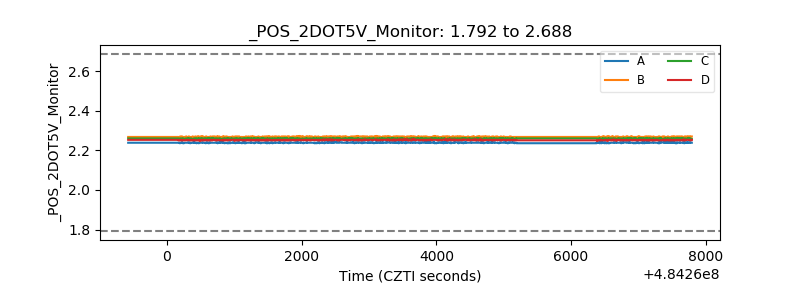 |
| +5 Volts monitor | 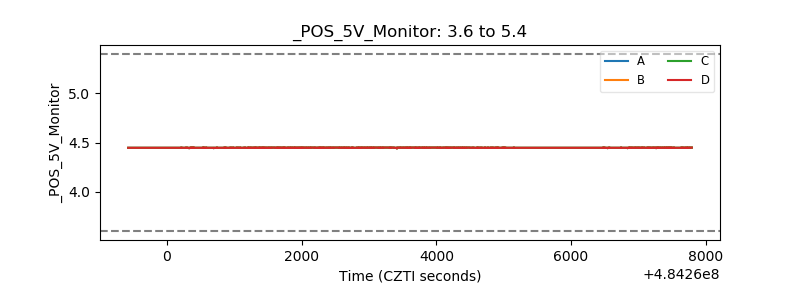 |
| _ROLL_ROT | 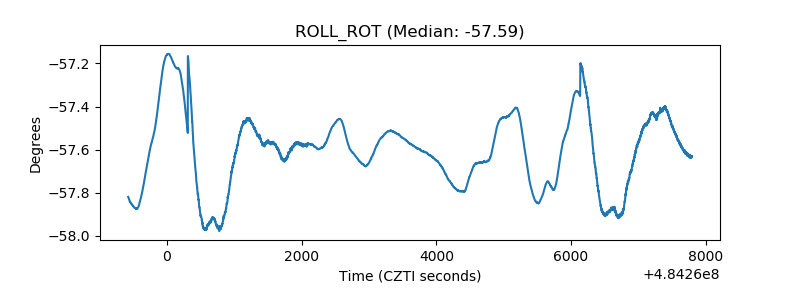 |
| _Roll_DEC | 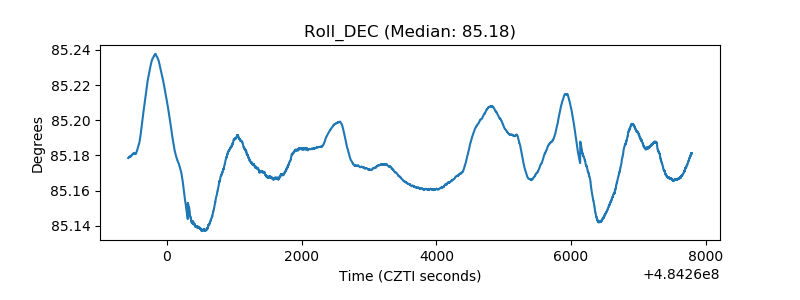 |
| _Roll_RA | 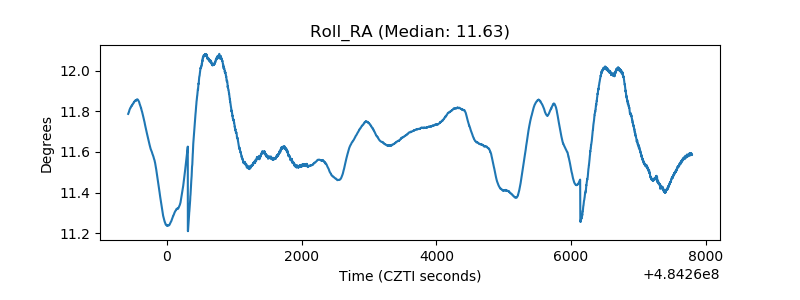 |
| Veto Counter | 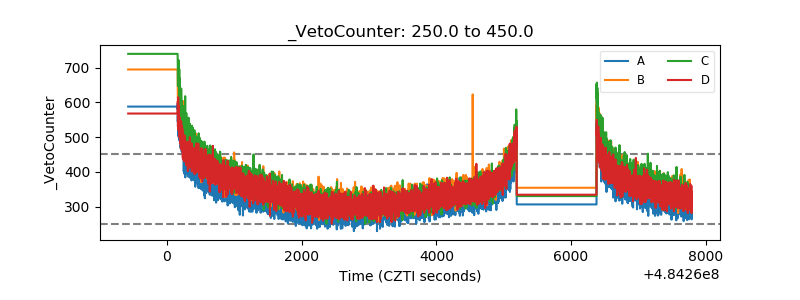 |