| Param | Original file | Final file |
|---|---|---|
| Filename | modeM0/AS1C09_011T06_9000006468_51961cztM0_level2.fits | modeM0/AS1C09_011T06_9000006468_51961cztM0_level2_quad_clean.evt |
| Size (bytes) | 907,113,600 | 79,672,320 |
| Size | 865.1 MB | 76.0 MB |
| Events in quadrant A | 6,820,601 | 542,834 |
| Events in quadrant B | 4,670,577 | 660,912 |
| Events in quadrant C | 9,906,655 | 413,529 |
| Events in quadrant D | 11,673,144 | 336,037 |
| Mode M0 | |||
|---|---|---|---|
| Quadrant | BADHDUFLAG | Total packets | Discarded packets |
| A | 0 | 24842 | 3 |
| B | 0 | 18500 | 3 |
| C | 0 | 34026 | 3 |
| D | 0 | 39127 | 3 |
| Mode M9 | |||
|---|---|---|---|
| Quadrant | BADHDUFLAG | Total packets | Discarded packets |
| A | 0 | 10 | 0 |
| B | 0 | 10 | 0 |
| C | 0 | 10 | 0 |
| D | 0 | 10 | 0 |
| Mode SS | |||
|---|---|---|---|
| Quadrant | BADHDUFLAG | Total packets | Discarded packets |
| A | 0 | 134 | 0 |
| B | 0 | 134 | 0 |
| C | 0 | 134 | 0 |
| D | 0 | 134 | 0 |
| Quadrant | Total seconds | Saturated seconds | Saturation percentage |
|---|---|---|---|
| A | 6574 | 1015 | 15.439611% |
| B | 6575 | 297 | 4.517110% |
| C | 6575 | 2478 | 37.688213% |
| D | 6575 | 3039 | 46.220532% |
Noise dominated data is calculated using 1-second bins in cleaned event files. If a bin has >2000 counts, and if more than 50% of those come from <1% of pixels, then it is considered to be noise-dominated and hence unusable.
| Quadrant | # 1 sec bins | Bins with >0 counts | Bins with >2000 counts | High rate bins dominated by noise | Noise dominated (total time) | Noise dominated (detector-on time) | Marked lightcurve |
|---|---|---|---|---|---|---|---|
| A | 7628 | 6575 | 774 | 774 | 10.15% | 11.77% | 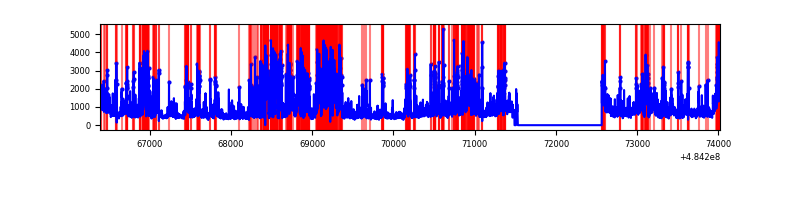 |
| B | 7630 | 6576 | 183 | 183 | 2.40% | 2.78% | 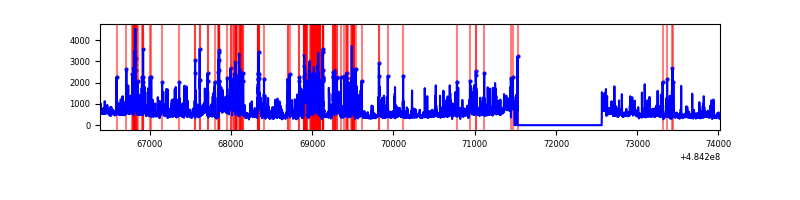 |
| C | 7630 | 6577 | 1876 | 1876 | 24.59% | 28.52% |  |
| D | 7630 | 6577 | 2844 | 2844 | 37.27% | 43.24% | 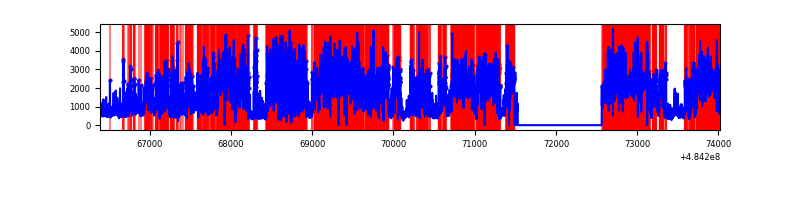 |
Top three noisy pixels from each quadrant. If the there are fewer than three noisy pixels in the level2.evt file, extra rows are filled as -1
| Pixel properties | Quadrant properties | ||||||
|---|---|---|---|---|---|---|---|
| Quadrant | DetID | PixID | Counts | Sigma | Mean | Median | Sigma |
| A | 4 | 159 | 1920538 | 11894.28 | 638 | 622 | 161.4 |
| A | 7 | 64 | 795439 | 4924.06 | 638 | 622 | 161.4 |
| A | 4 | 249 | 333120 | 2059.89 | 638 | 622 | 161.4 |
| B | 10 | 44 | 409451 | 2882.67 | 671 | 649 | 141.8 |
| B | 10 | 41 | 327537 | 2305.06 | 671 | 649 | 141.8 |
| B | 5 | 185 | 320872 | 2258.06 | 671 | 649 | 141.8 |
| C | 15 | 224 | 5791057 | 37190.68 | 552 | 544 | 155.7 |
| C | 15 | 192 | 443082 | 2842.29 | 552 | 544 | 155.7 |
| C | 12 | 252 | 296434 | 1900.41 | 552 | 544 | 155.7 |
| D | 6 | 42 | 7159326 | 47572.73 | 517 | 491 | 150.5 |
| D | 12 | 16 | 753236 | 5002.23 | 517 | 491 | 150.5 |
| D | 0 | 5 | 433053 | 2874.51 | 517 | 491 | 150.5 |
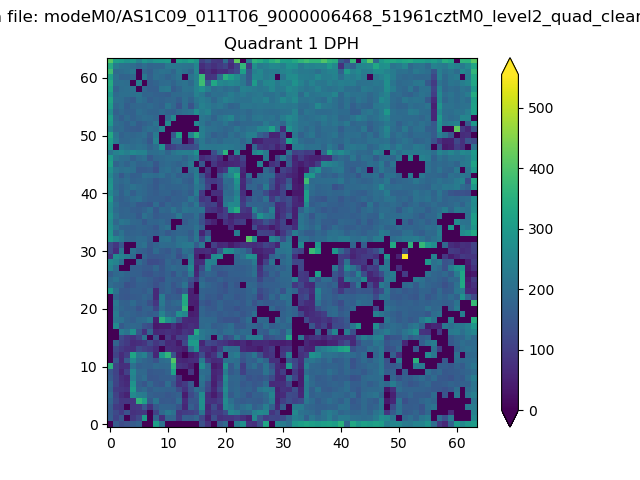
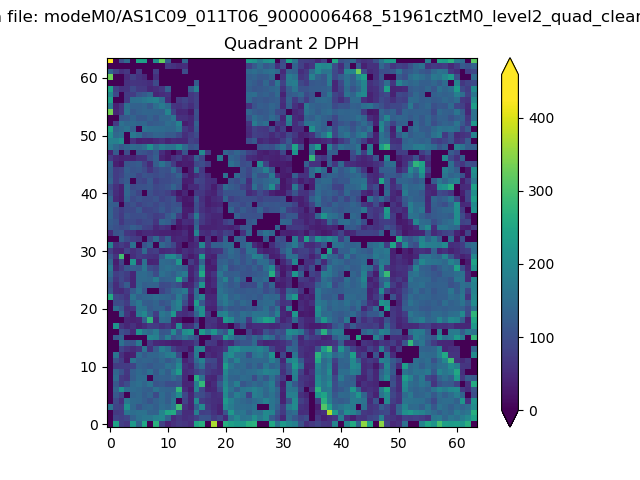
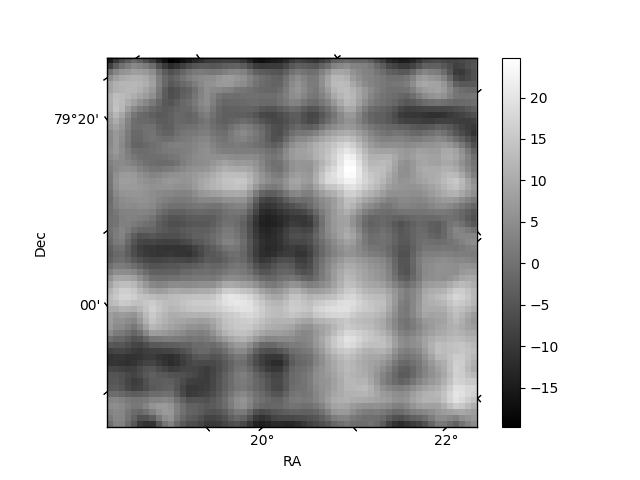
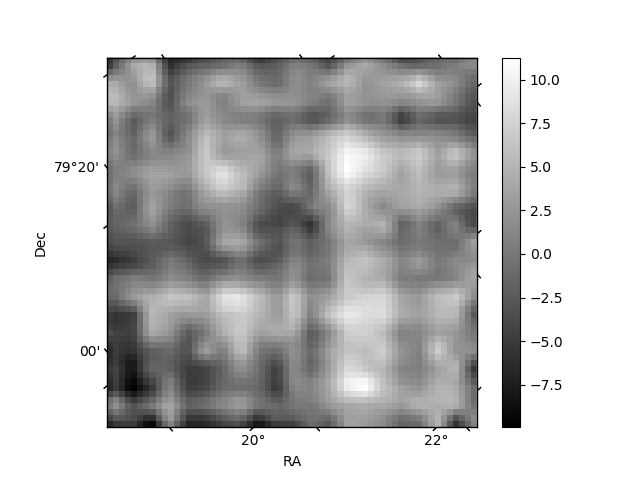
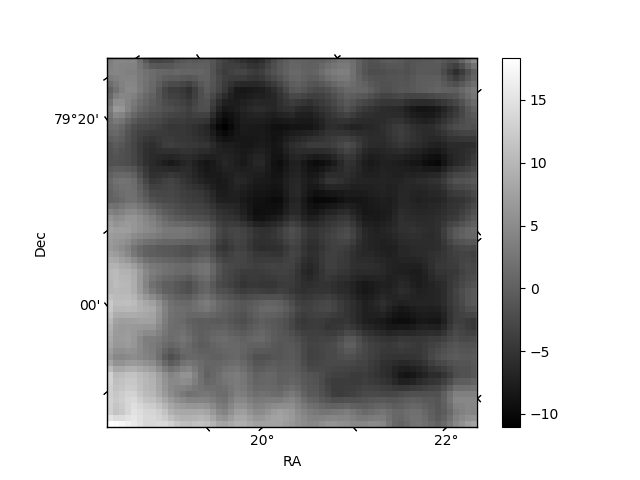
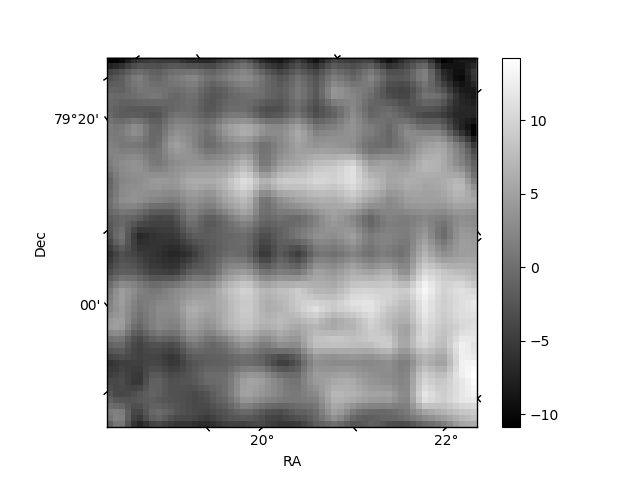
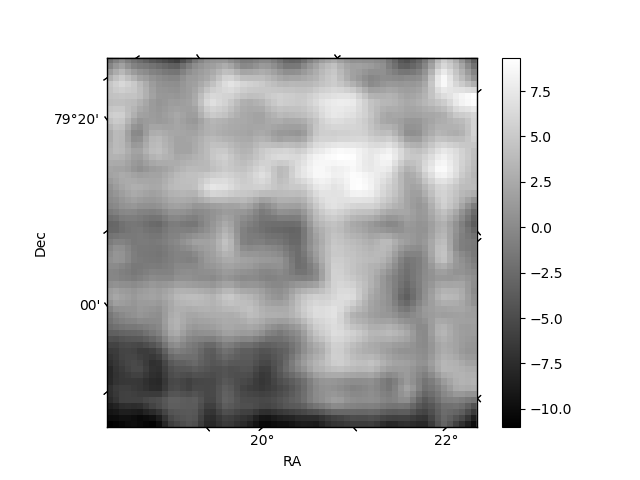
Histogram calculated using DETX and DETY for each event in the final _common_clean file
| Quadrant A | 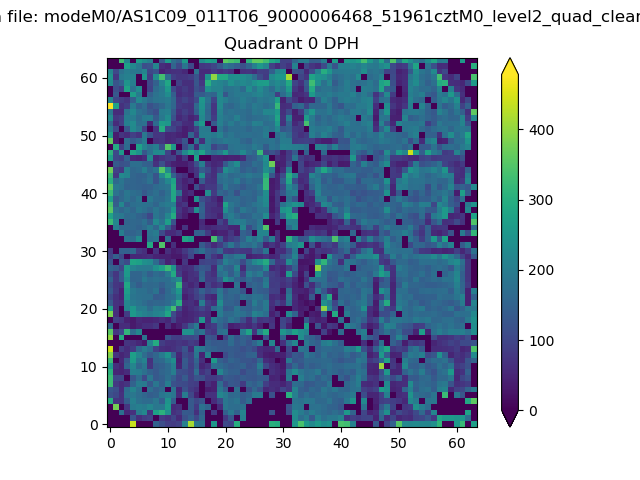 |
 |
Quadrant B |
|---|---|---|---|
| Quadrant D | 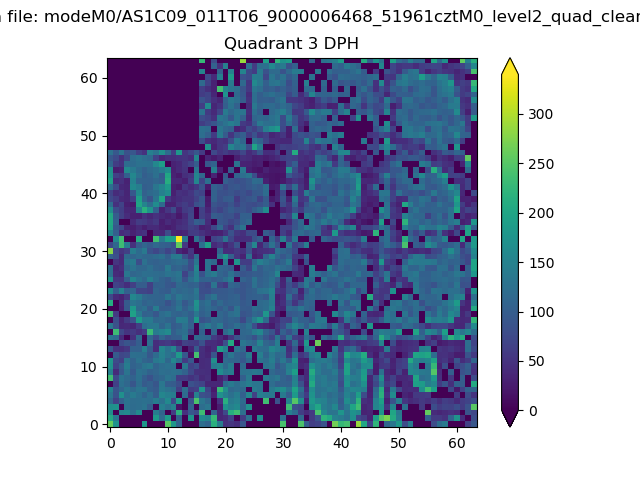 |
 |
Quadrant C |
| Plot type | Count rate plots | Images |
|---|---|---|
| Comparison with Poisson distribution Blue bars denote a histogram of data divided into 1 sec bins. Red curve is a Poisson curve with rate = median count rate of data. |
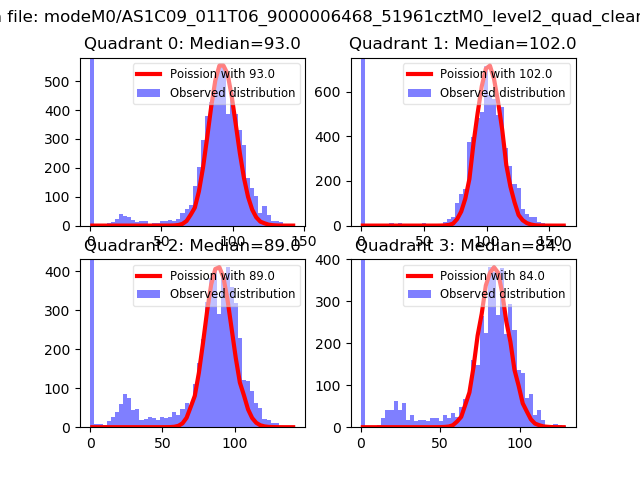 |
 |
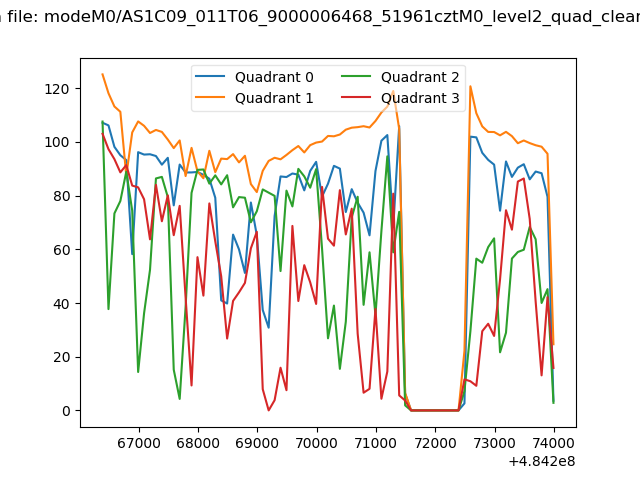
| Quadrant-wise count rates Data is divided into 100 sec bins |
 |
|
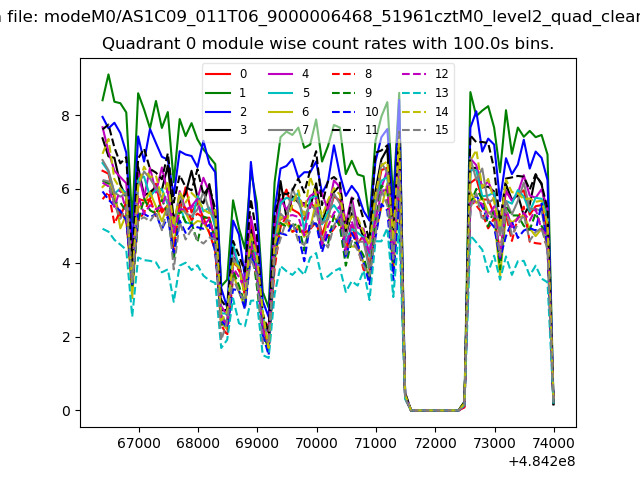
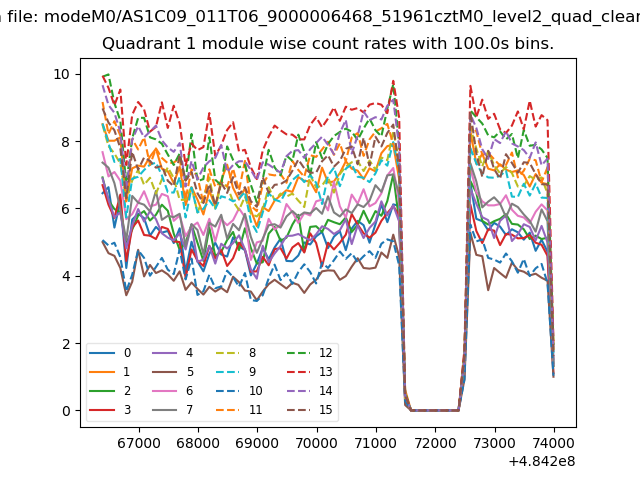
| Module-wise count rates for Quadrant A Data is divided into 100 sec bins |
 |
 |
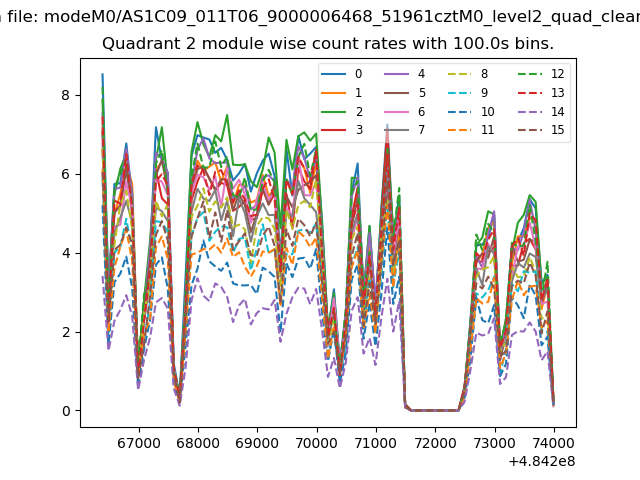
| Module-wise count rates for Quadrant B Data is divided into 100 sec bins |
 |
 |
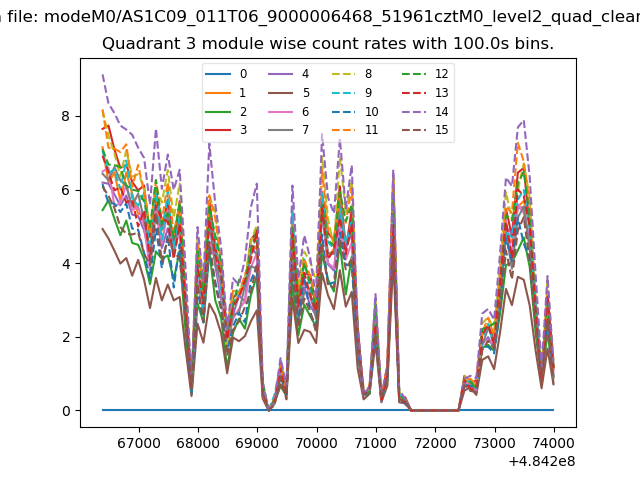
| Module-wise count rates for Quadrant C Data is divided into 100 sec bins |
 |
 |
| Module-wise count rates for Quadrant D Data is divided into 100 sec bins |
 |
 |
| Parameter | Plot |
|---|---|
| CZT HV Monitor | 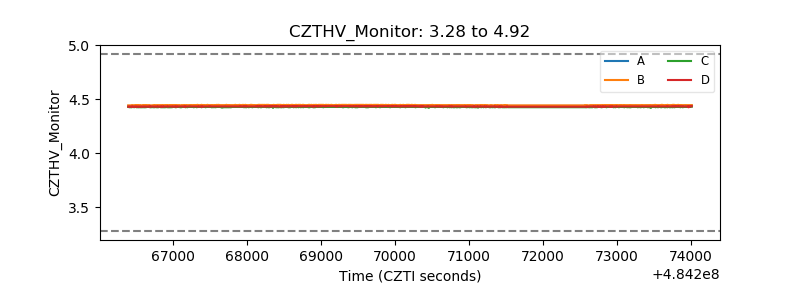 |
| D_VDD | 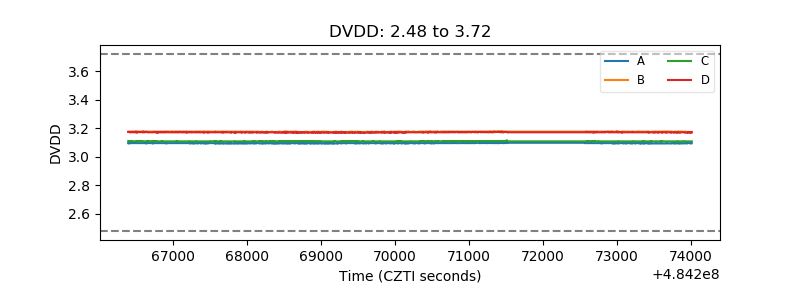 |
| Temperature 1 | 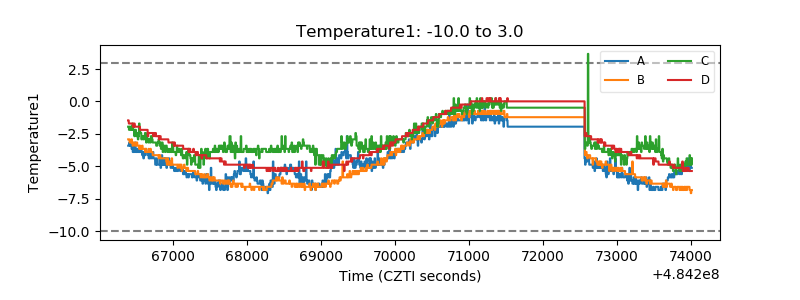 |
| Veto HV Monitor | 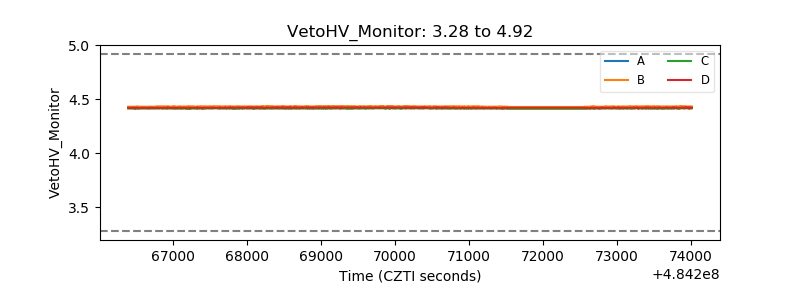 |
| Veto LLD | 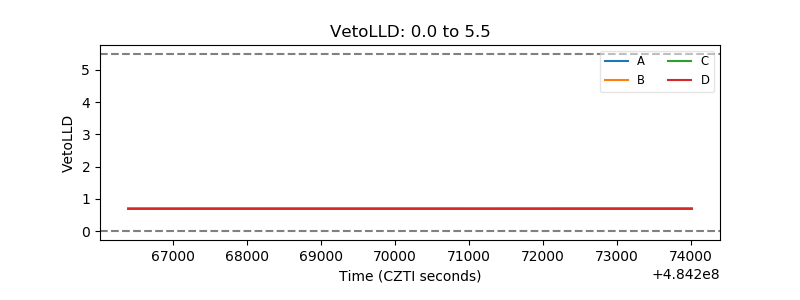 |
| Alpha Counter | 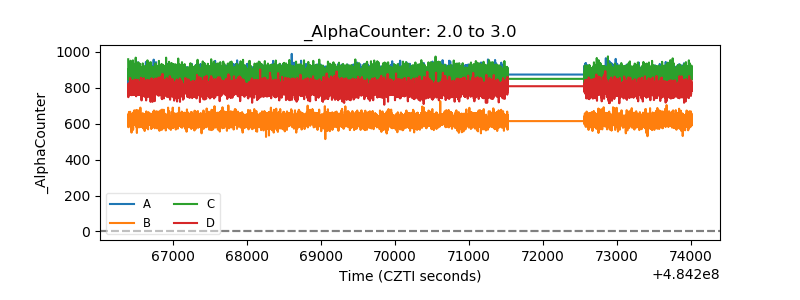 |
| _CPM_Rate | 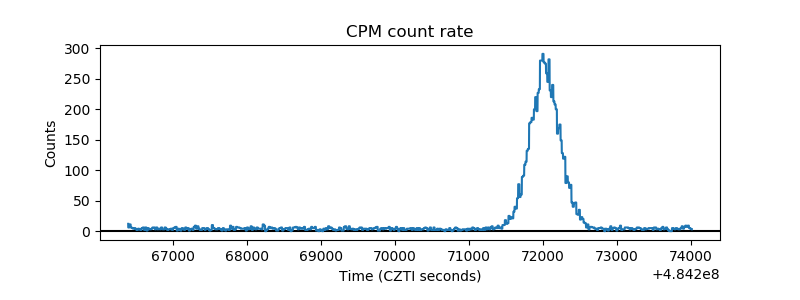 |
| CZT Counter | 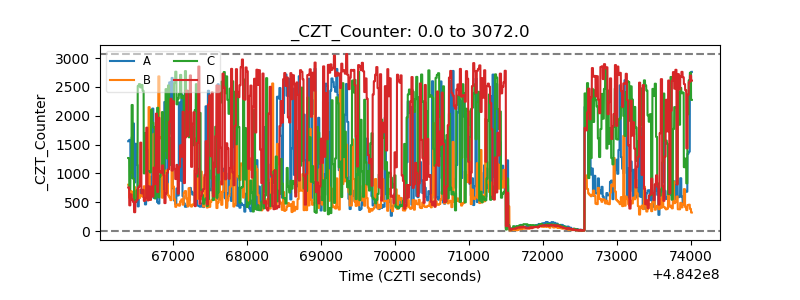 |
| +2.5 Volts monitor | 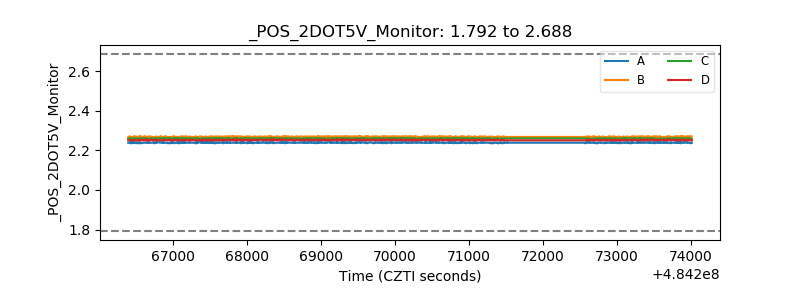 |
| +5 Volts monitor | 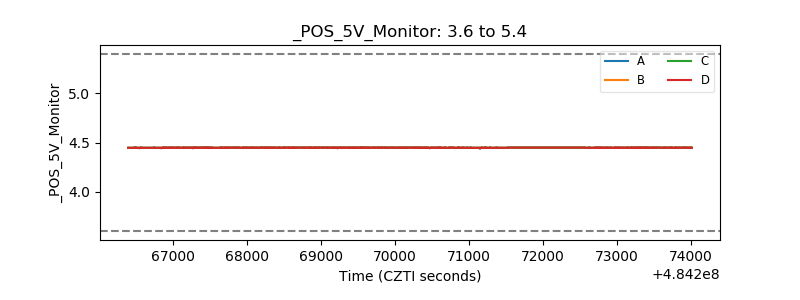 |
| _ROLL_ROT | 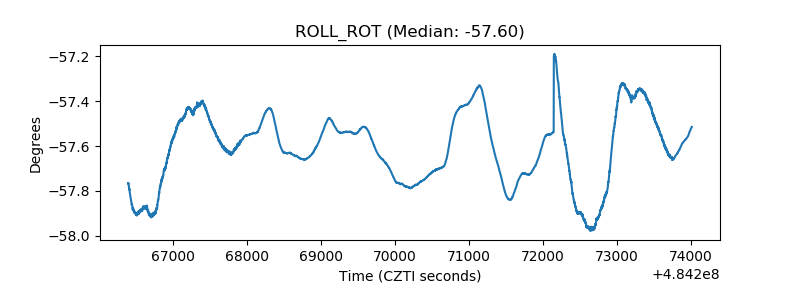 |
| _Roll_DEC | 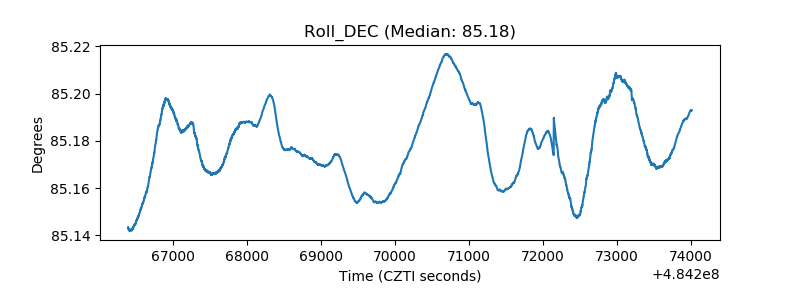 |
| _Roll_RA | 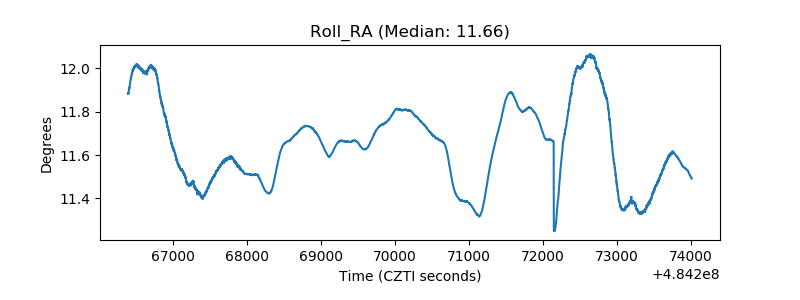 |
| Veto Counter | 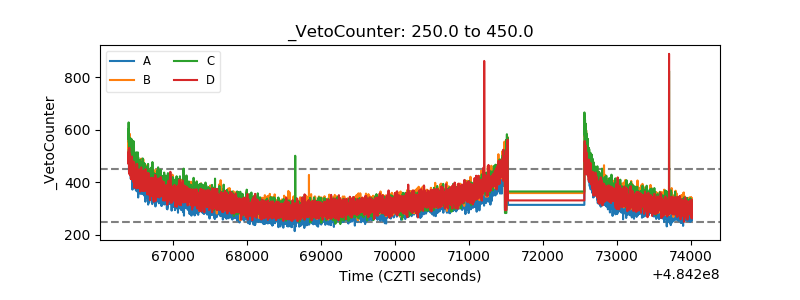 |