| Param | Original file | Final file |
|---|---|---|
| Filename | modeM0/AS1C09_011T06_9000006468_51962cztM0_level2.fits | modeM0/AS1C09_011T06_9000006468_51962cztM0_level2_quad_clean.evt |
| Size (bytes) | 698,209,920 | 54,812,160 |
| Size | 665.9 MB | 52.3 MB |
| Events in quadrant A | 6,466,254 | 323,026 |
| Events in quadrant B | 2,974,171 | 469,060 |
| Events in quadrant C | 8,480,168 | 250,022 |
| Events in quadrant D | 7,553,023 | 279,802 |
| Mode M0 | |||
|---|---|---|---|
| Quadrant | BADHDUFLAG | Total packets | Discarded packets |
| A | 0 | 26348 | 3775 |
| B | 0 | 14310 | 2104 |
| C | 0 | 33099 | 4597 |
| D | 0 | 28477 | 2712 |
| Mode M9 | |||
|---|---|---|---|
| Quadrant | BADHDUFLAG | Total packets | Discarded packets |
| A | 0 | 14 | 12 |
| B | 0 | 8 | 6 |
| C | 0 | 17 | 15 |
| D | 0 | 12 | 10 |
| Mode SS | |||
|---|---|---|---|
| Quadrant | BADHDUFLAG | Total packets | Discarded packets |
| A | 0 | 122 | 26 |
| B | 0 | 128 | 32 |
| C | 0 | 125 | 29 |
| D | 0 | 117 | 21 |
| Quadrant | Total seconds | Saturated seconds | Saturation percentage |
|---|---|---|---|
| A | 4804 | 1443 | 30.037469% |
| B | 4807 | 136 | 2.829207% |
| C | 4801 | 2361 | 49.177255% |
| D | 4810 | 1662 | 34.553015% |
Noise dominated data is calculated using 1-second bins in cleaned event files. If a bin has >2000 counts, and if more than 50% of those come from <1% of pixels, then it is considered to be noise-dominated and hence unusable.
| Quadrant | # 1 sec bins | Bins with >0 counts | Bins with >2000 counts | High rate bins dominated by noise | Noise dominated (total time) | Noise dominated (detector-on time) | Marked lightcurve |
|---|---|---|---|---|---|---|---|
| A | 7903 | 4812 | 1154 | 1154 | 14.60% | 23.98% | 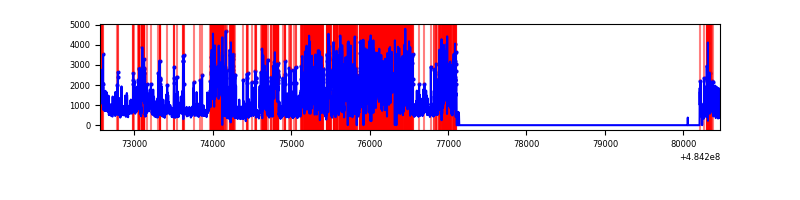 |
| B | 7903 | 4819 | 101 | 101 | 1.28% | 2.10% | 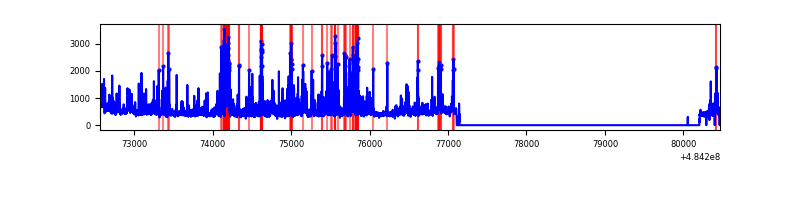 |
| C | 7903 | 4805 | 1852 | 1852 | 23.43% | 38.54% | 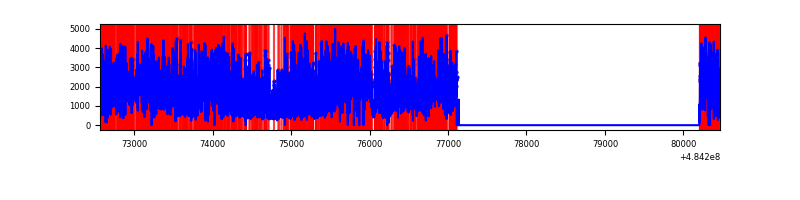 |
| D | 7901 | 4816 | 1705 | 1705 | 21.58% | 35.40% | 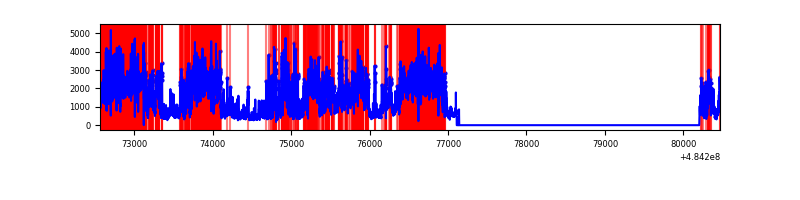 |
Top three noisy pixels from each quadrant. If the there are fewer than three noisy pixels in the level2.evt file, extra rows are filled as -1
| Pixel properties | Quadrant properties | ||||||
|---|---|---|---|---|---|---|---|
| Quadrant | DetID | PixID | Counts | Sigma | Mean | Median | Sigma |
| A | 4 | 159 | 2545535 | 25208.21 | 394 | 385 | 101.0 |
| A | 7 | 64 | 834042 | 8256.88 | 394 | 385 | 101.0 |
| A | 4 | 95 | 411011 | 4067.01 | 394 | 385 | 101.0 |
| B | 5 | 185 | 438650 | 4346.9 | 468 | 452 | 100.8 |
| B | 10 | 44 | 101113 | 998.55 | 468 | 452 | 100.8 |
| B | 4 | 81 | 95749 | 945.34 | 468 | 452 | 100.8 |
| C | 15 | 224 | 5374124 | 54127.54 | 347 | 343 | 99.3 |
| C | 13 | 3 | 424334 | 4270.66 | 347 | 343 | 99.3 |
| C | 15 | 192 | 382129 | 3845.55 | 347 | 343 | 99.3 |
| D | 6 | 42 | 4787140 | 42711.81 | 389 | 370 | 112.1 |
| D | 12 | 17 | 637848 | 5688.14 | 389 | 370 | 112.1 |
| D | 2 | 120 | 92176 | 819.17 | 389 | 370 | 112.1 |
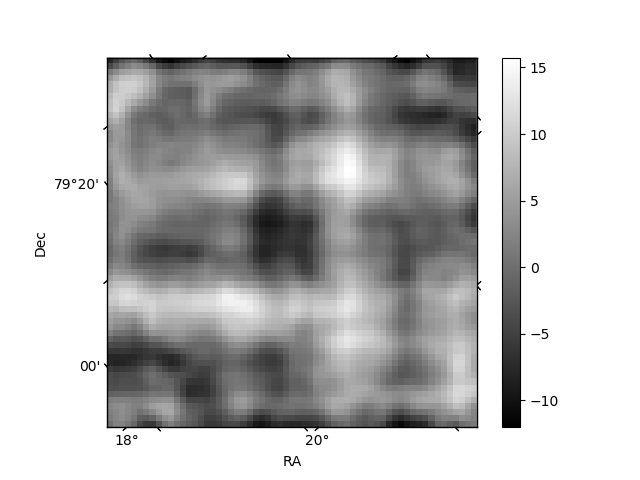
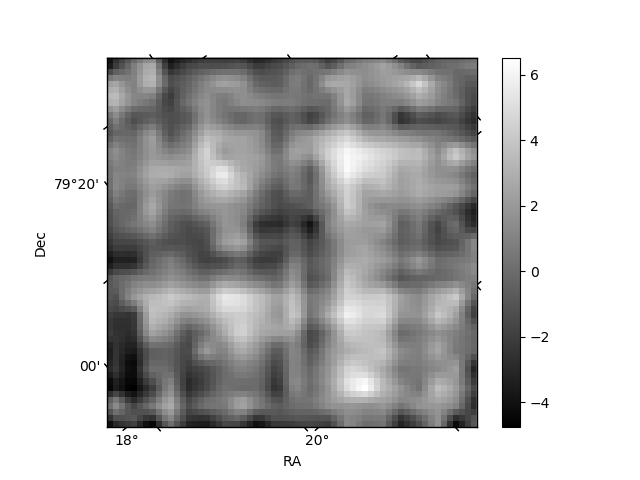
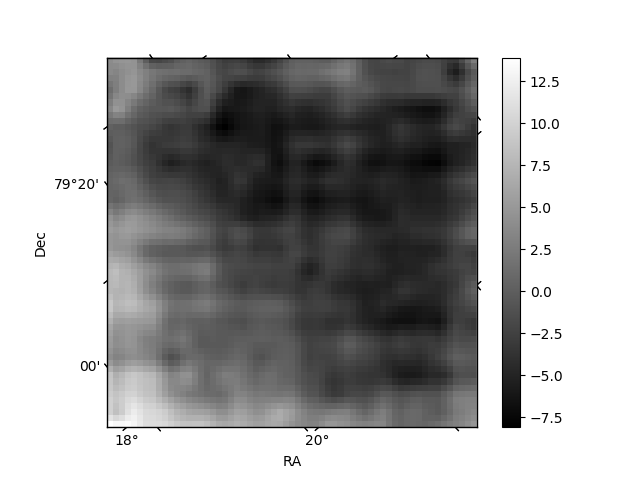
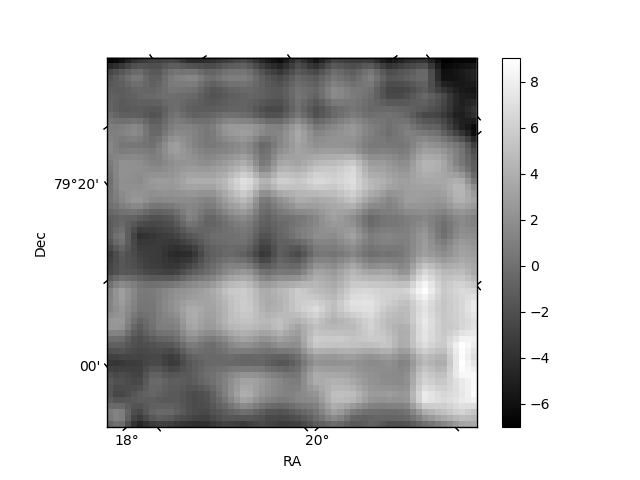
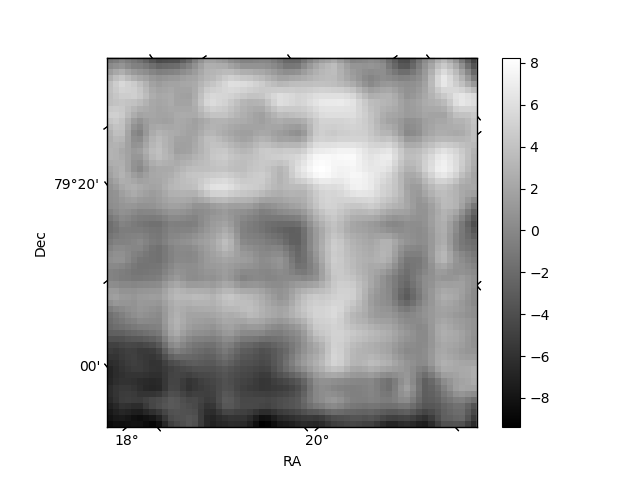
Histogram calculated using DETX and DETY for each event in the final _common_clean file
| Quadrant A | 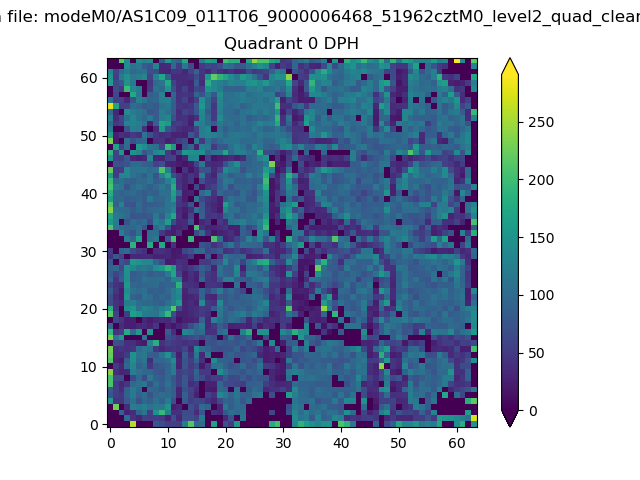 |
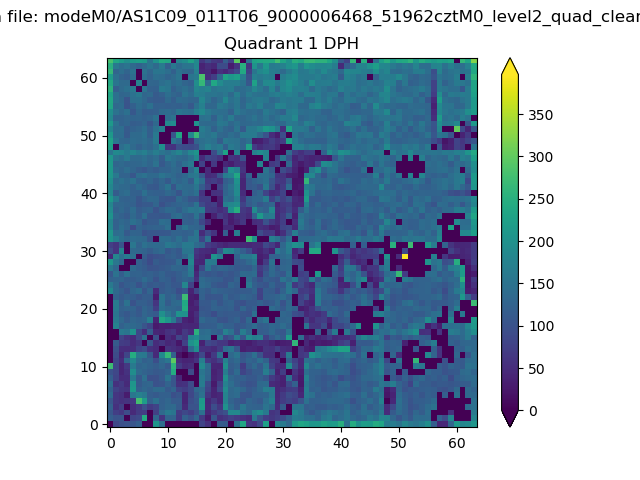 |
Quadrant B |
|---|---|---|---|
| Quadrant D | 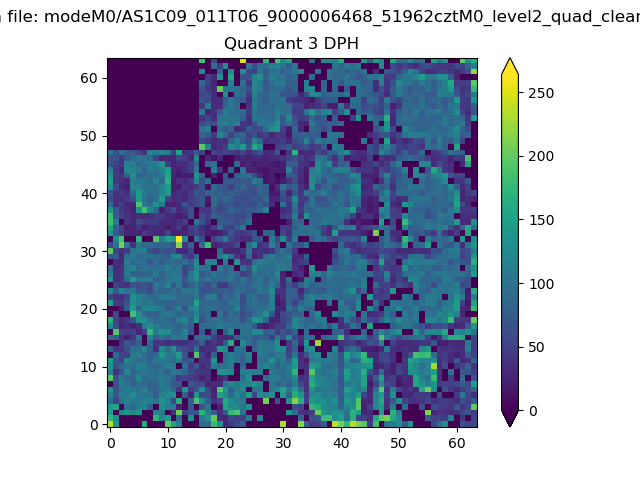 |
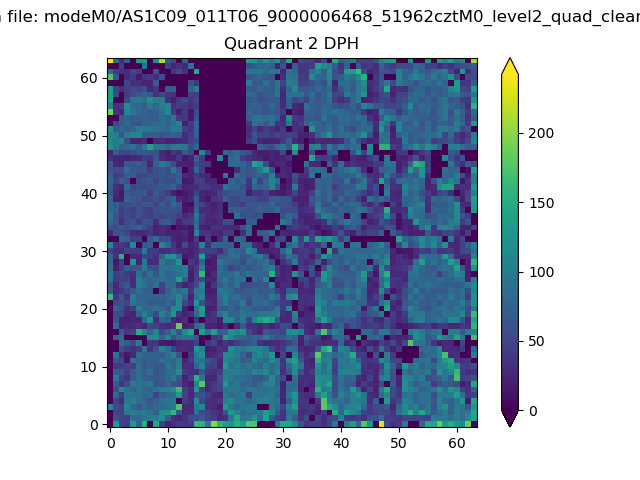 |
Quadrant C |
| Plot type | Count rate plots | Images |
|---|---|---|
| Comparison with Poisson distribution Blue bars denote a histogram of data divided into 1 sec bins. Red curve is a Poisson curve with rate = median count rate of data. |
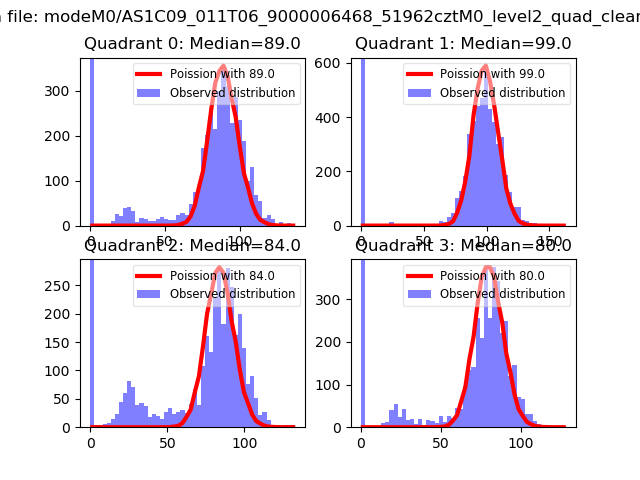 |
 |
| Quadrant-wise count rates Data is divided into 100 sec bins |
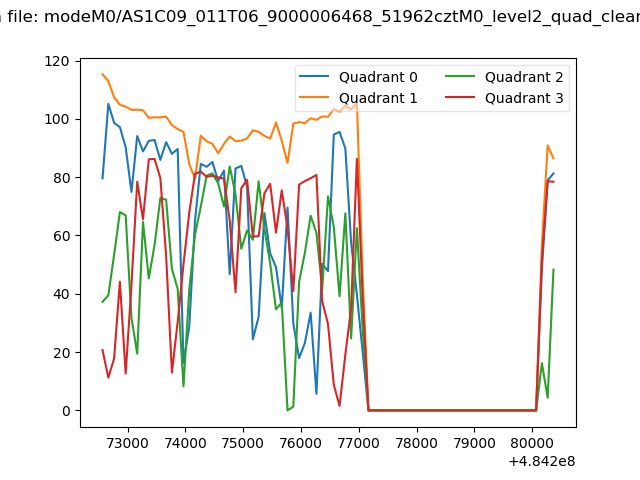 |
|
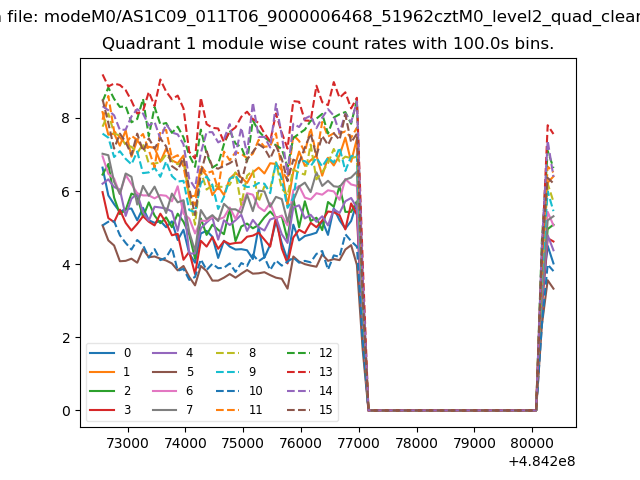
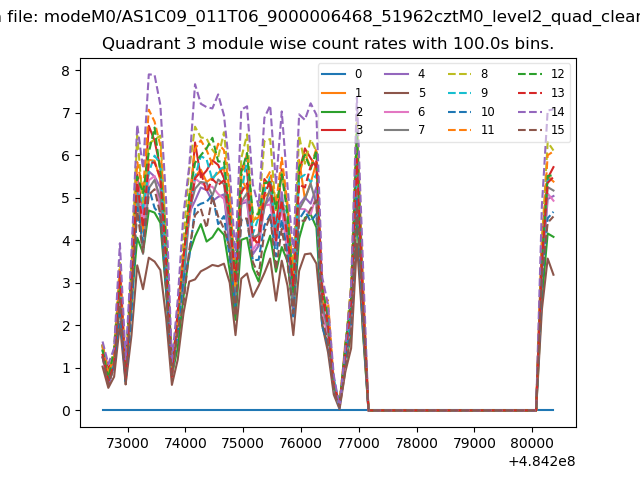
| Module-wise count rates for Quadrant A Data is divided into 100 sec bins |
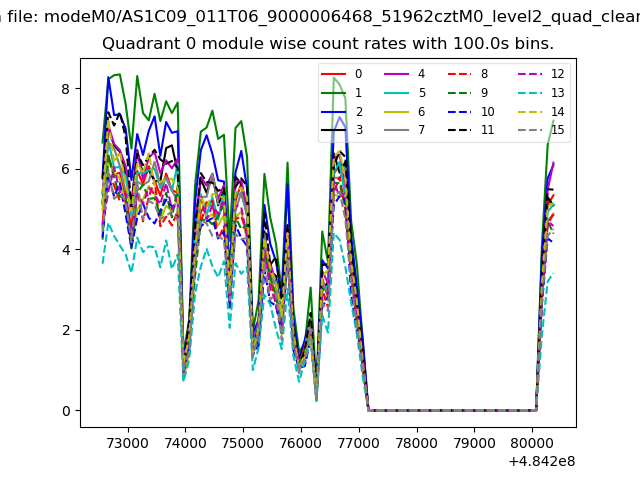 |
 |
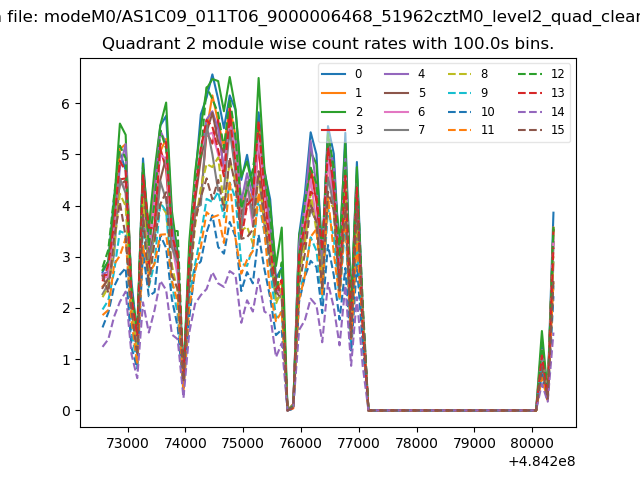
| Module-wise count rates for Quadrant B Data is divided into 100 sec bins |
 |
 |
| Module-wise count rates for Quadrant C Data is divided into 100 sec bins |
 |
 |
| Module-wise count rates for Quadrant D Data is divided into 100 sec bins |
 |
 |
| Parameter | Plot |
|---|---|
| CZT HV Monitor | 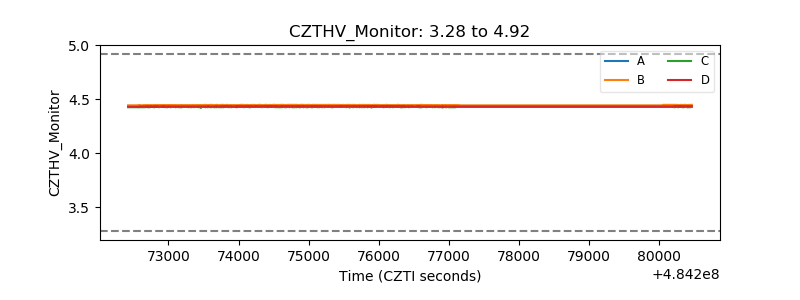 |
| D_VDD | 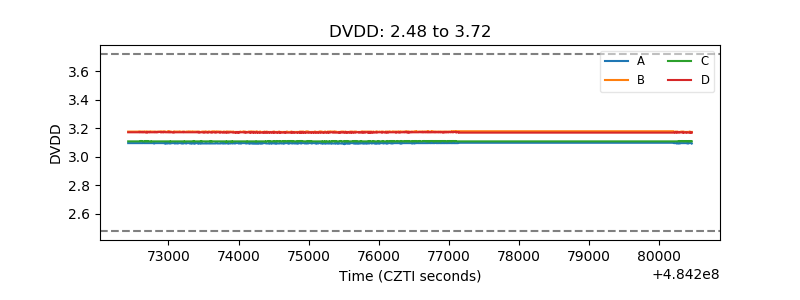 |
| Temperature 1 | 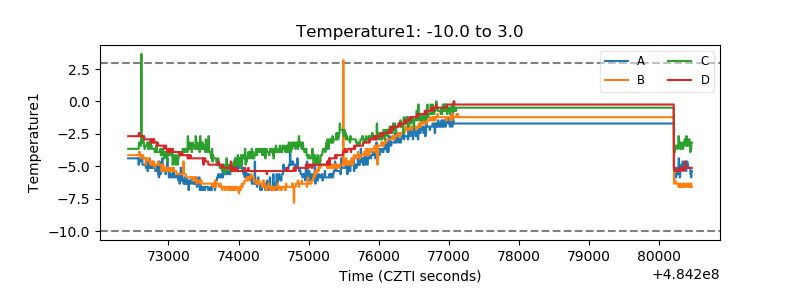 |
| Veto HV Monitor | 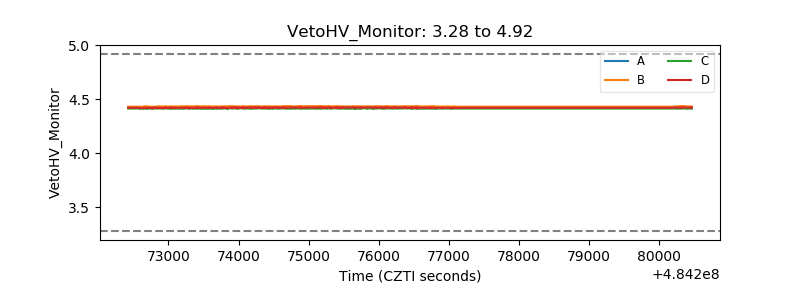 |
| Veto LLD | 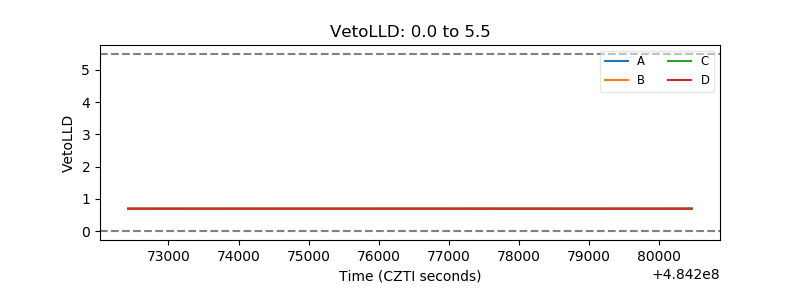 |
| Alpha Counter | 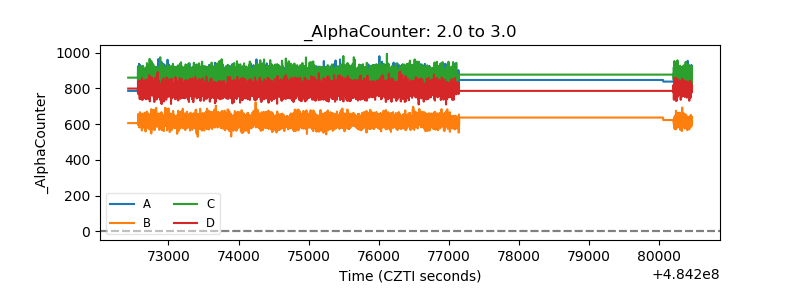 |
| _CPM_Rate | 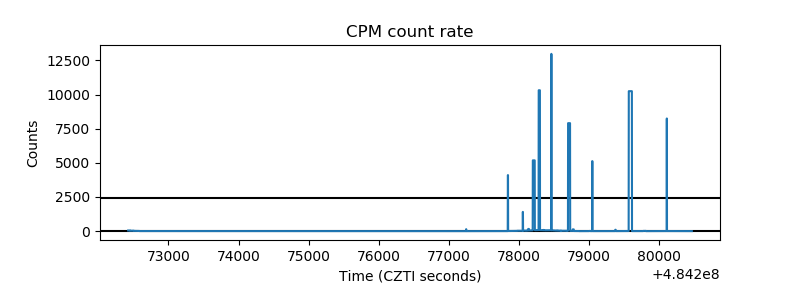 |
| CZT Counter | 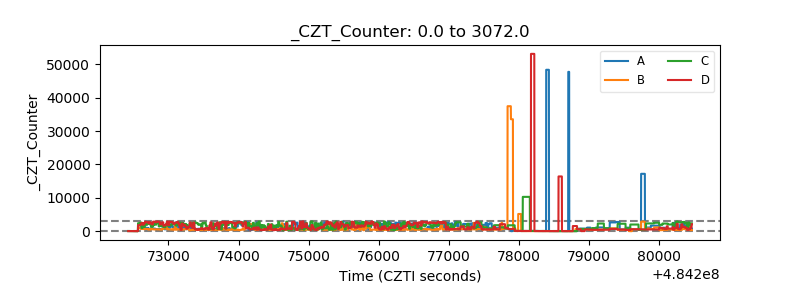 |
| +2.5 Volts monitor | 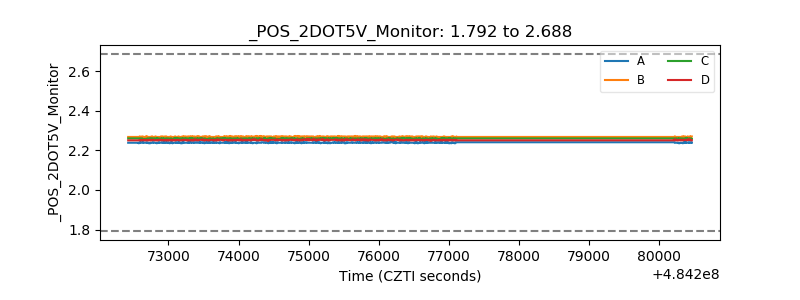 |
| +5 Volts monitor | 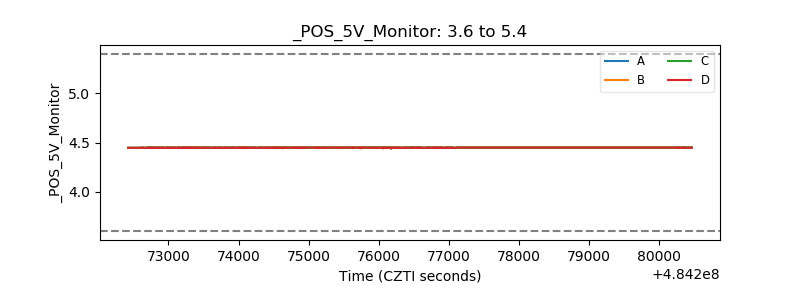 |
| _ROLL_ROT | 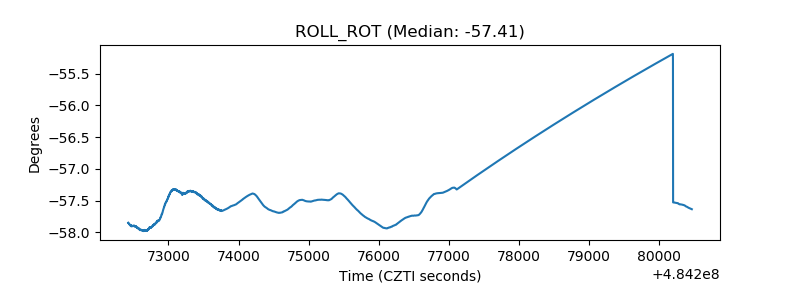 |
| _Roll_DEC | 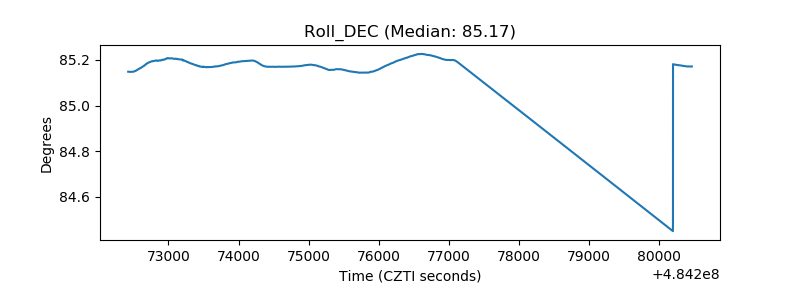 |
| _Roll_RA | 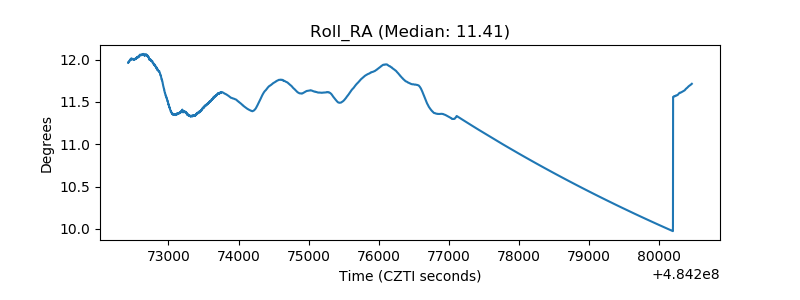 |
| Veto Counter | 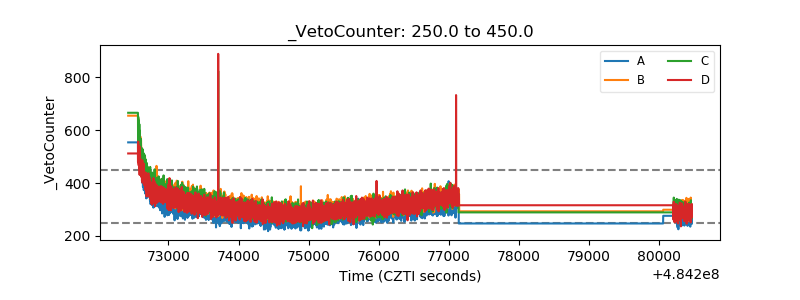 |