| Param | Original file | Final file |
|---|---|---|
| Filename | modeM0/AS1C09_011T06_9000006468_51963cztM0_level2.fits | modeM0/AS1C09_011T06_9000006468_51963cztM0_level2_quad_clean.evt |
| Size (bytes) | 999,786,240 | 78,600,960 |
| Size | 953.5 MB | 75.0 MB |
| Events in quadrant A | 7,644,999 | 537,360 |
| Events in quadrant B | 5,388,421 | 635,927 |
| Events in quadrant C | 11,204,733 | 371,541 |
| Events in quadrant D | 12,244,307 | 358,468 |
| Mode M0 | |||
|---|---|---|---|
| Quadrant | BADHDUFLAG | Total packets | Discarded packets |
| A | 0 | 27480 | 1 |
| B | 0 | 20719 | 1 |
| C | 0 | 38000 | 1 |
| D | 0 | 41118 | 1 |
| Mode M9 | |||
|---|---|---|---|
| Quadrant | BADHDUFLAG | Total packets | Discarded packets |
| A | 0 | 3 | 0 |
| B | 0 | 3 | 0 |
| C | 0 | 3 | 0 |
| D | 0 | 3 | 0 |
| Mode SS | |||
|---|---|---|---|
| Quadrant | BADHDUFLAG | Total packets | Discarded packets |
| A | 0 | 142 | 0 |
| B | 0 | 142 | 0 |
| C | 0 | 142 | 0 |
| D | 0 | 142 | 0 |
| Quadrant | Total seconds | Saturated seconds | Saturation percentage |
|---|---|---|---|
| A | 6829 | 1127 | 16.503148% |
| B | 6829 | 597 | 8.742129% |
| C | 6829 | 3059 | 44.794260% |
| D | 6830 | 2932 | 42.928258% |
Noise dominated data is calculated using 1-second bins in cleaned event files. If a bin has >2000 counts, and if more than 50% of those come from <1% of pixels, then it is considered to be noise-dominated and hence unusable.
| Quadrant | # 1 sec bins | Bins with >0 counts | Bins with >2000 counts | High rate bins dominated by noise | Noise dominated (total time) | Noise dominated (detector-on time) | Marked lightcurve |
|---|---|---|---|---|---|---|---|
| A | 7069 | 6831 | 865 | 865 | 12.24% | 12.66% | 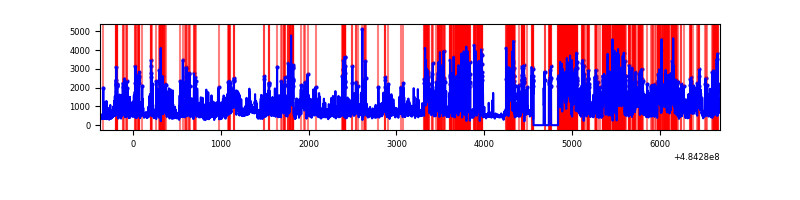 |
| B | 7069 | 6831 | 369 | 369 | 5.22% | 5.40% | 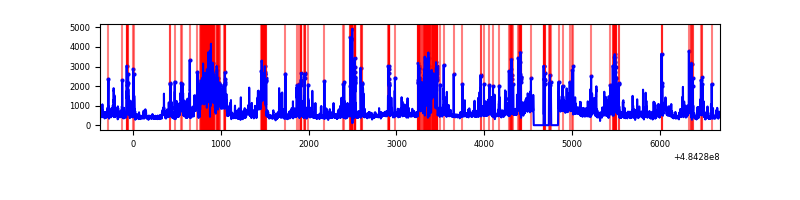 |
| C | 7069 | 6830 | 2296 | 2296 | 32.48% | 33.62% | 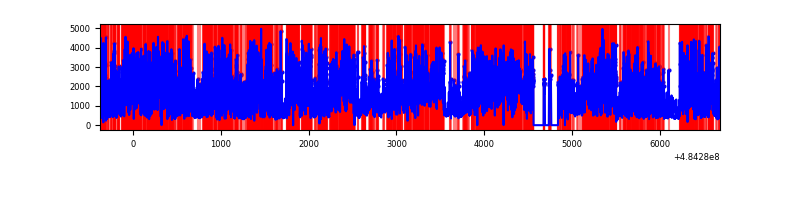 |
| D | 7070 | 6833 | 2828 | 2828 | 40.00% | 41.39% | 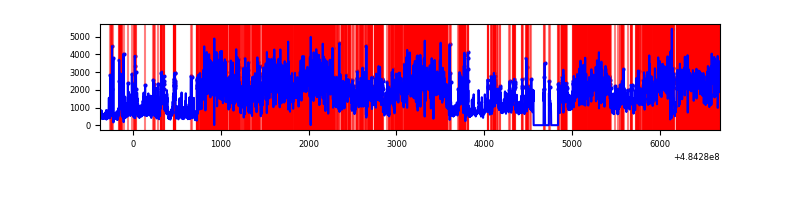 |
Top three noisy pixels from each quadrant. If the there are fewer than three noisy pixels in the level2.evt file, extra rows are filled as -1
| Pixel properties | Quadrant properties | ||||||
|---|---|---|---|---|---|---|---|
| Quadrant | DetID | PixID | Counts | Sigma | Mean | Median | Sigma |
| A | 7 | 64 | 2396394 | 15045.18 | 642 | 626 | 159.2 |
| A | 4 | 95 | 1632175 | 10245.96 | 642 | 626 | 159.2 |
| A | 15 | 250 | 146542 | 916.34 | 642 | 626 | 159.2 |
| B | 4 | 249 | 752814 | 5230.87 | 680 | 657 | 143.8 |
| B | 10 | 254 | 533203 | 3703.59 | 680 | 657 | 143.8 |
| B | 5 | 185 | 518543 | 3601.63 | 680 | 657 | 143.8 |
| C | 15 | 224 | 7393693 | 49444.88 | 531 | 525 | 149.5 |
| C | 15 | 192 | 489705 | 3271.59 | 531 | 525 | 149.5 |
| C | 0 | 193 | 477518 | 3190.09 | 531 | 525 | 149.5 |
| D | 6 | 42 | 7215120 | 44712.3 | 561 | 537 | 161.4 |
| D | 12 | 17 | 1097380 | 6797.67 | 561 | 537 | 161.4 |
| D | 10 | 181 | 387667 | 2399.23 | 561 | 537 | 161.4 |
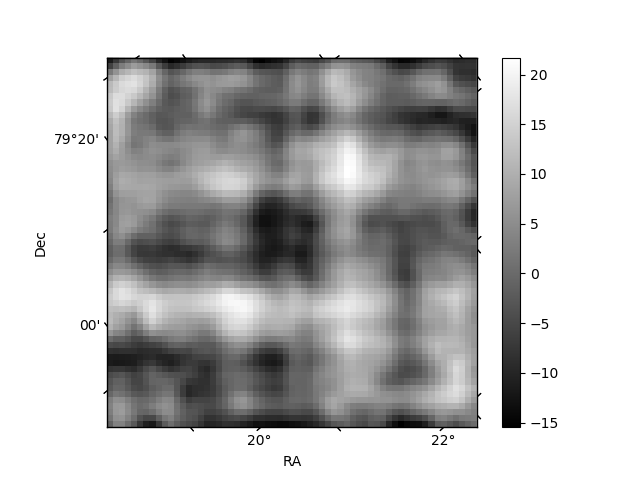
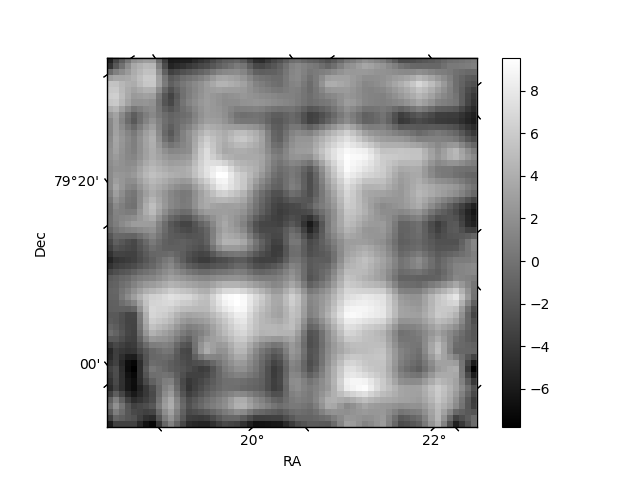
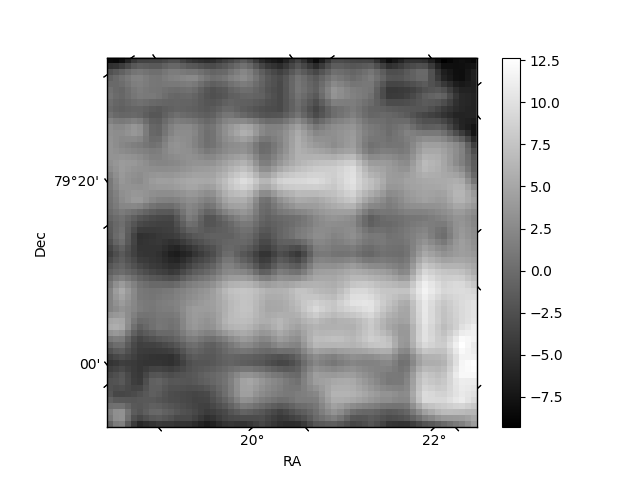
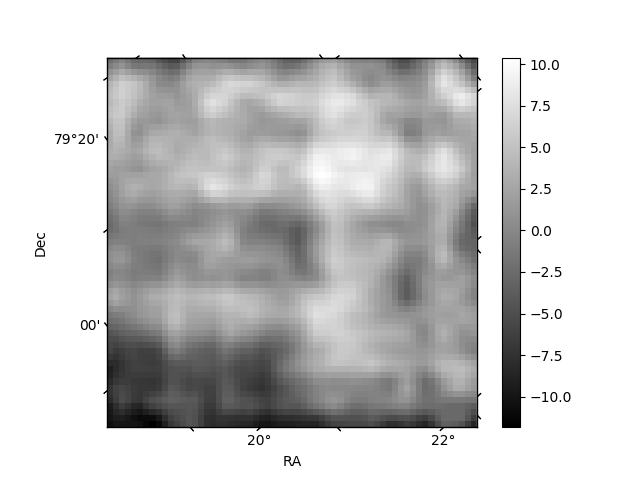
Histogram calculated using DETX and DETY for each event in the final _common_clean file
| Quadrant A | 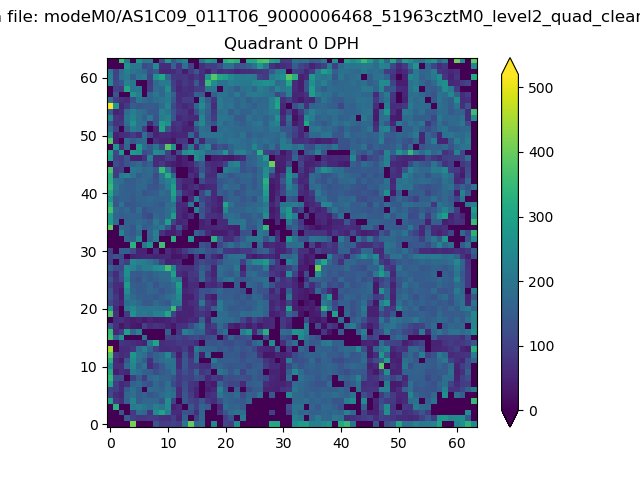 |
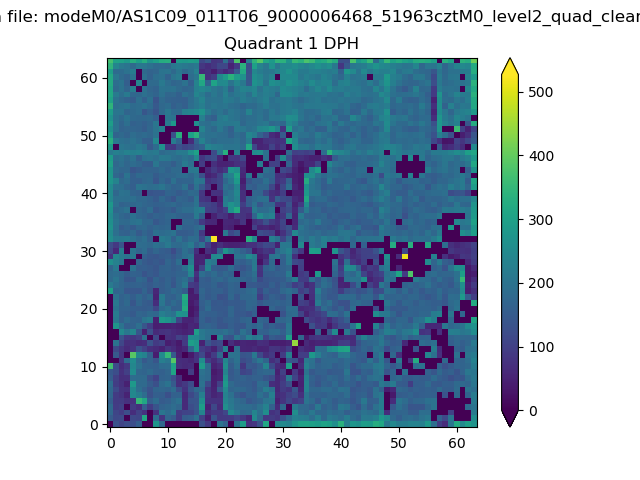 |
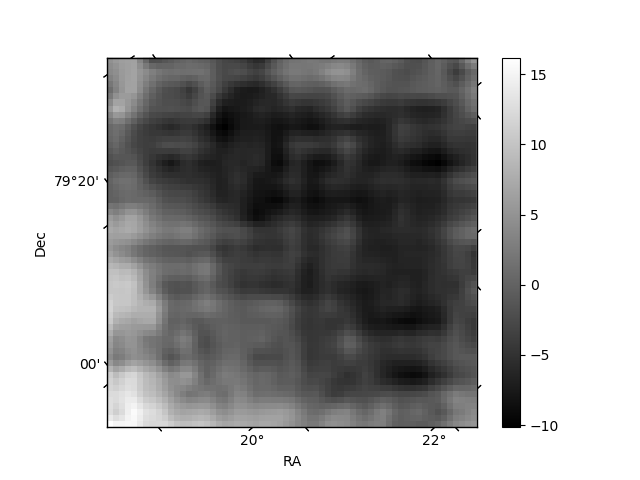
Quadrant B |
|---|---|---|---|
| Quadrant D | 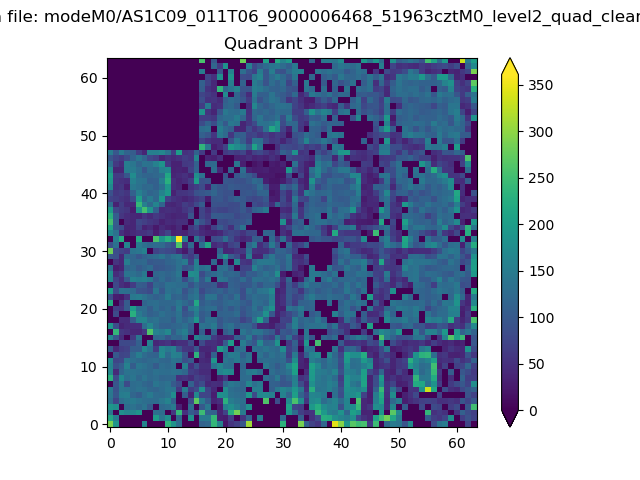 |
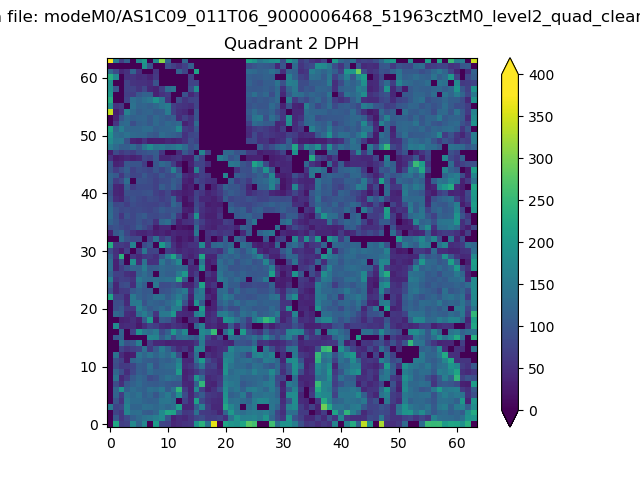 |
Quadrant C |
| Plot type | Count rate plots | Images |
|---|---|---|
| Comparison with Poisson distribution Blue bars denote a histogram of data divided into 1 sec bins. Red curve is a Poisson curve with rate = median count rate of data. |
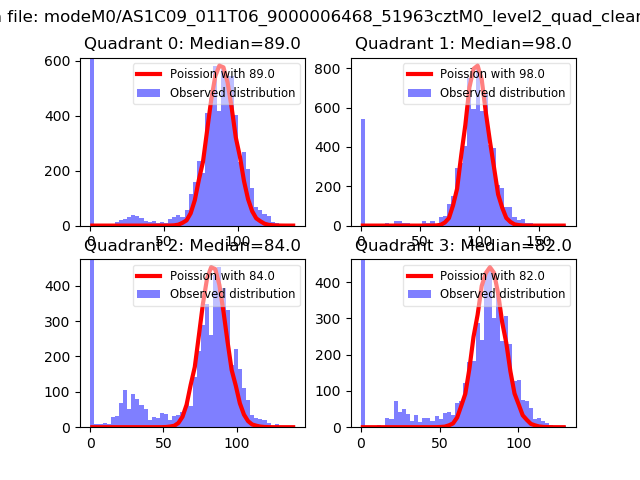 |
 |
| Quadrant-wise count rates Data is divided into 100 sec bins |
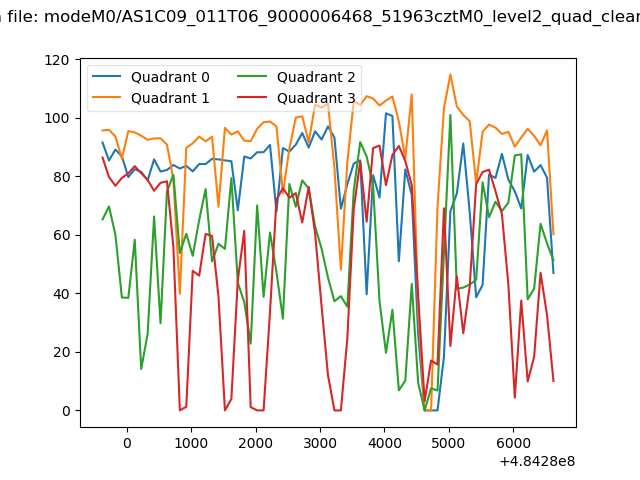 |
|
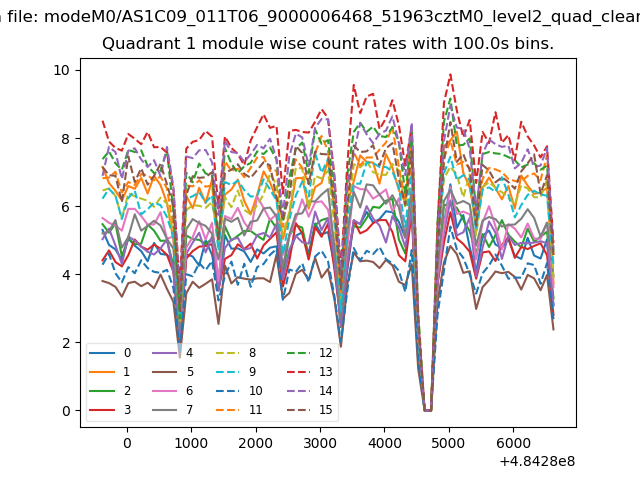
| Module-wise count rates for Quadrant A Data is divided into 100 sec bins |
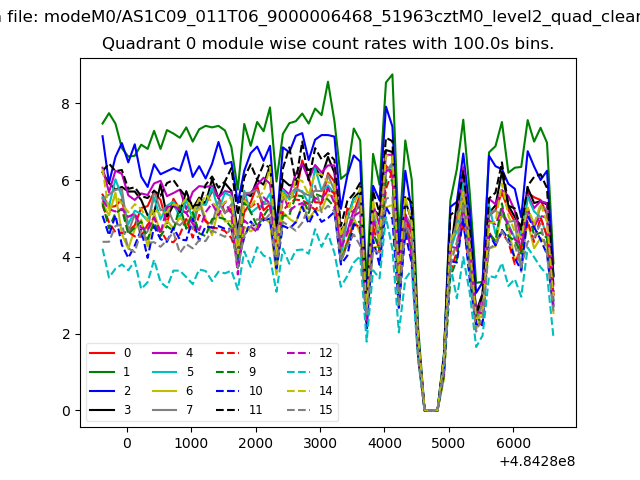 |
 |
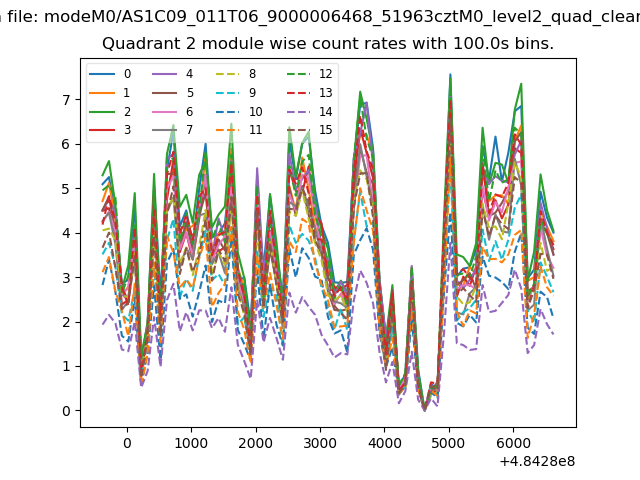
| Module-wise count rates for Quadrant B Data is divided into 100 sec bins |
 |
 |
| Module-wise count rates for Quadrant C Data is divided into 100 sec bins |
 |
 |
| Module-wise count rates for Quadrant D Data is divided into 100 sec bins |
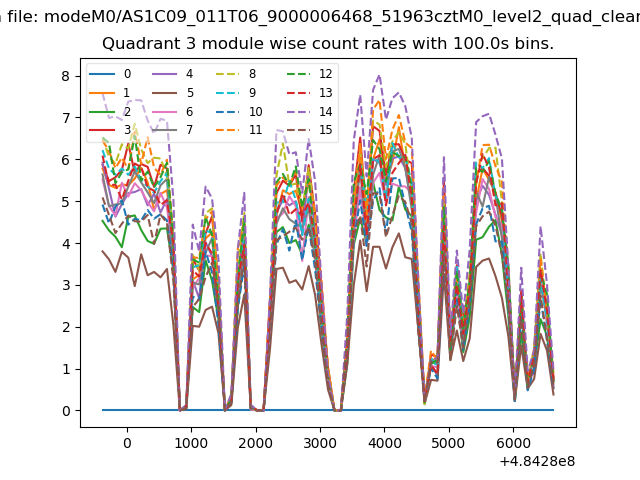 |
 |
| Parameter | Plot |
|---|---|
| CZT HV Monitor | 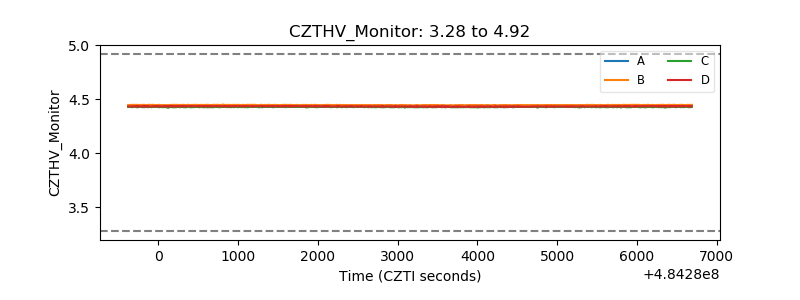 |
| D_VDD | 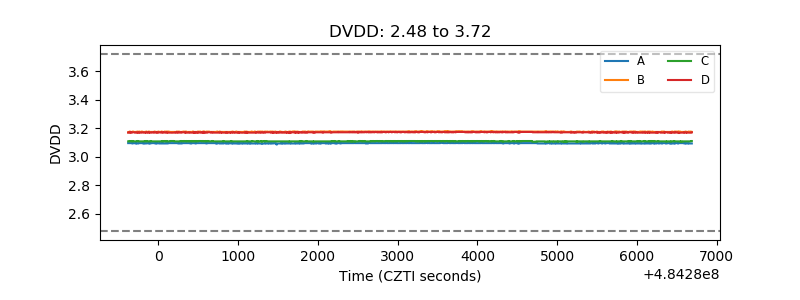 |
| Temperature 1 | 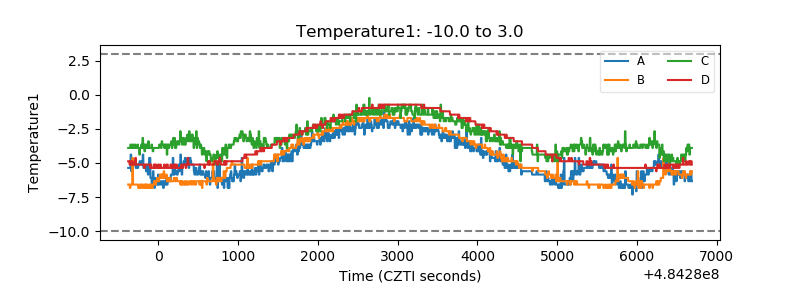 |
| Veto HV Monitor | 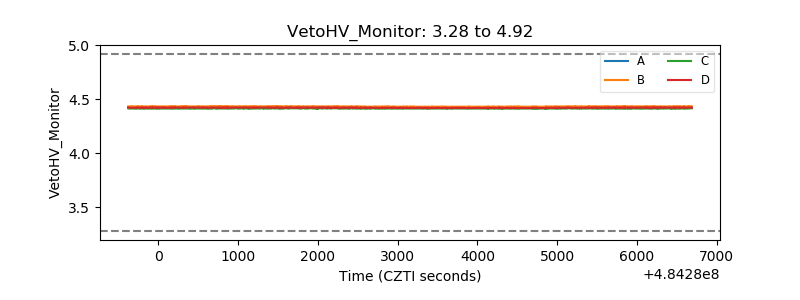 |
| Veto LLD | 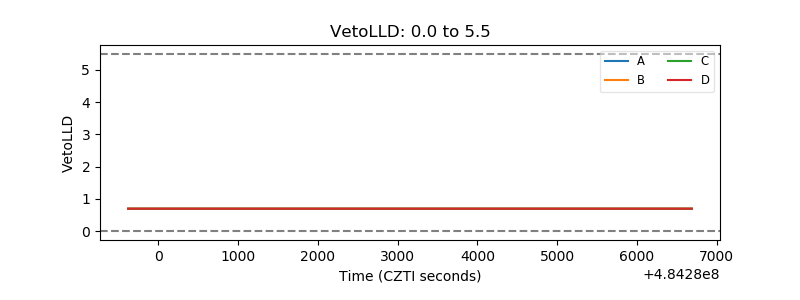 |
| Alpha Counter | 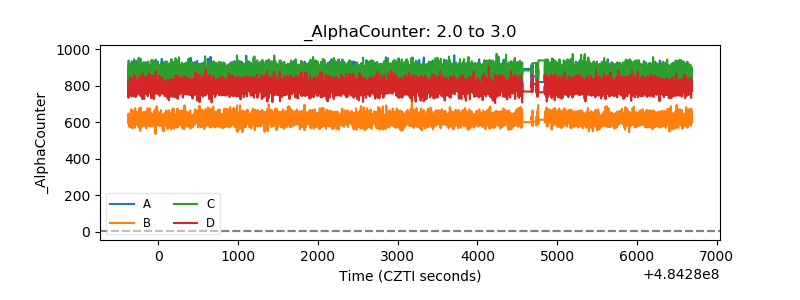 |
| _CPM_Rate | 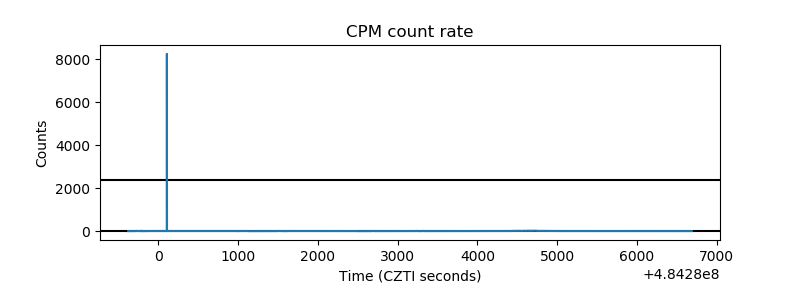 |
| CZT Counter | 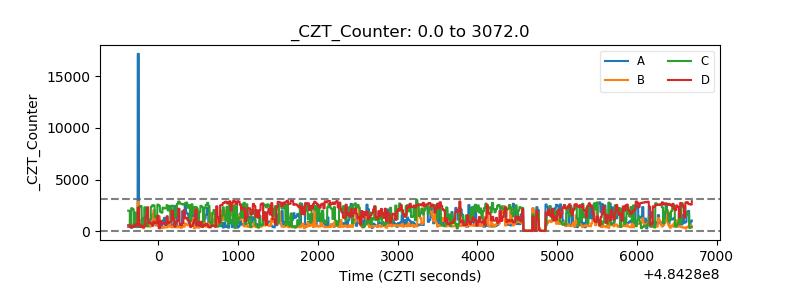 |
| +2.5 Volts monitor | 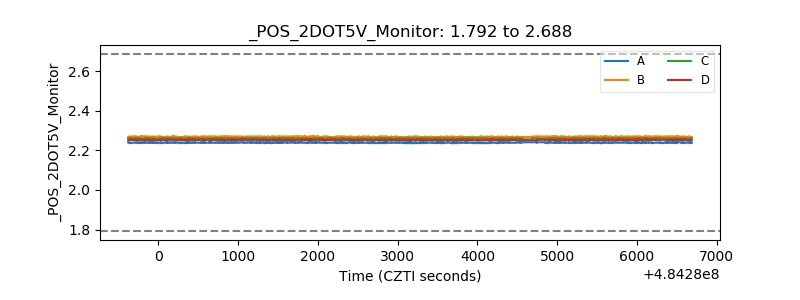 |
| +5 Volts monitor | 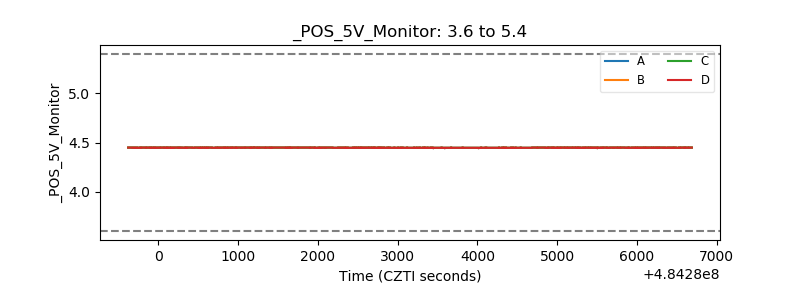 |
| _ROLL_ROT | 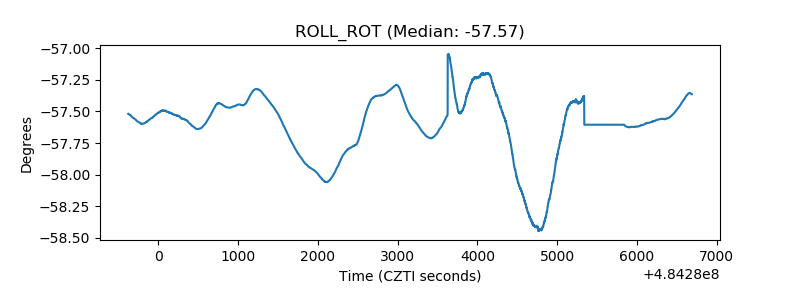 |
| _Roll_DEC | 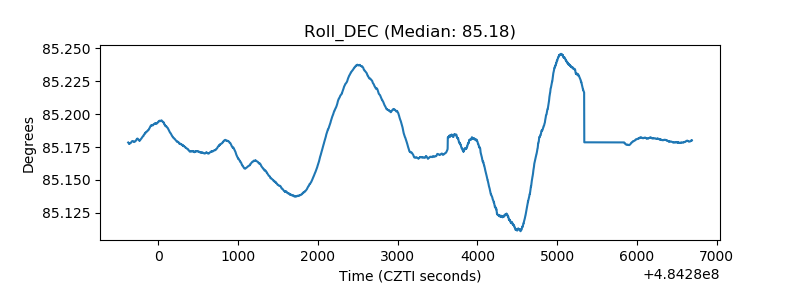 |
| _Roll_RA | 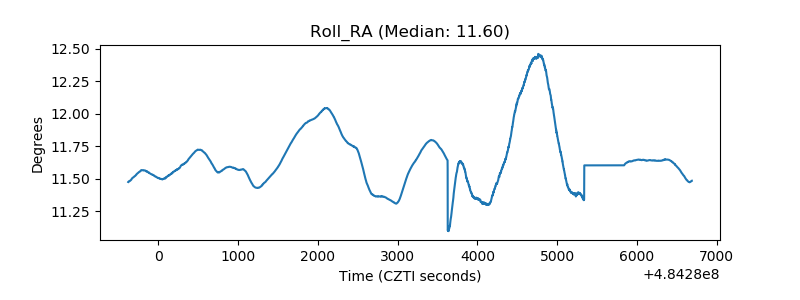 |
| Veto Counter | 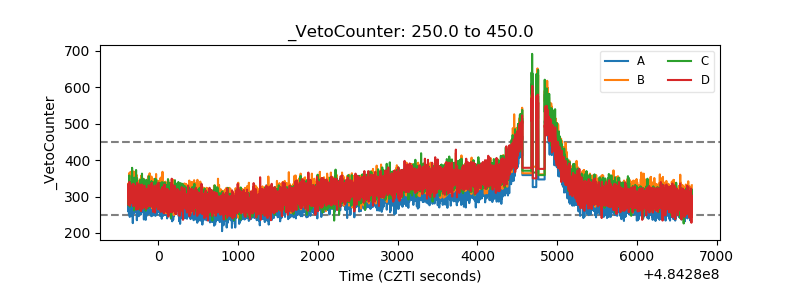 |