| Param | Original file | Final file |
|---|---|---|
| Filename | modeM0/AS1C09_011T06_9000006468_51964cztM0_level2.fits | modeM0/AS1C09_011T06_9000006468_51964cztM0_level2_quad_clean.evt |
| Size (bytes) | 1,041,670,080 | 79,200,000 |
| Size | 993.4 MB | 75.5 MB |
| Events in quadrant A | 6,813,574 | 593,790 |
| Events in quadrant B | 5,322,722 | 663,069 |
| Events in quadrant C | 11,837,617 | 362,537 |
| Events in quadrant D | 14,046,391 | 290,785 |
| Mode M0 | |||
|---|---|---|---|
| Quadrant | BADHDUFLAG | Total packets | Discarded packets |
| A | 0 | 25049 | 0 |
| B | 0 | 20670 | 0 |
| C | 0 | 39993 | 0 |
| D | 0 | 46529 | 0 |
| Mode SS | |||
|---|---|---|---|
| Quadrant | BADHDUFLAG | Total packets | Discarded packets |
| A | 0 | 140 | 0 |
| B | 0 | 140 | 0 |
| C | 0 | 140 | 0 |
| D | 0 | 140 | 0 |
| Quadrant | Total seconds | Saturated seconds | Saturation percentage |
|---|---|---|---|
| A | 6992 | 735 | 10.512014% |
| B | 6992 | 443 | 6.335812% |
| C | 6992 | 3376 | 48.283753% |
| D | 6993 | 3895 | 55.698556% |
Noise dominated data is calculated using 1-second bins in cleaned event files. If a bin has >2000 counts, and if more than 50% of those come from <1% of pixels, then it is considered to be noise-dominated and hence unusable.
| Quadrant | # 1 sec bins | Bins with >0 counts | Bins with >2000 counts | High rate bins dominated by noise | Noise dominated (total time) | Noise dominated (detector-on time) | Marked lightcurve |
|---|---|---|---|---|---|---|---|
| A | 6992 | 6992 | 704 | 704 | 10.07% | 10.07% | 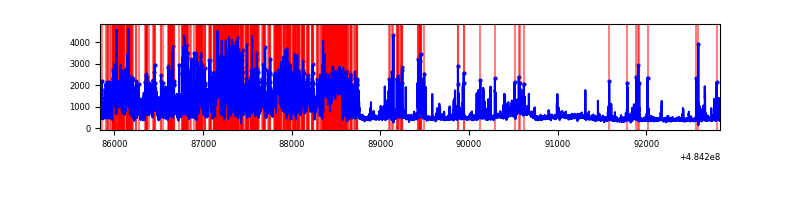 |
| B | 6992 | 6992 | 287 | 287 | 4.10% | 4.10% | 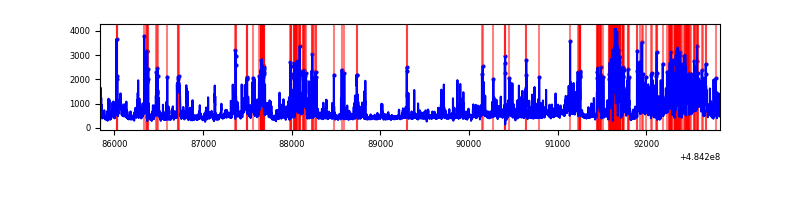 |
| C | 6992 | 6992 | 2530 | 2530 | 36.18% | 36.18% | 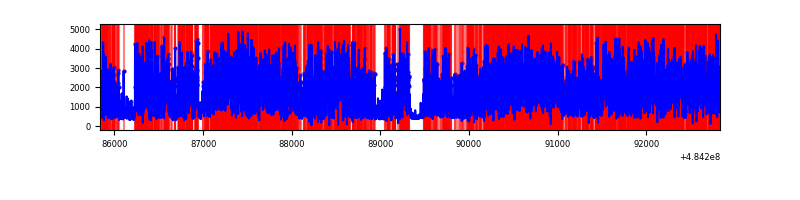 |
| D | 6993 | 6993 | 3845 | 3845 | 54.98% | 54.98% | 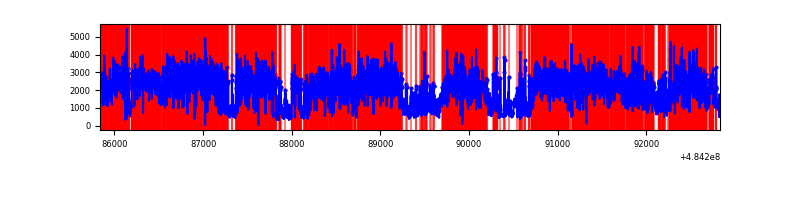 |
Top three noisy pixels from each quadrant. If the there are fewer than three noisy pixels in the level2.evt file, extra rows are filled as -1
| Pixel properties | Quadrant properties | ||||||
|---|---|---|---|---|---|---|---|
| Quadrant | DetID | PixID | Counts | Sigma | Mean | Median | Sigma |
| A | 4 | 95 | 1958848 | 11535.83 | 689 | 673 | 169.7 |
| A | 7 | 64 | 1261255 | 7426.23 | 689 | 673 | 169.7 |
| A | 4 | 159 | 284594 | 1672.61 | 689 | 673 | 169.7 |
| B | 5 | 185 | 1473515 | 10006.37 | 697 | 674 | 147.2 |
| B | 10 | 254 | 220135 | 1491.0 | 697 | 674 | 147.2 |
| B | 0 | 216 | 146334 | 989.6 | 697 | 674 | 147.2 |
| C | 15 | 224 | 7936398 | 52754.3 | 539 | 533 | 150.4 |
| C | 0 | 193 | 898410 | 5968.71 | 539 | 533 | 150.4 |
| C | 4 | 5 | 435397 | 2890.79 | 539 | 533 | 150.4 |
| D | 6 | 42 | 8802106 | 57728.98 | 541 | 517 | 152.5 |
| D | 12 | 17 | 1018409 | 6676.28 | 541 | 517 | 152.5 |
| D | 10 | 181 | 704924 | 4620.15 | 541 | 517 | 152.5 |
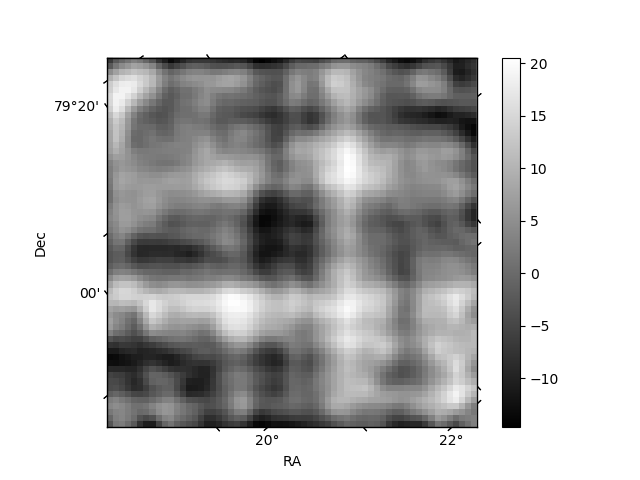
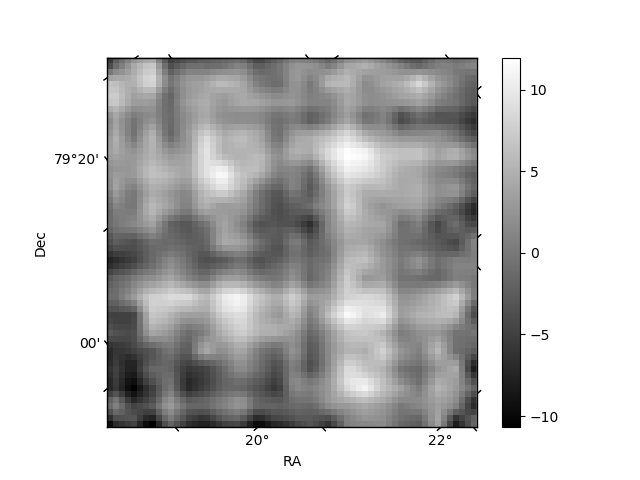
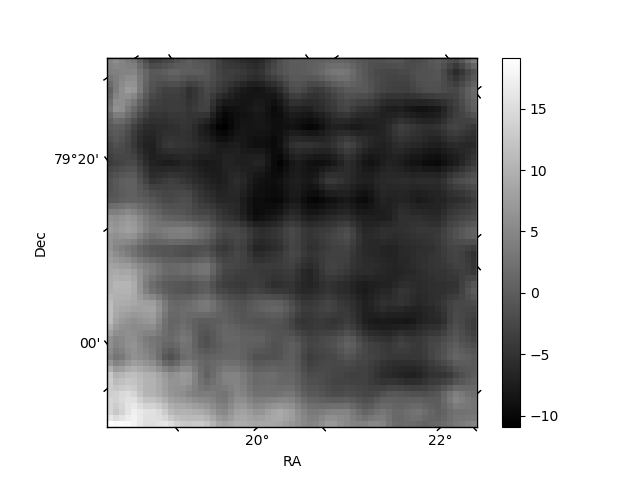
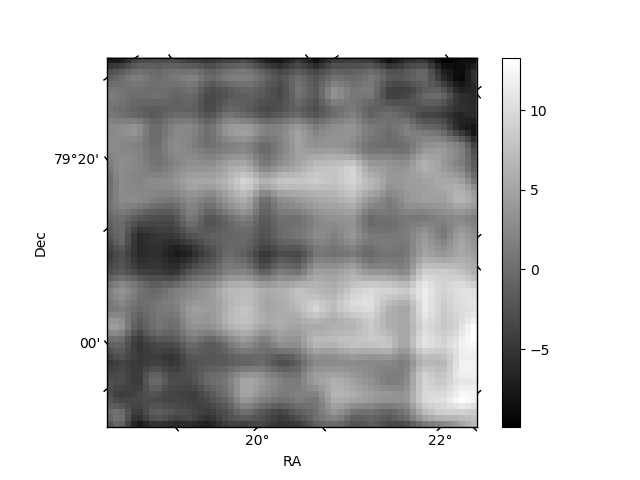
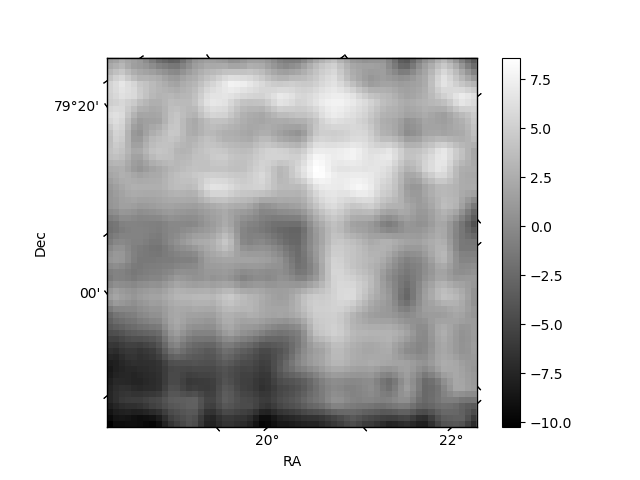
Histogram calculated using DETX and DETY for each event in the final _common_clean file
| Quadrant A | 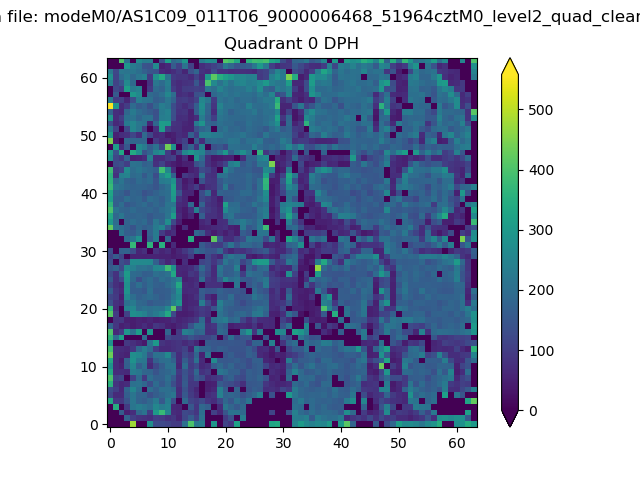 |
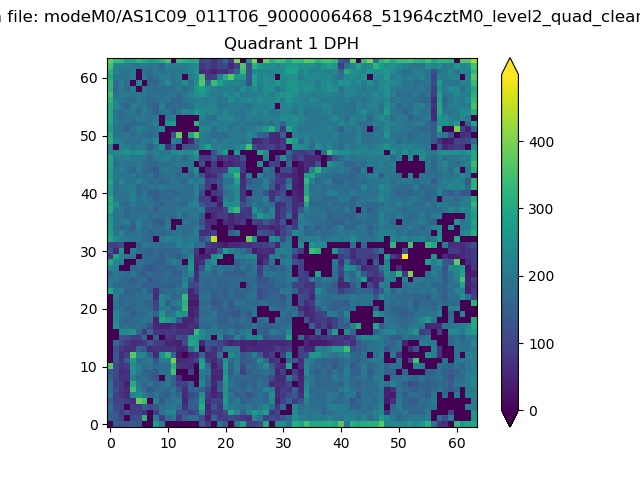 |
Quadrant B |
|---|---|---|---|
| Quadrant D | 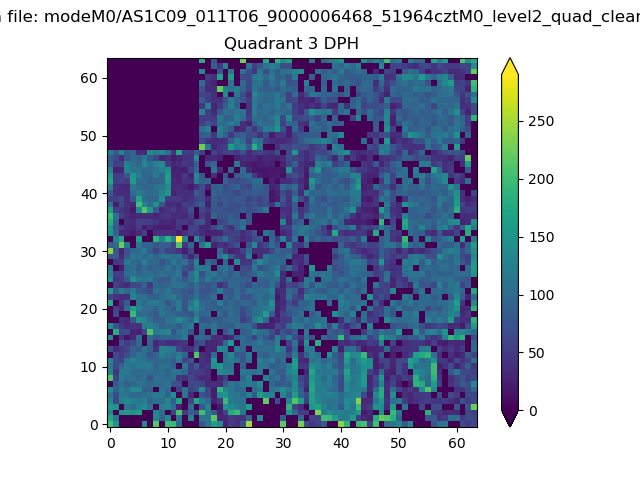 |
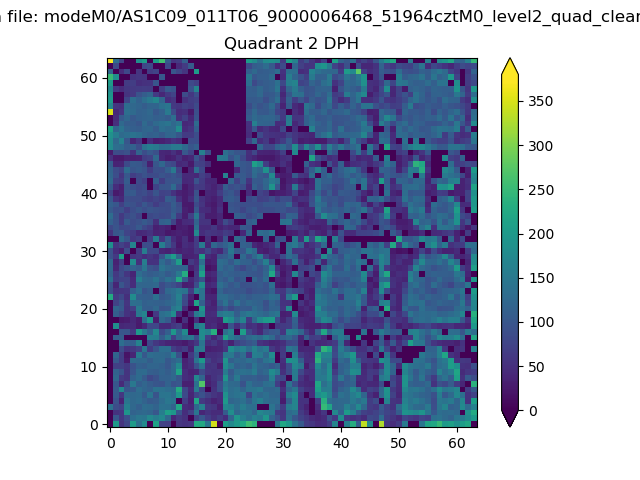 |
Quadrant C |
| Plot type | Count rate plots | Images |
|---|---|---|
| Comparison with Poisson distribution Blue bars denote a histogram of data divided into 1 sec bins. Red curve is a Poisson curve with rate = median count rate of data. |
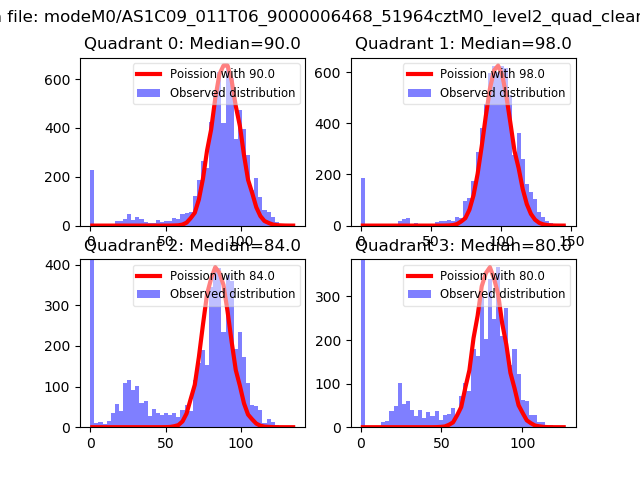 |
 |
| Quadrant-wise count rates Data is divided into 100 sec bins |
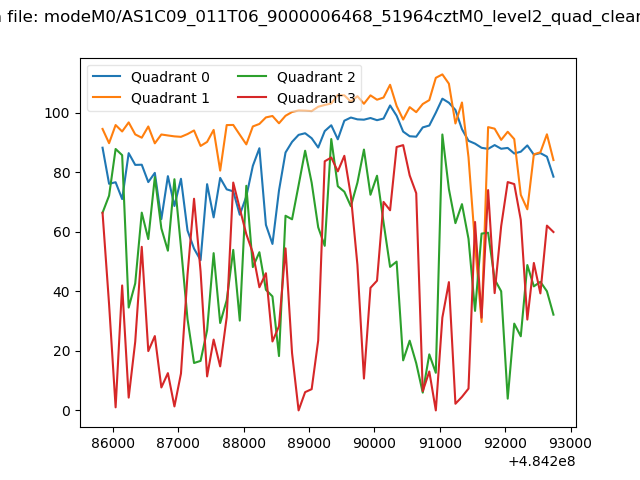 |
|
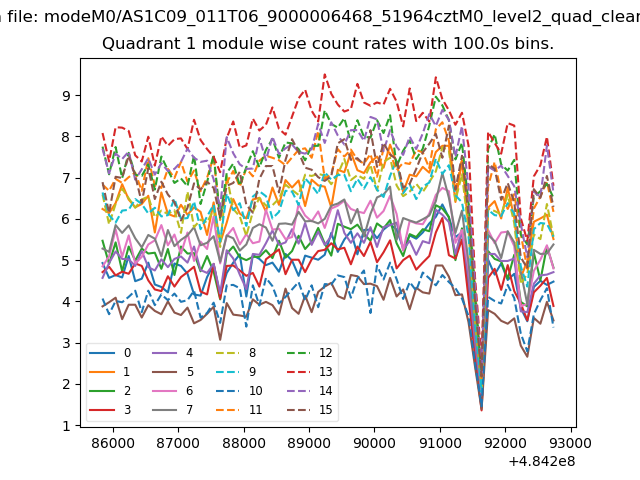
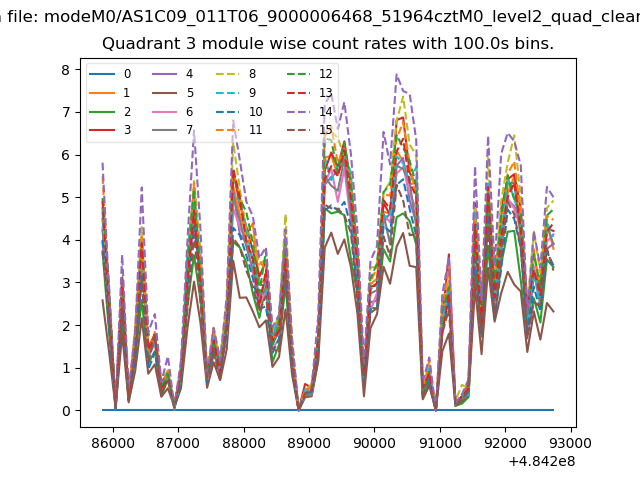
| Module-wise count rates for Quadrant A Data is divided into 100 sec bins |
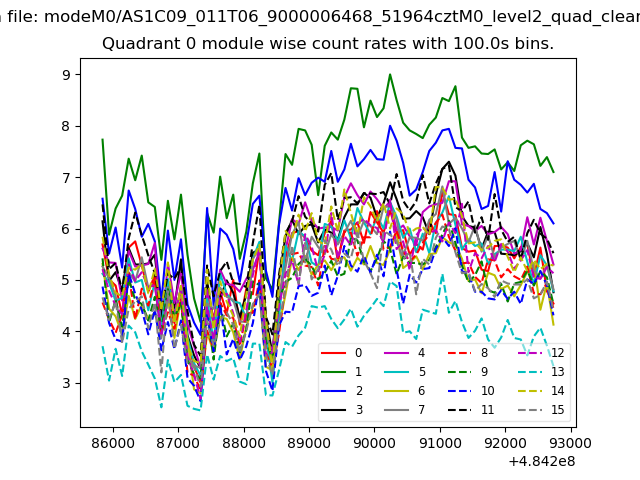 |
 |
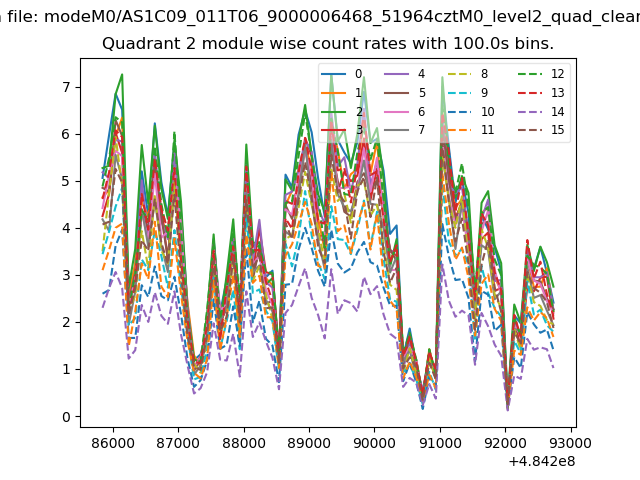
| Module-wise count rates for Quadrant B Data is divided into 100 sec bins |
 |
 |
| Module-wise count rates for Quadrant C Data is divided into 100 sec bins |
 |
 |
| Module-wise count rates for Quadrant D Data is divided into 100 sec bins |
 |
 |
| Parameter | Plot |
|---|---|
| CZT HV Monitor | 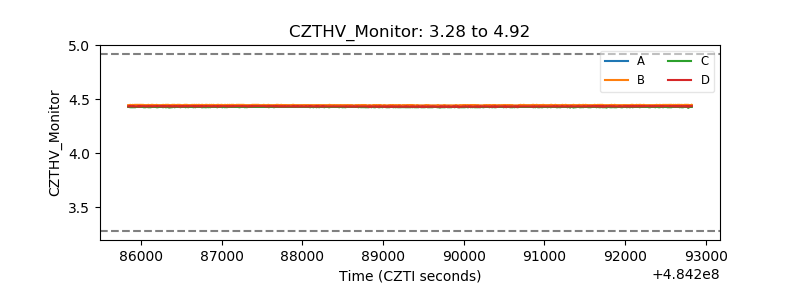 |
| D_VDD | 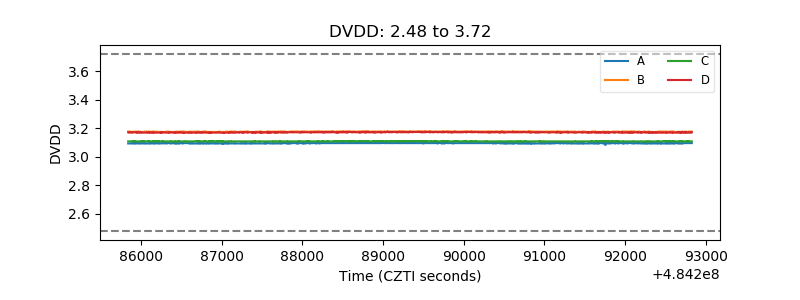 |
| Temperature 1 | 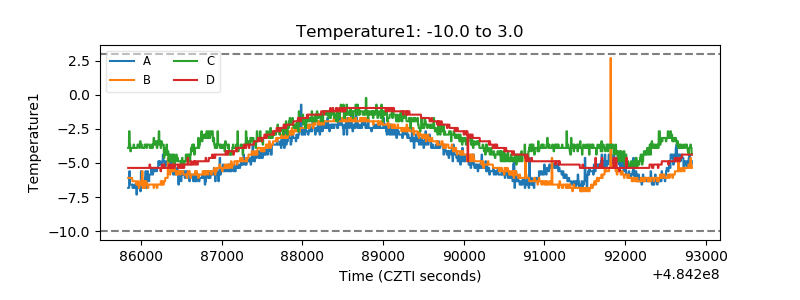 |
| Veto HV Monitor | 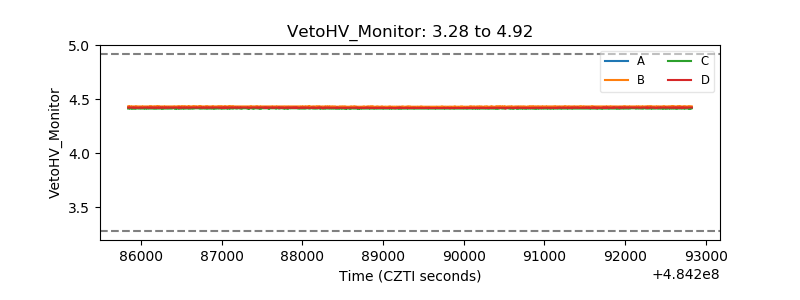 |
| Veto LLD | 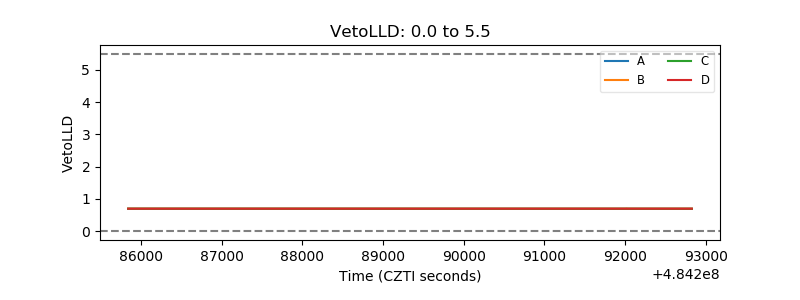 |
| Alpha Counter | 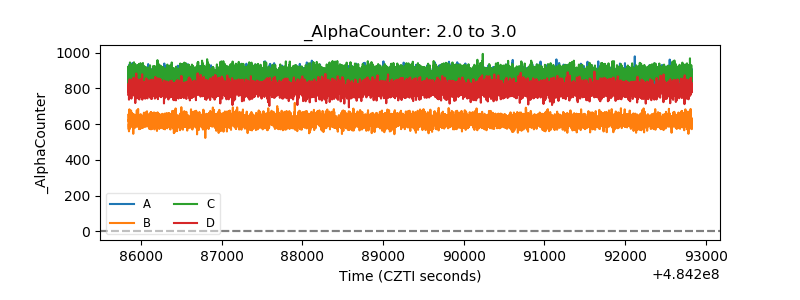 |
| _CPM_Rate | 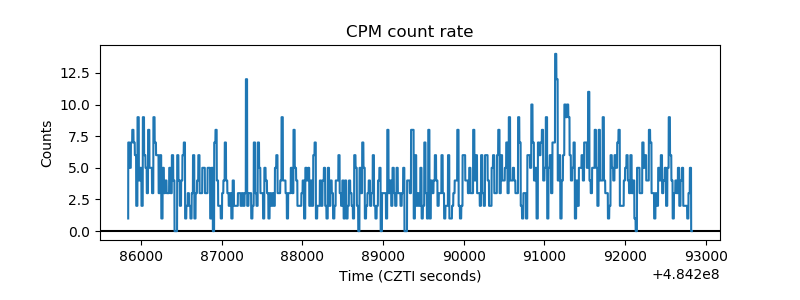 |
| CZT Counter | 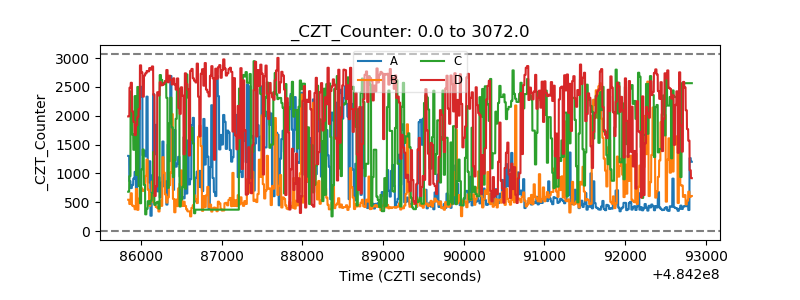 |
| +2.5 Volts monitor | 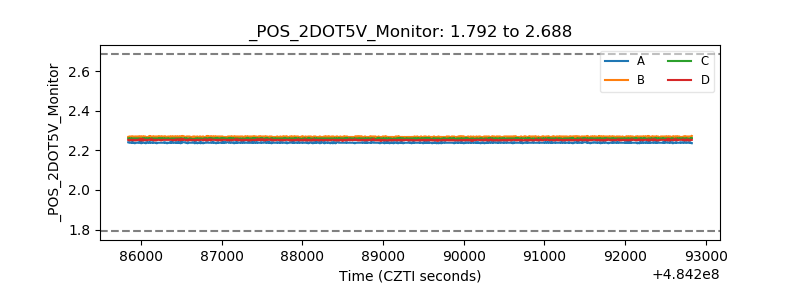 |
| +5 Volts monitor | 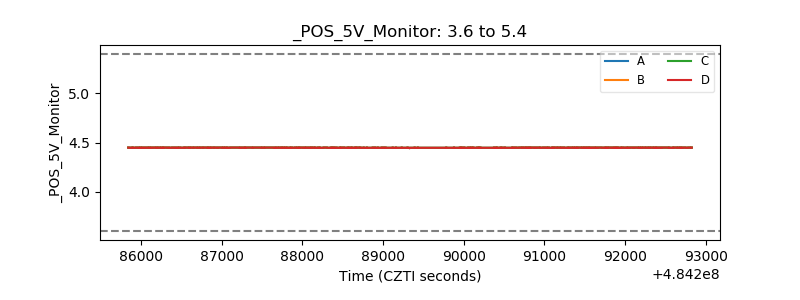 |
| _ROLL_ROT | 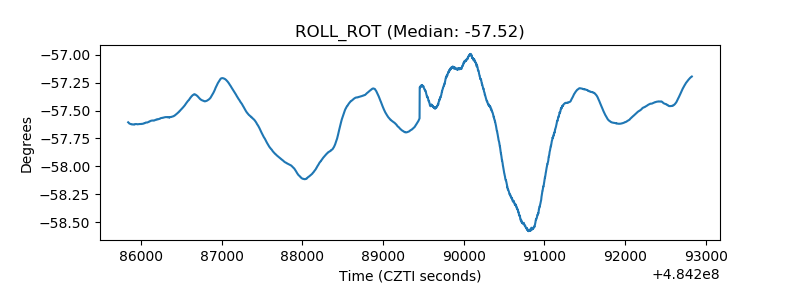 |
| _Roll_DEC | 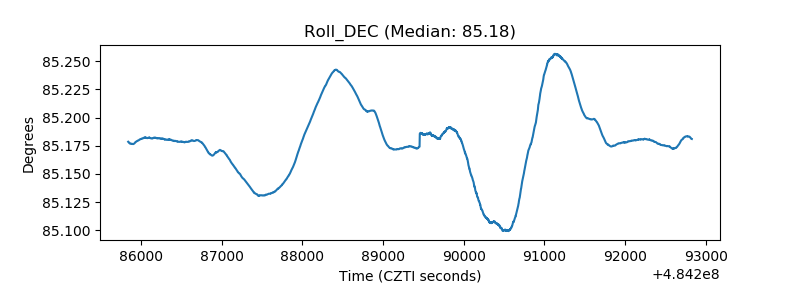 |
| _Roll_RA | 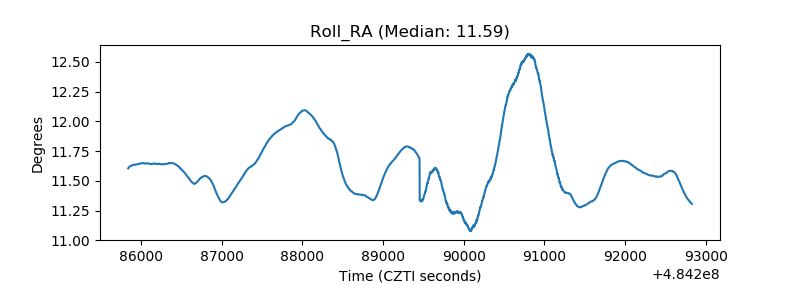 |
| Veto Counter | 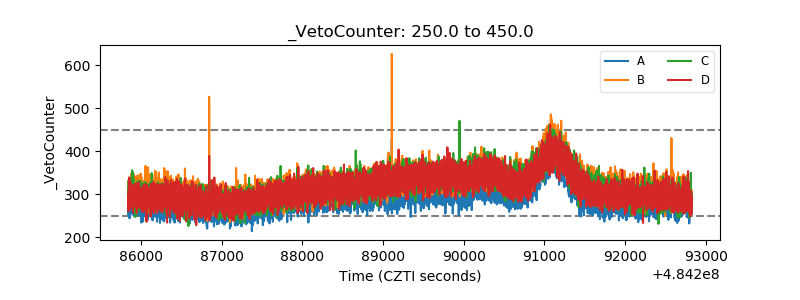 |