| Param | Original file | Final file |
|---|---|---|
| Filename | modeM0/AS1C09_011T06_9000006468_51969cztM0_level2.fits | modeM0/AS1C09_011T06_9000006468_51969cztM0_level2_quad_clean.evt |
| Size (bytes) | 2,097,008,640 | 196,130,880 |
| Size | 2.0 GB | 187.0 MB |
| Events in quadrant A | 13,970,011 | 1,378,688 |
| Events in quadrant B | 11,546,474 | 1,537,072 |
| Events in quadrant C | 23,944,125 | 950,467 |
| Events in quadrant D | 26,898,249 | 935,381 |
| Mode M0 | |||
|---|---|---|---|
| Quadrant | BADHDUFLAG | Total packets | Discarded packets |
| A | 0 | 52555 | 3 |
| B | 0 | 45573 | 3 |
| C | 0 | 82514 | 3 |
| D | 0 | 91429 | 3 |
| Mode M9 | |||
|---|---|---|---|
| Quadrant | BADHDUFLAG | Total packets | Discarded packets |
| A | 0 | 16 | 0 |
| B | 0 | 16 | 0 |
| C | 0 | 16 | 0 |
| D | 0 | 16 | 0 |
| Mode SS | |||
|---|---|---|---|
| Quadrant | BADHDUFLAG | Total packets | Discarded packets |
| A | 0 | 336 | 0 |
| B | 0 | 336 | 0 |
| C | 0 | 336 | 0 |
| D | 0 | 336 | 0 |
| Quadrant | Total seconds | Saturated seconds | Saturation percentage |
|---|---|---|---|
| A | 16452 | 1608 | 9.773888% |
| B | 16452 | 1104 | 6.710430% |
| C | 16452 | 6021 | 36.597374% |
| D | 16452 | 5534 | 33.637248% |
Noise dominated data is calculated using 1-second bins in cleaned event files. If a bin has >2000 counts, and if more than 50% of those come from <1% of pixels, then it is considered to be noise-dominated and hence unusable.
| Quadrant | # 1 sec bins | Bins with >0 counts | Bins with >2000 counts | High rate bins dominated by noise | Noise dominated (total time) | Noise dominated (detector-on time) | Marked lightcurve |
|---|---|---|---|---|---|---|---|
| A | 18067 | 16455 | 1056 | 1056 | 5.84% | 6.42% | 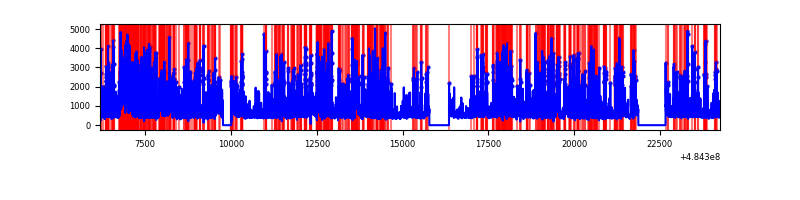 |
| B | 18067 | 16455 | 599 | 599 | 3.32% | 3.64% | 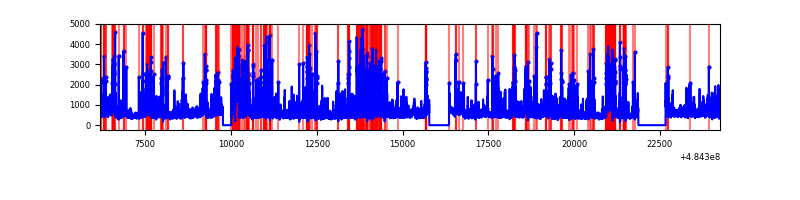 |
| C | 18067 | 16454 | 4545 | 4545 | 25.16% | 27.62% | 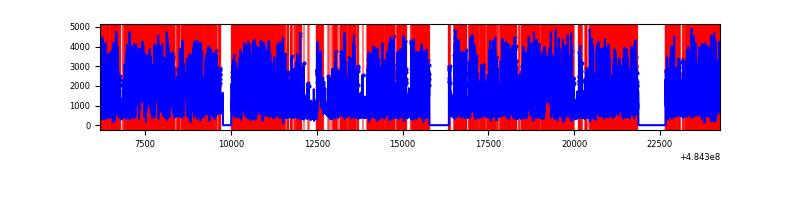 |
| D | 18067 | 16454 | 5284 | 5284 | 29.25% | 32.11% | 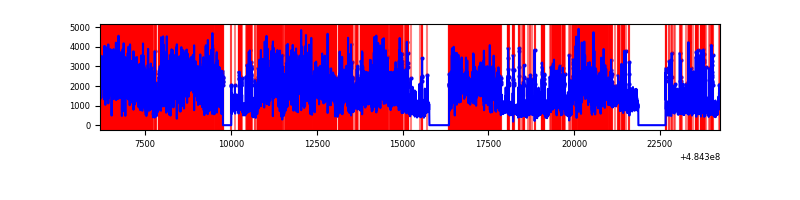 |
Top three noisy pixels from each quadrant. If the there are fewer than three noisy pixels in the level2.evt file, extra rows are filled as -1
| Pixel properties | Quadrant properties | ||||||
|---|---|---|---|---|---|---|---|
| Quadrant | DetID | PixID | Counts | Sigma | Mean | Median | Sigma |
| A | 7 | 64 | 4252861 | 10232.78 | 1687 | 1650 | 415.5 |
| A | 7 | 206 | 604676 | 1451.5 | 1687 | 1650 | 415.5 |
| A | 8 | 62 | 443633 | 1063.87 | 1687 | 1650 | 415.5 |
| B | 12 | 32 | 1055366 | 2934.18 | 1688 | 1624 | 359.1 |
| B | 5 | 185 | 818935 | 2275.83 | 1688 | 1624 | 359.1 |
| B | 5 | 172 | 507378 | 1408.29 | 1688 | 1624 | 359.1 |
| C | 15 | 224 | 13953558 | 35535.48 | 1413 | 1398 | 392.6 |
| C | 13 | 3 | 1253828 | 3189.88 | 1413 | 1398 | 392.6 |
| C | 0 | 193 | 1175771 | 2991.07 | 1413 | 1398 | 392.6 |
| D | 6 | 42 | 11768203 | 28043.3 | 1489 | 1426 | 419.6 |
| D | 3 | 12 | 1641169 | 3907.93 | 1489 | 1426 | 419.6 |
| D | 7 | 126 | 1441346 | 3431.7 | 1489 | 1426 | 419.6 |
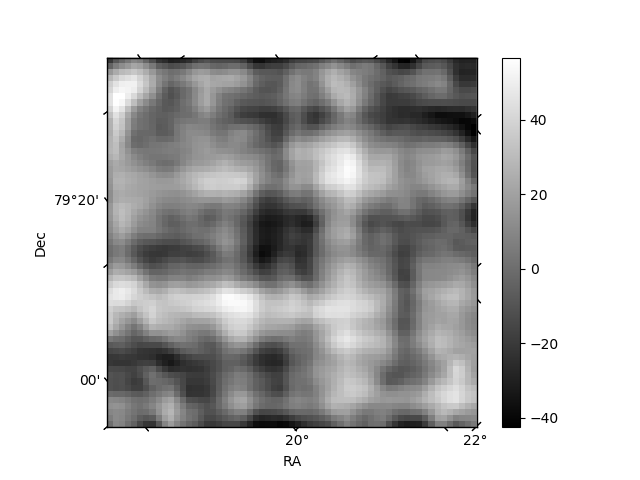
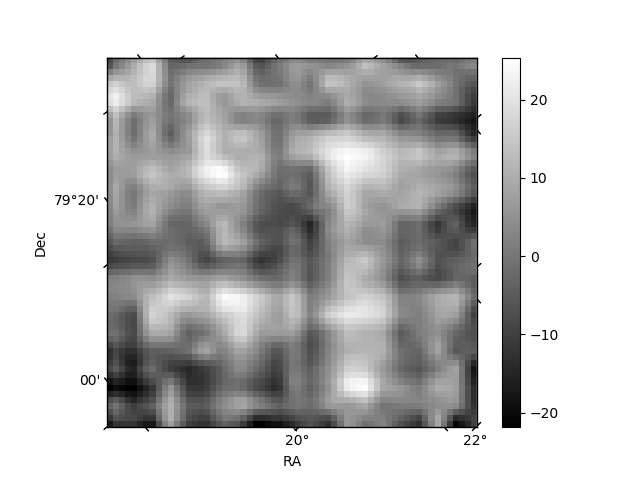
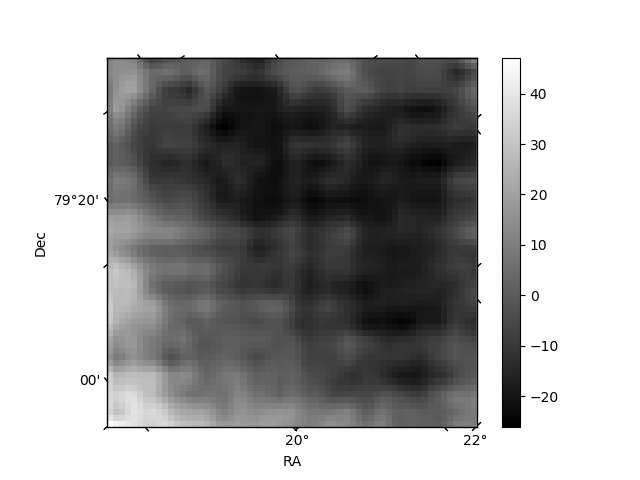
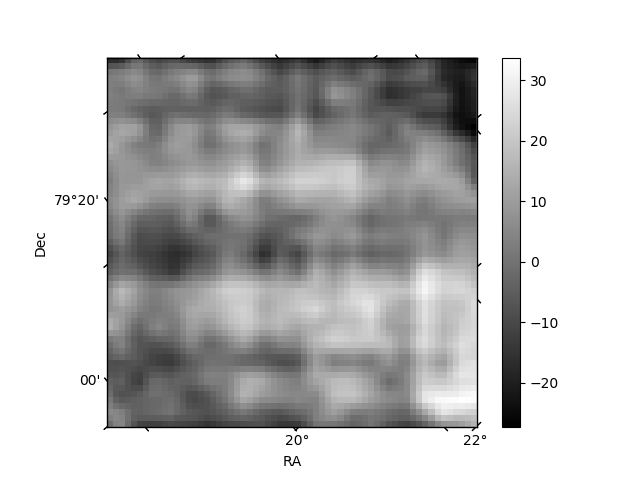
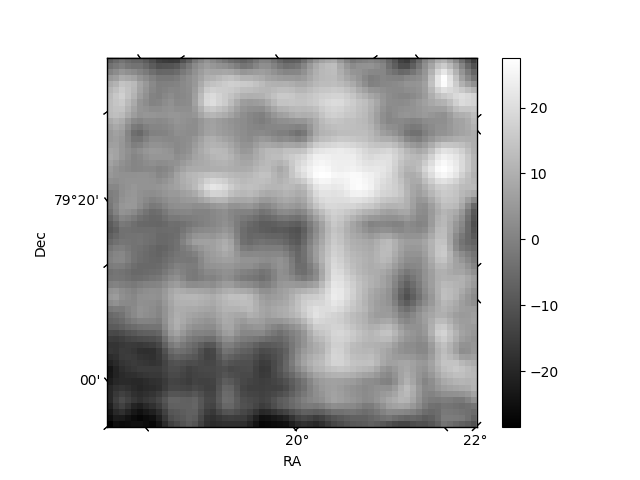
Histogram calculated using DETX and DETY for each event in the final _common_clean file
| Quadrant A | 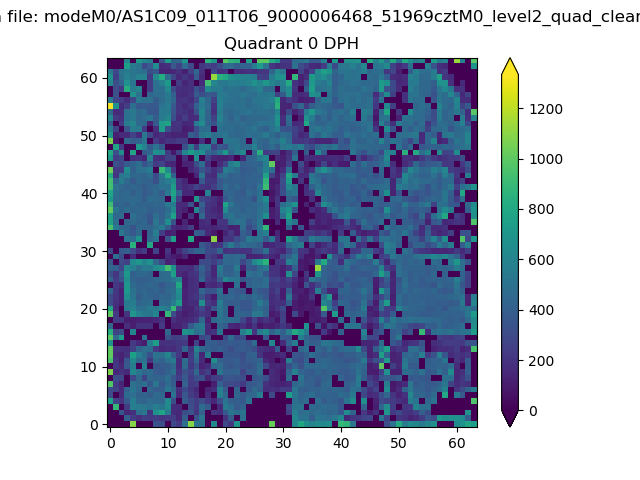 |
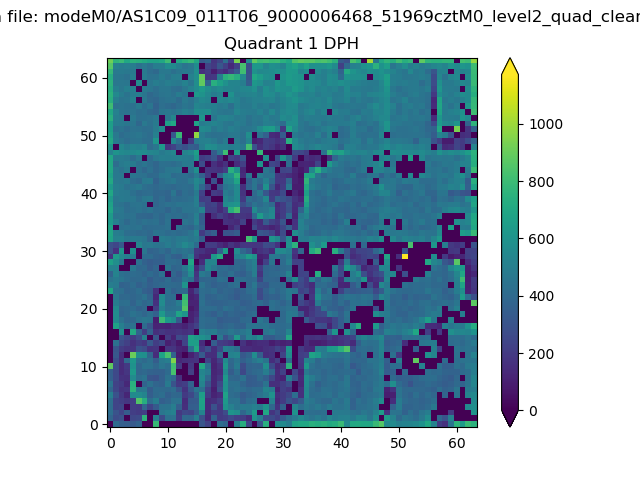 |
Quadrant B |
|---|---|---|---|
| Quadrant D | 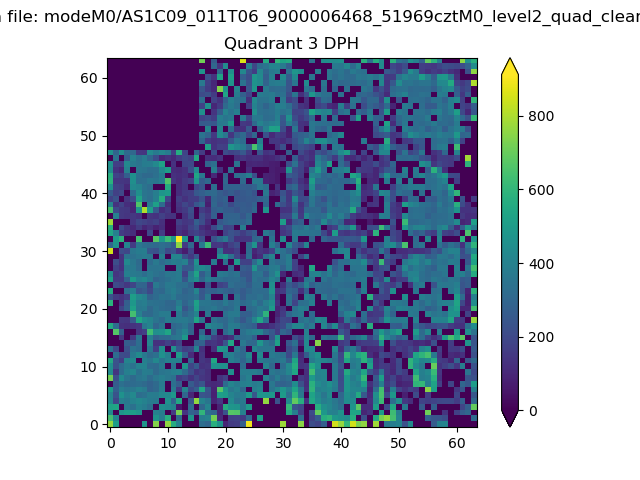 |
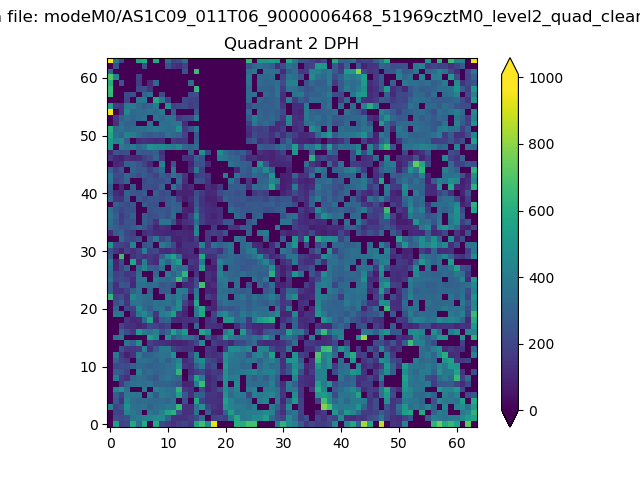 |
Quadrant C |
| Plot type | Count rate plots | Images |
|---|---|---|
| Comparison with Poisson distribution Blue bars denote a histogram of data divided into 1 sec bins. Red curve is a Poisson curve with rate = median count rate of data. |
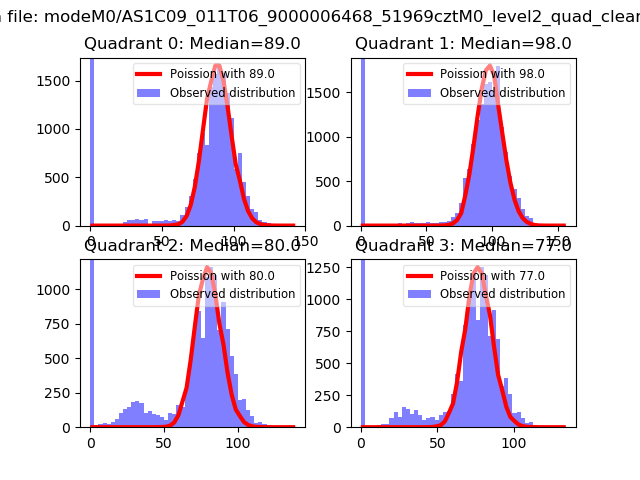 |
 |
| Quadrant-wise count rates Data is divided into 100 sec bins |
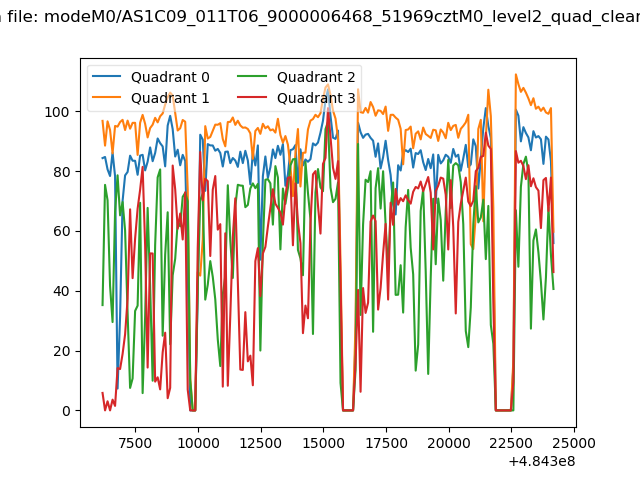 |
|
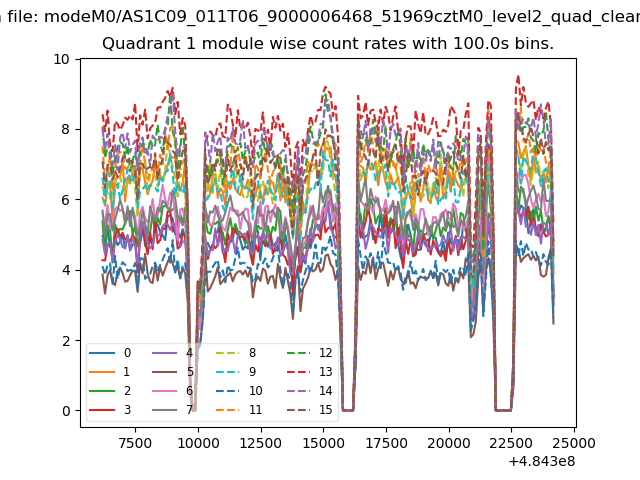
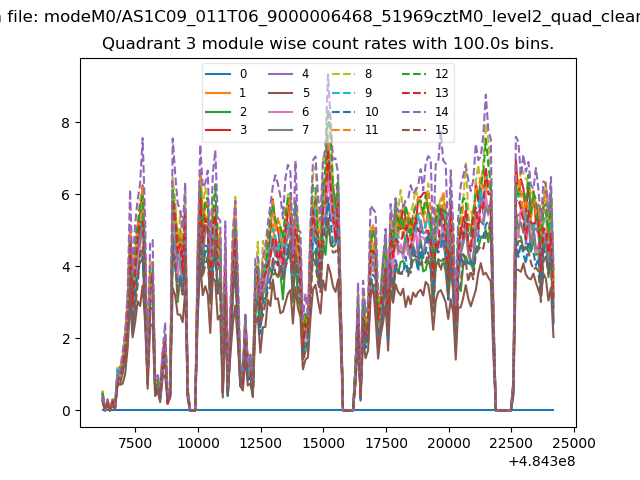
| Module-wise count rates for Quadrant A Data is divided into 100 sec bins |
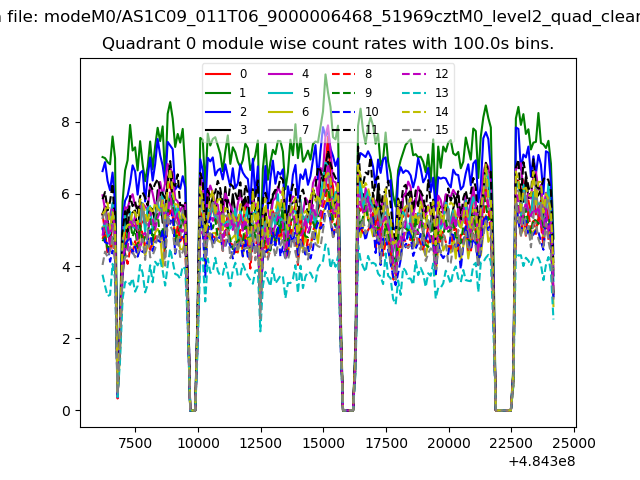 |
 |
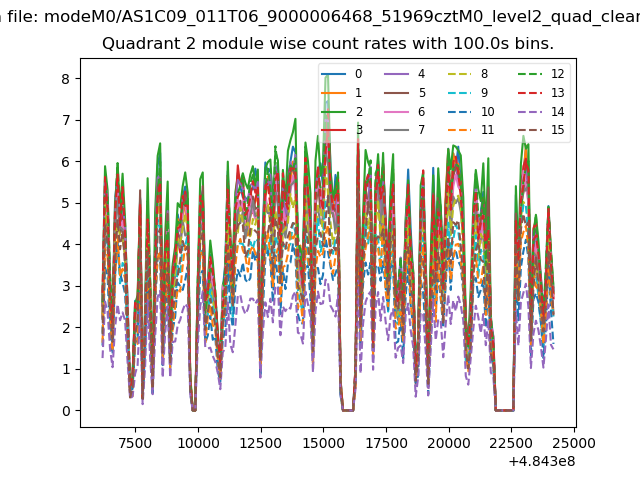
| Module-wise count rates for Quadrant B Data is divided into 100 sec bins |
 |
 |
| Module-wise count rates for Quadrant C Data is divided into 100 sec bins |
 |
 |
| Module-wise count rates for Quadrant D Data is divided into 100 sec bins |
 |
 |
| Parameter | Plot |
|---|---|
| CZT HV Monitor |  |
| D_VDD | 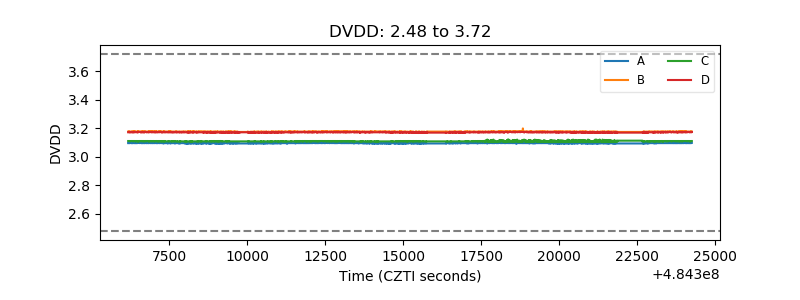 |
| Temperature 1 | 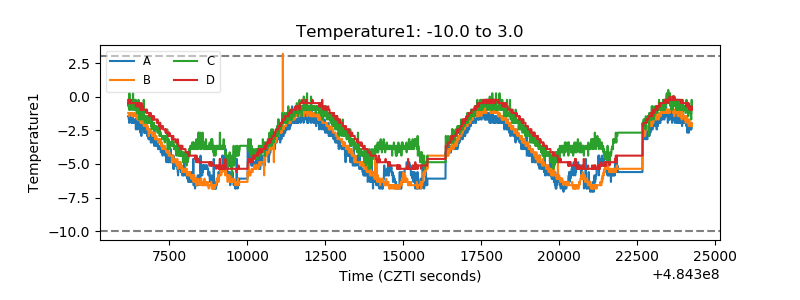 |
| Veto HV Monitor | 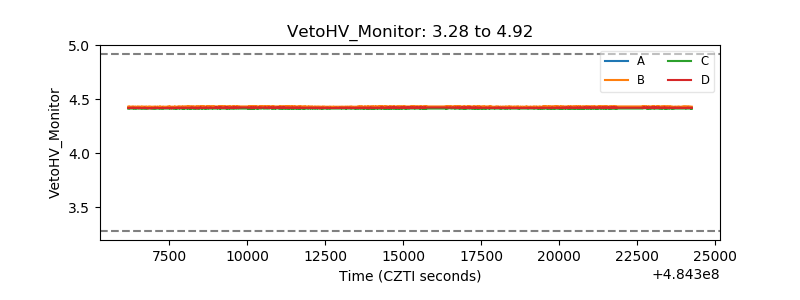 |
| Veto LLD | 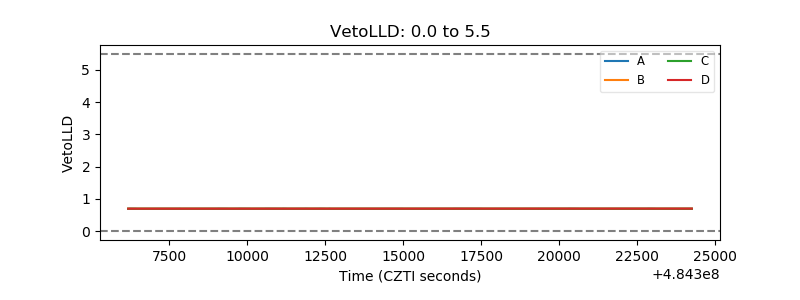 |
| Alpha Counter | 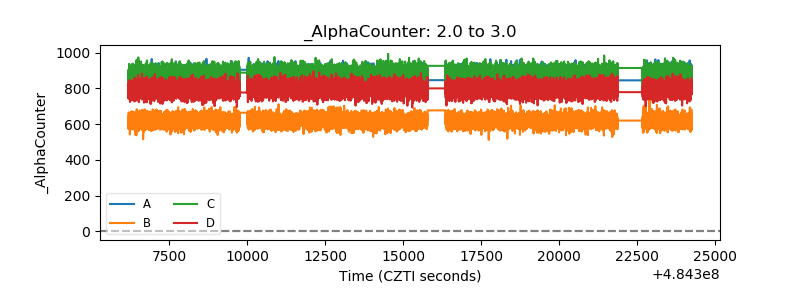 |
| _CPM_Rate | 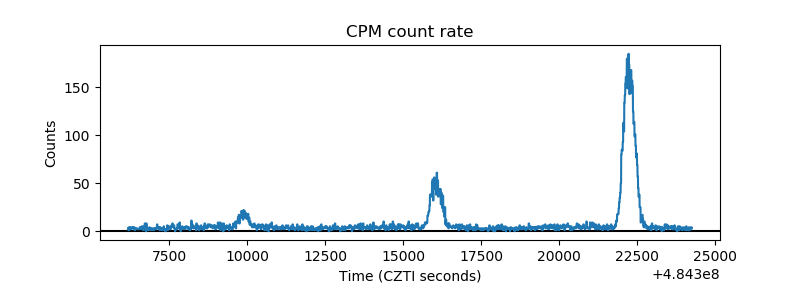 |
| CZT Counter | 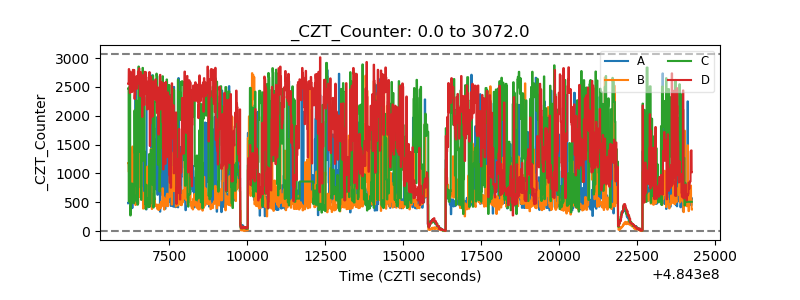 |
| +2.5 Volts monitor | 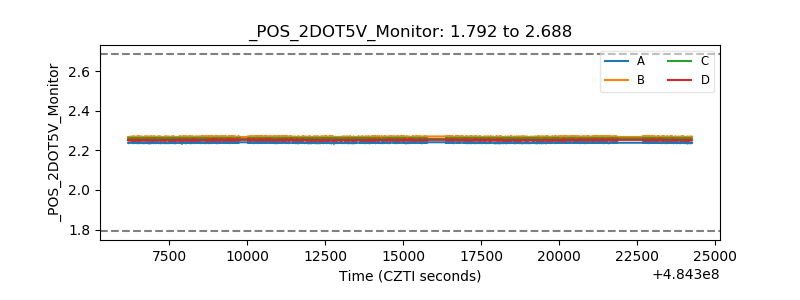 |
| +5 Volts monitor | 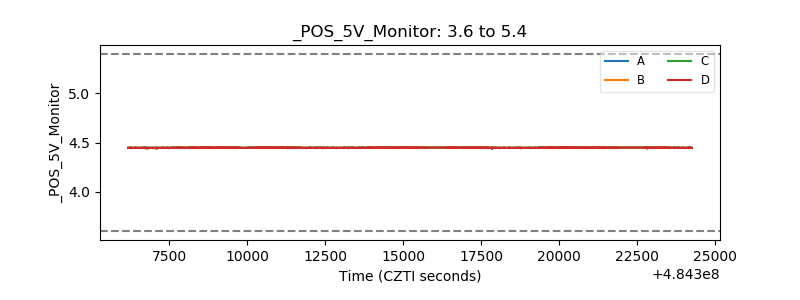 |
| _ROLL_ROT | 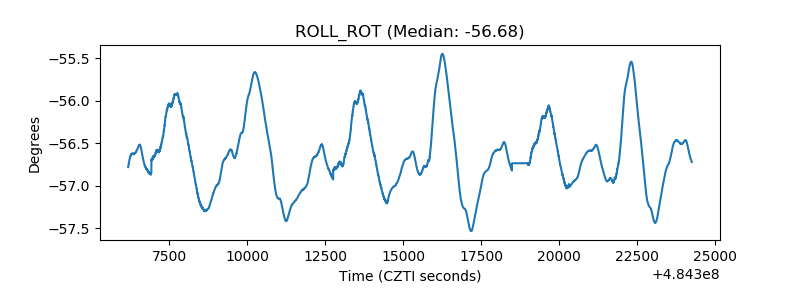 |
| _Roll_DEC | 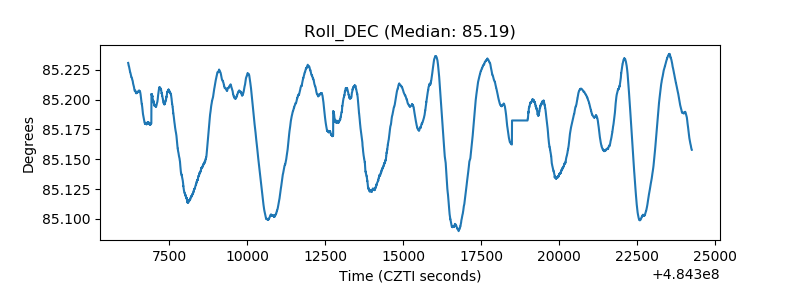 |
| _Roll_RA | 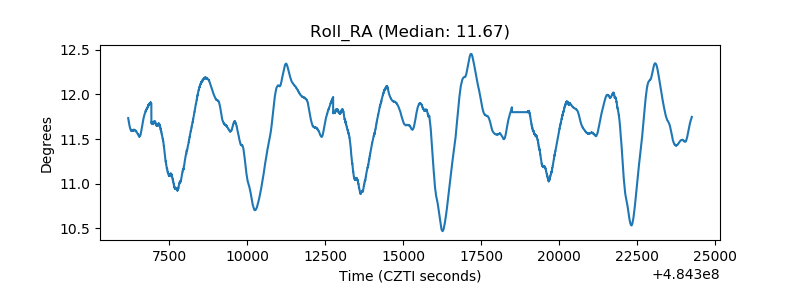 |
| Veto Counter | 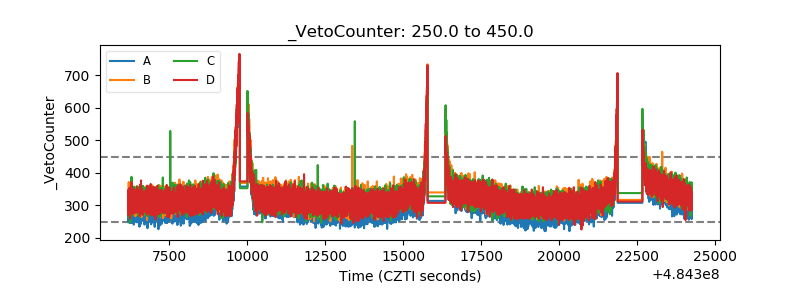 |