| Param | Original file | Final file |
|---|---|---|
| Filename | modeM0/AS1C09_011T06_9000006468_51970cztM0_level2.fits | modeM0/AS1C09_011T06_9000006468_51970cztM0_level2_quad_clean.evt |
| Size (bytes) | 1,434,191,040 | 156,672,000 |
| Size | 1.3 GB | 149.4 MB |
| Events in quadrant A | 9,812,461 | 1,082,239 |
| Events in quadrant B | 8,196,047 | 1,197,511 |
| Events in quadrant C | 17,100,170 | 776,996 |
| Events in quadrant D | 17,027,871 | 831,044 |
| Mode M0 | |||
|---|---|---|---|
| Quadrant | BADHDUFLAG | Total packets | Discarded packets |
| A | 0 | 37450 | 2 |
| B | 0 | 33016 | 2 |
| C | 0 | 59349 | 2 |
| D | 0 | 59282 | 2 |
| Mode M9 | |||
|---|---|---|---|
| Quadrant | BADHDUFLAG | Total packets | Discarded packets |
| A | 0 | 15 | 0 |
| B | 0 | 15 | 0 |
| C | 0 | 15 | 0 |
| D | 0 | 15 | 0 |
| Mode SS | |||
|---|---|---|---|
| Quadrant | BADHDUFLAG | Total packets | Discarded packets |
| A | 0 | 252 | 0 |
| B | 0 | 252 | 0 |
| C | 0 | 252 | 0 |
| D | 0 | 252 | 0 |
| Quadrant | Total seconds | Saturated seconds | Saturation percentage |
|---|---|---|---|
| A | 12358 | 951 | 7.695420% |
| B | 12359 | 633 | 5.121774% |
| C | 12359 | 4167 | 33.716320% |
| D | 12359 | 2825 | 22.857836% |
Noise dominated data is calculated using 1-second bins in cleaned event files. If a bin has >2000 counts, and if more than 50% of those come from <1% of pixels, then it is considered to be noise-dominated and hence unusable.
| Quadrant | # 1 sec bins | Bins with >0 counts | Bins with >2000 counts | High rate bins dominated by noise | Noise dominated (total time) | Noise dominated (detector-on time) | Marked lightcurve |
|---|---|---|---|---|---|---|---|
| A | 19990 | 12361 | 652 | 652 | 3.26% | 5.27% | 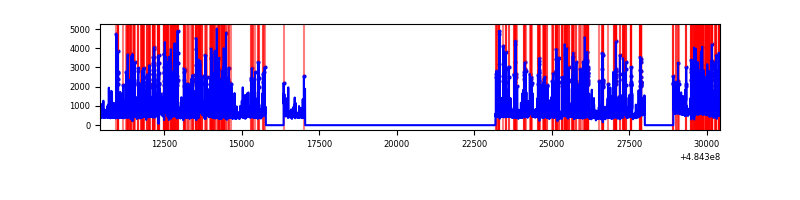 |
| B | 19990 | 12362 | 336 | 336 | 1.68% | 2.72% | 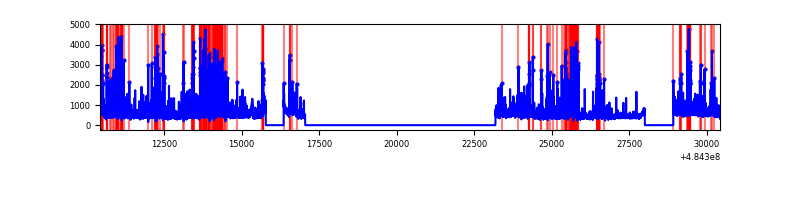 |
| C | 19990 | 12361 | 3095 | 3095 | 15.48% | 25.04% | 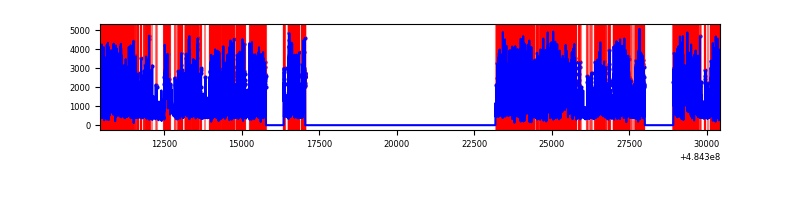 |
| D | 19990 | 12362 | 2742 | 2742 | 13.72% | 22.18% | 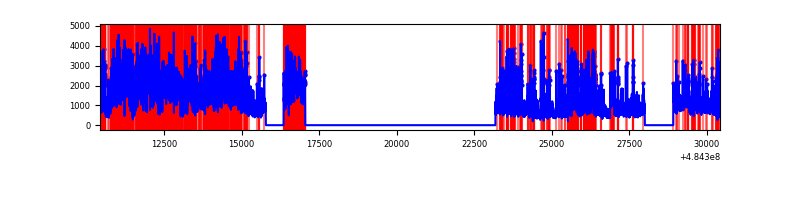 |
Top three noisy pixels from each quadrant. If the there are fewer than three noisy pixels in the level2.evt file, extra rows are filled as -1
| Pixel properties | Quadrant properties | ||||||
|---|---|---|---|---|---|---|---|
| Quadrant | DetID | PixID | Counts | Sigma | Mean | Median | Sigma |
| A | 7 | 64 | 2708723 | 8563.97 | 1273 | 1243 | 316.1 |
| A | 8 | 62 | 469620 | 1481.51 | 1273 | 1243 | 316.1 |
| A | 4 | 3 | 286348 | 901.81 | 1273 | 1243 | 316.1 |
| B | 12 | 32 | 736941 | 2731.61 | 1273 | 1230 | 269.3 |
| B | 5 | 185 | 383143 | 1418.0 | 1273 | 1230 | 269.3 |
| B | 7 | 252 | 287297 | 1062.13 | 1273 | 1230 | 269.3 |
| C | 15 | 224 | 10326277 | 35334.3 | 1057 | 1046 | 292.2 |
| C | 0 | 193 | 1022038 | 3493.97 | 1057 | 1046 | 292.2 |
| C | 15 | 147 | 707401 | 2417.24 | 1057 | 1046 | 292.2 |
| D | 6 | 42 | 6284209 | 19210.37 | 1163 | 1113 | 327.1 |
| D | 3 | 12 | 1255021 | 3833.79 | 1163 | 1113 | 327.1 |
| D | 10 | 199 | 1184378 | 3617.8 | 1163 | 1113 | 327.1 |
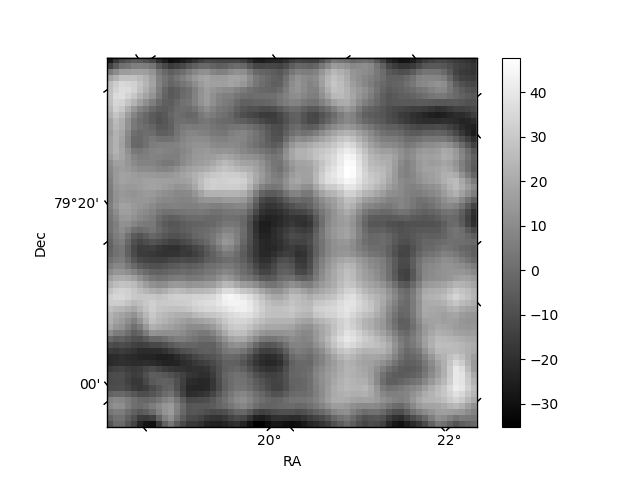
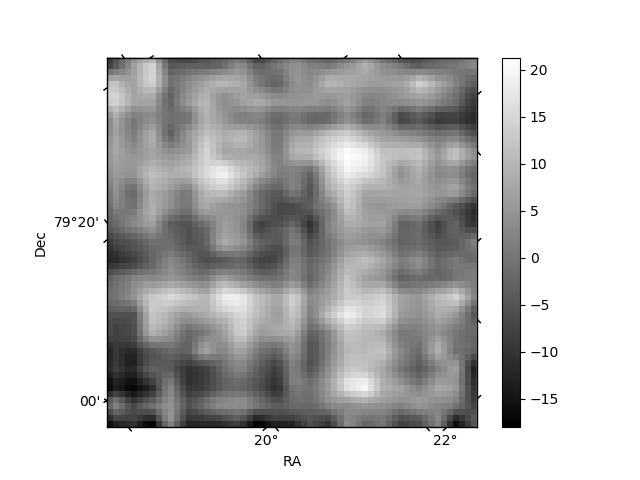
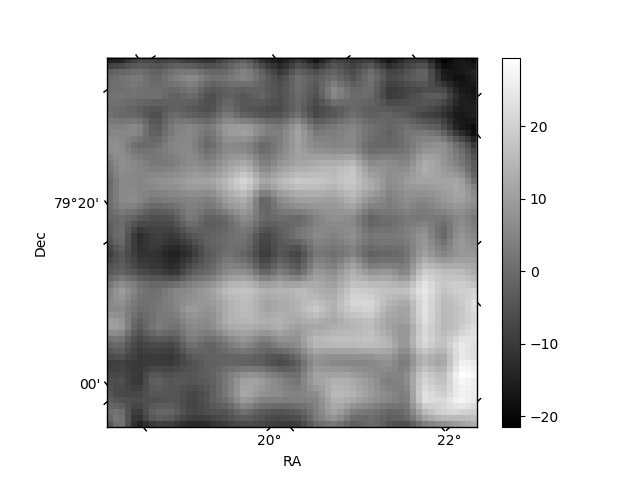
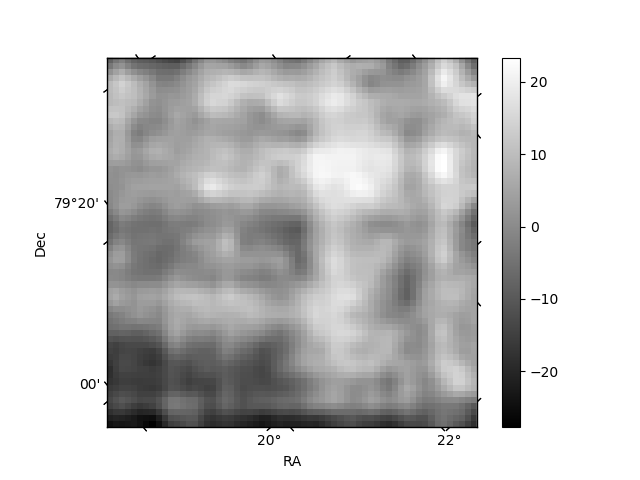
Histogram calculated using DETX and DETY for each event in the final _common_clean file
| Quadrant A | 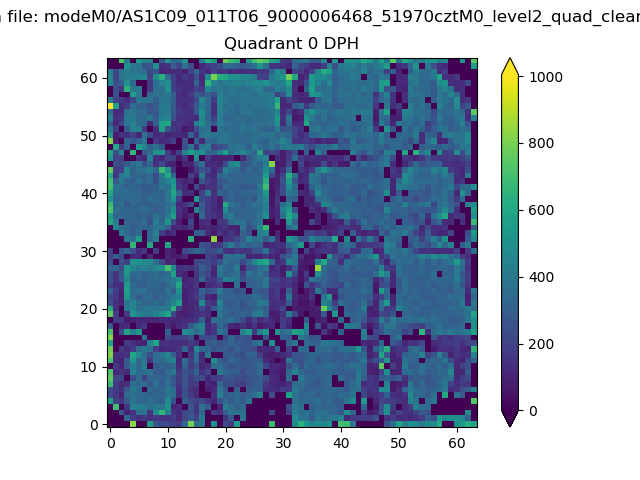 |
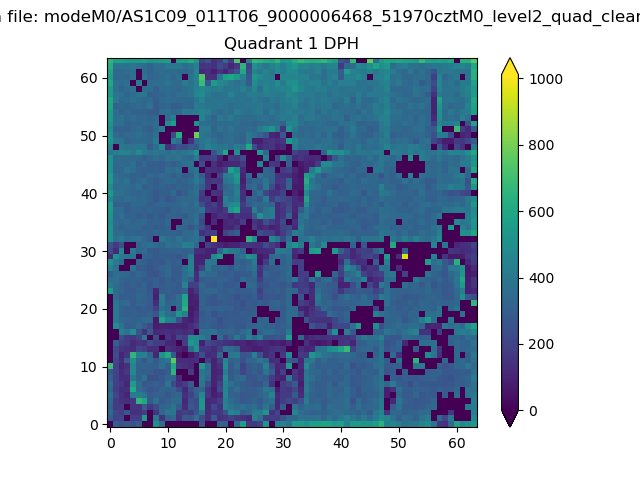 |
Quadrant B |
|---|---|---|---|
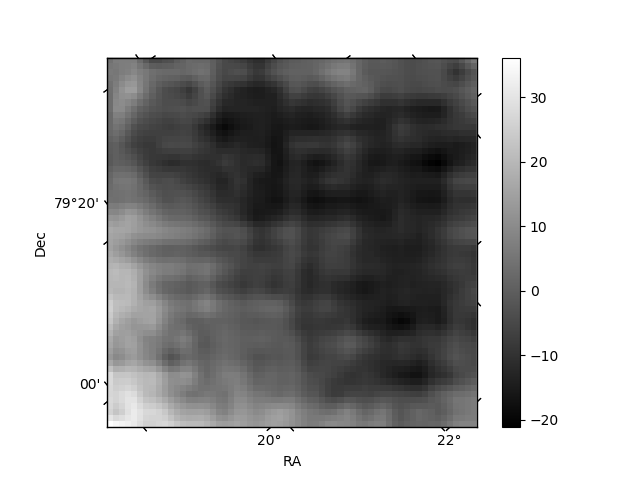
| Quadrant D | 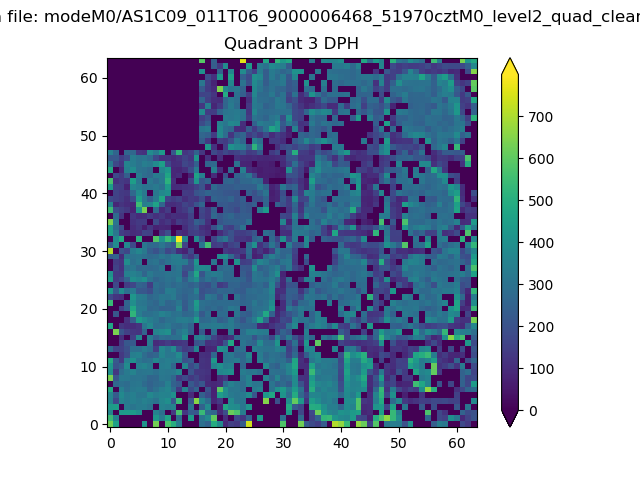 |
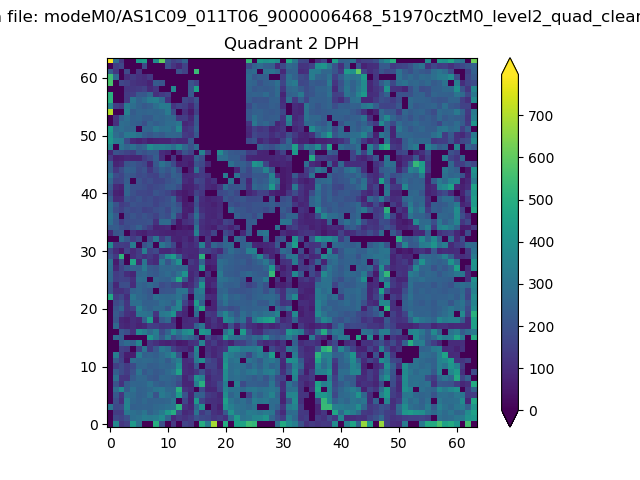 |
Quadrant C |
| Plot type | Count rate plots | Images |
|---|---|---|
| Comparison with Poisson distribution Blue bars denote a histogram of data divided into 1 sec bins. Red curve is a Poisson curve with rate = median count rate of data. |
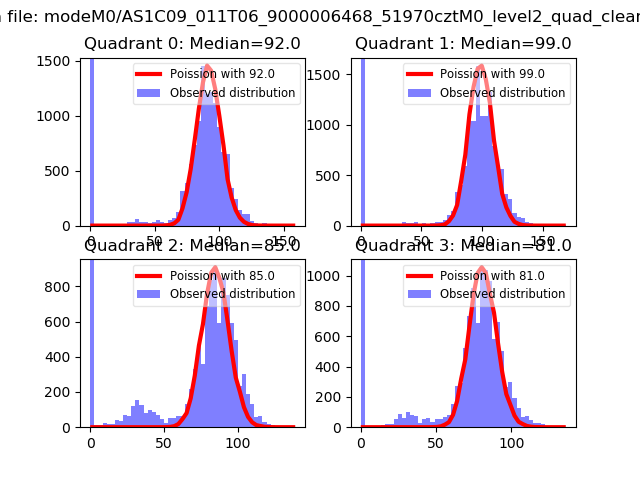 |
 |
| Quadrant-wise count rates Data is divided into 100 sec bins |
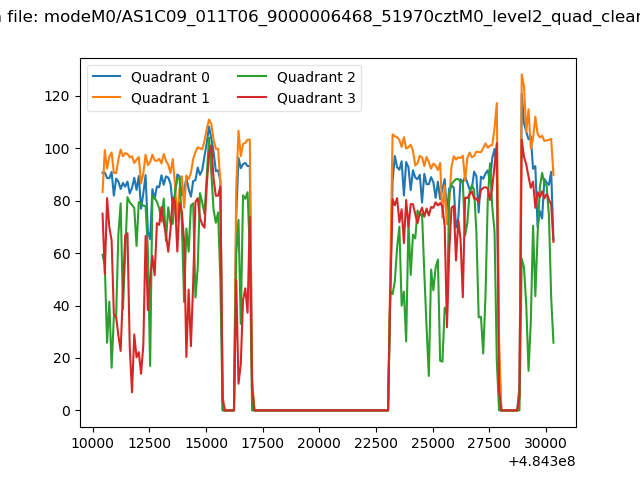 |
|
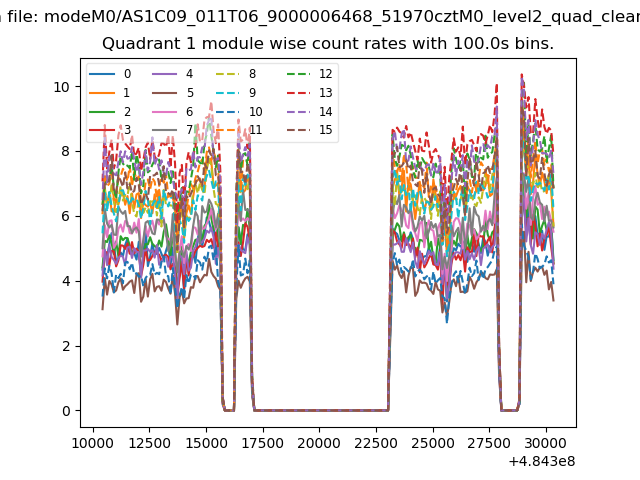
| Module-wise count rates for Quadrant A Data is divided into 100 sec bins |
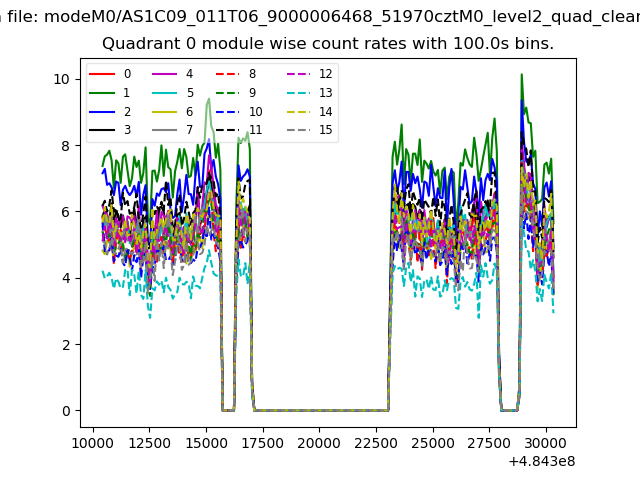 |
 |
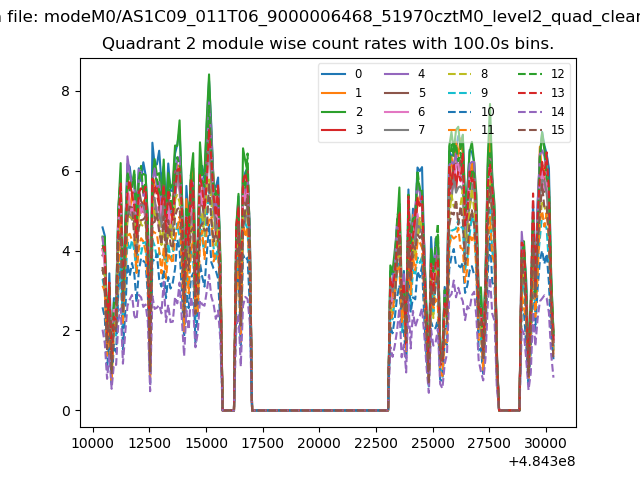
| Module-wise count rates for Quadrant B Data is divided into 100 sec bins |
 |
 |
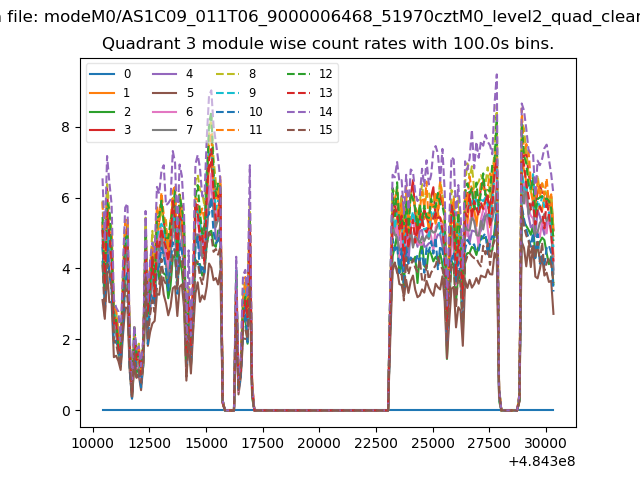
| Module-wise count rates for Quadrant C Data is divided into 100 sec bins |
 |
 |
| Module-wise count rates for Quadrant D Data is divided into 100 sec bins |
 |
 |
| Parameter | Plot |
|---|---|
| CZT HV Monitor | 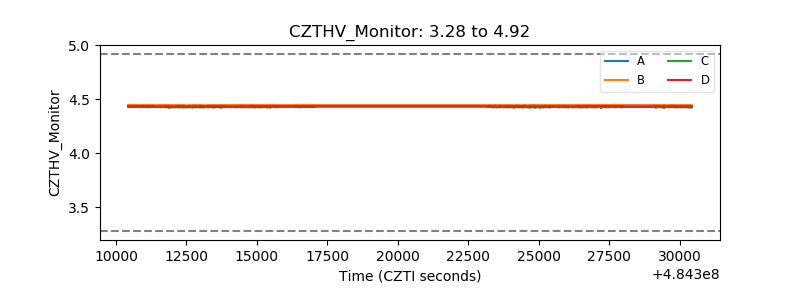 |
| D_VDD | 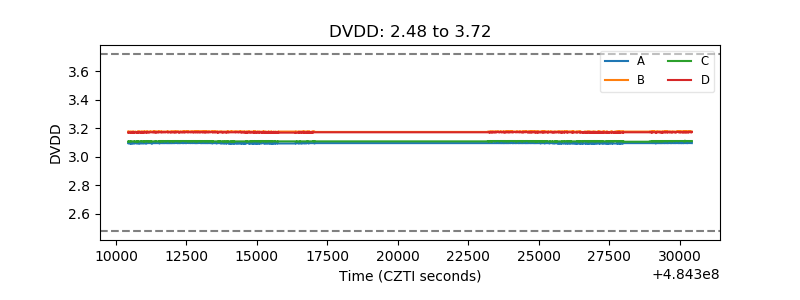 |
| Temperature 1 | 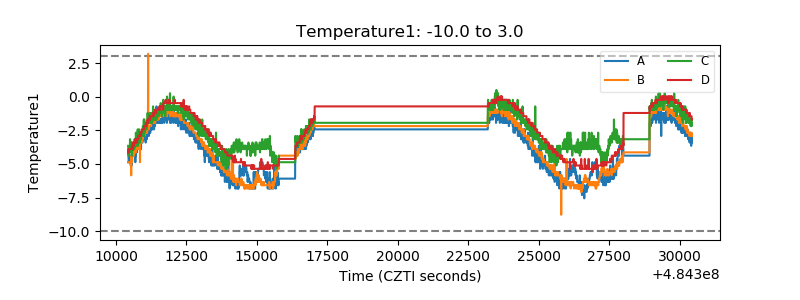 |
| Veto HV Monitor | 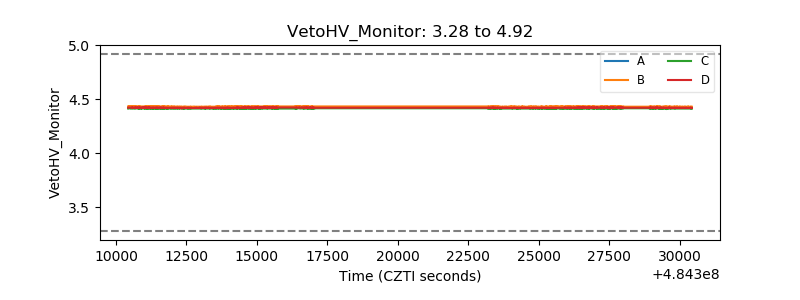 |
| Veto LLD | 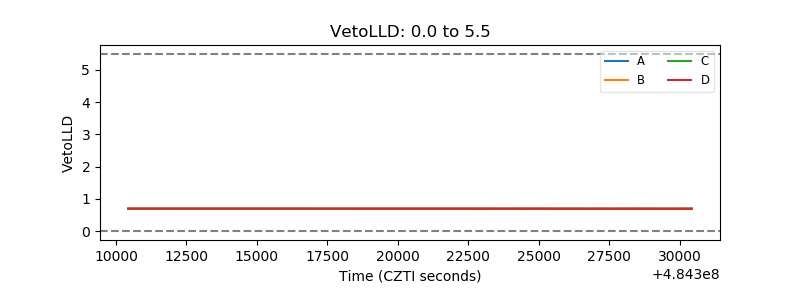 |
| Alpha Counter | 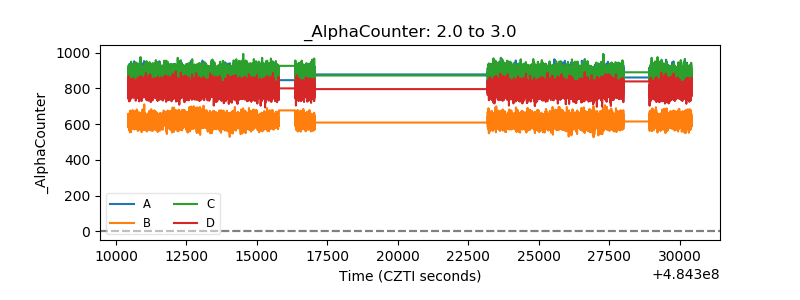 |
| _CPM_Rate | 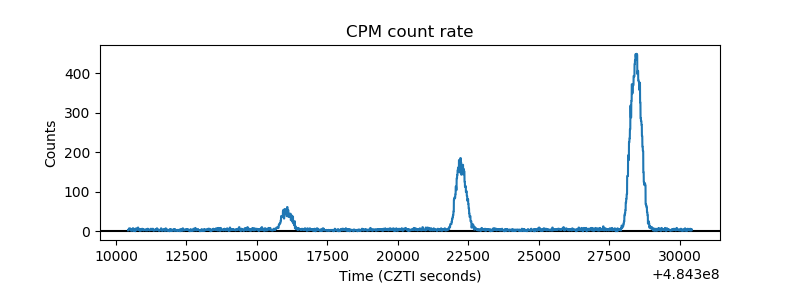 |
| CZT Counter | 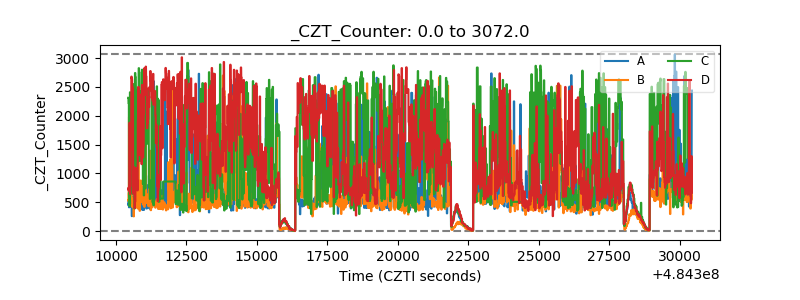 |
| +2.5 Volts monitor | 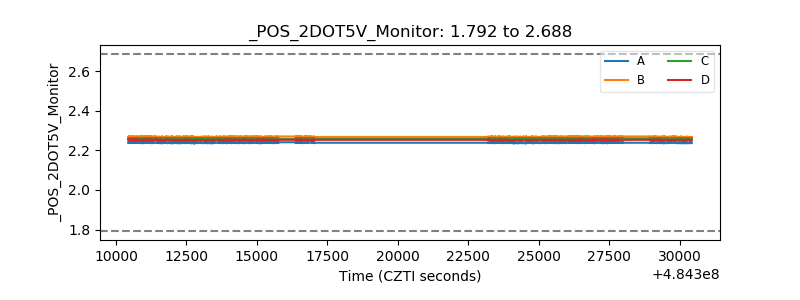 |
| +5 Volts monitor | 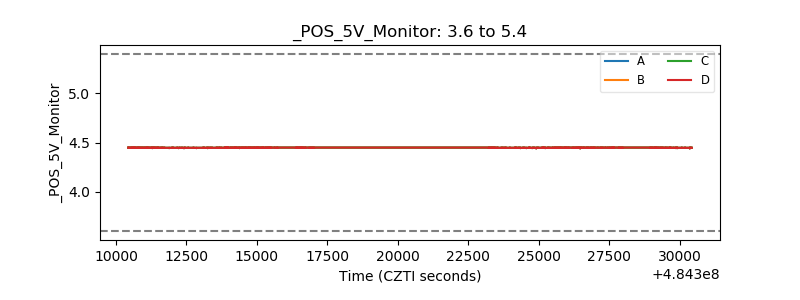 |
| _ROLL_ROT | 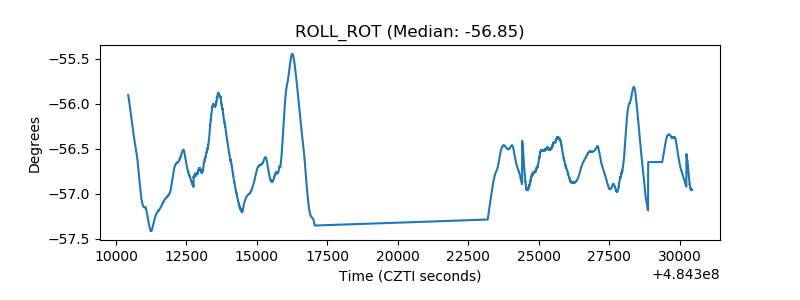 |
| _Roll_DEC | 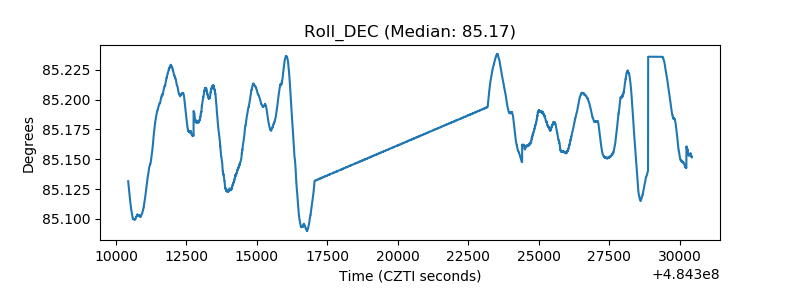 |
| _Roll_RA | 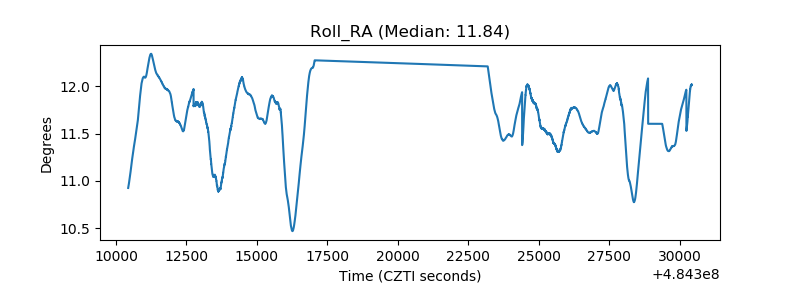 |
| Veto Counter | 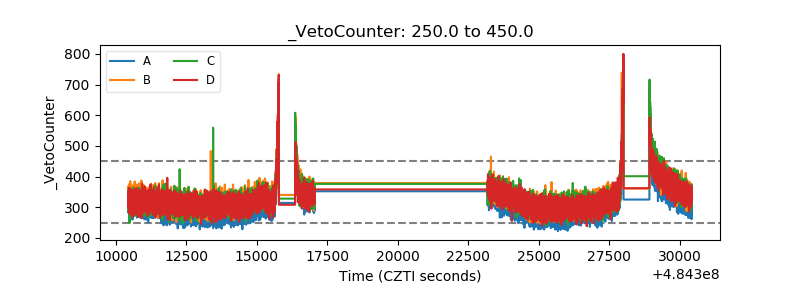 |