| Param | Original file | Final file |
|---|---|---|
| Filename | modeM0/AS1C09_011T06_9000006468_51972cztM0_level2.fits | modeM0/AS1C09_011T06_9000006468_51972cztM0_level2_quad_clean.evt |
| Size (bytes) | 663,808,320 | 77,800,320 |
| Size | 633.1 MB | 74.2 MB |
| Events in quadrant A | 5,693,173 | 511,966 |
| Events in quadrant B | 4,344,118 | 574,007 |
| Events in quadrant C | 8,250,317 | 367,663 |
| Events in quadrant D | 5,826,419 | 488,513 |
| Mode M0 | |||
|---|---|---|---|
| Quadrant | BADHDUFLAG | Total packets | Discarded packets |
| A | 0 | 21078 | 1 |
| B | 0 | 17164 | 3 |
| C | 0 | 28650 | 1 |
| D | 0 | 21452 | 1 |
| Mode M9 | |||
|---|---|---|---|
| Quadrant | BADHDUFLAG | Total packets | Discarded packets |
| A | 0 | 11 | 0 |
| B | 0 | 11 | 0 |
| C | 0 | 11 | 0 |
| D | 0 | 11 | 0 |
| Mode SS | |||
|---|---|---|---|
| Quadrant | BADHDUFLAG | Total packets | Discarded packets |
| A | 0 | 120 | 0 |
| B | 0 | 120 | 0 |
| C | 0 | 120 | 0 |
| D | 0 | 120 | 0 |
| Quadrant | Total seconds | Saturated seconds | Saturation percentage |
|---|---|---|---|
| A | 5914 | 752 | 12.715590% |
| B | 5913 | 491 | 8.303738% |
| C | 5914 | 2206 | 37.301319% |
| D | 5914 | 419 | 7.084883% |
Noise dominated data is calculated using 1-second bins in cleaned event files. If a bin has >2000 counts, and if more than 50% of those come from <1% of pixels, then it is considered to be noise-dominated and hence unusable.
| Quadrant | # 1 sec bins | Bins with >0 counts | Bins with >2000 counts | High rate bins dominated by noise | Noise dominated (total time) | Noise dominated (detector-on time) | Marked lightcurve |
|---|---|---|---|---|---|---|---|
| A | 7009 | 5915 | 555 | 555 | 7.92% | 9.38% | 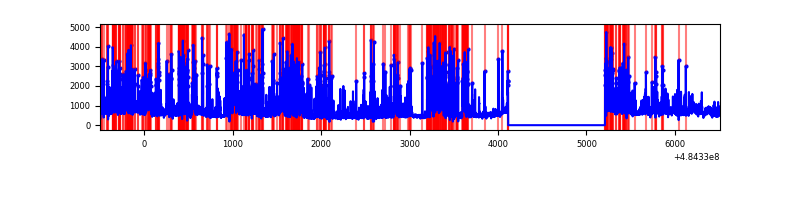 |
| B | 7008 | 5914 | 176 | 176 | 2.51% | 2.98% | 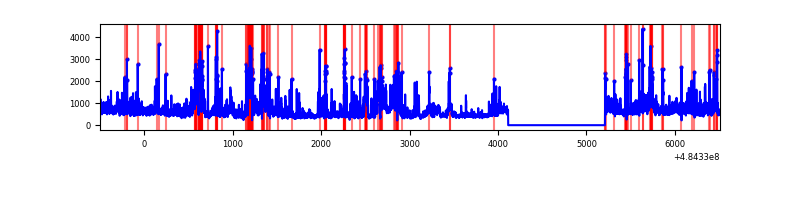 |
| C | 7009 | 5915 | 1645 | 1645 | 23.47% | 27.81% | 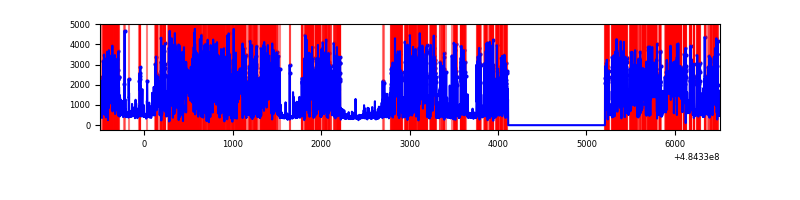 |
| D | 7009 | 5915 | 394 | 394 | 5.62% | 6.66% | 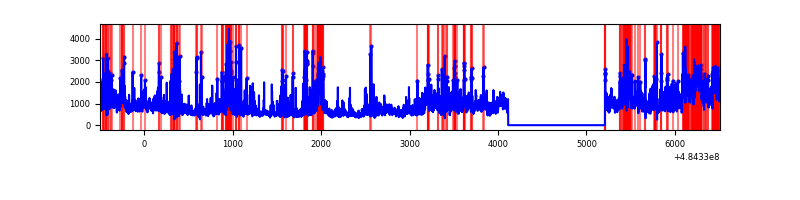 |
Top three noisy pixels from each quadrant. If the there are fewer than three noisy pixels in the level2.evt file, extra rows are filled as -1
| Pixel properties | Quadrant properties | ||||||
|---|---|---|---|---|---|---|---|
| Quadrant | DetID | PixID | Counts | Sigma | Mean | Median | Sigma |
| A | 7 | 64 | 2148910 | 14414.37 | 591 | 575 | 149.0 |
| A | 4 | 3 | 187902 | 1256.88 | 591 | 575 | 149.0 |
| A | 4 | 249 | 179907 | 1203.24 | 591 | 575 | 149.0 |
| B | 4 | 249 | 368130 | 2955.67 | 592 | 573 | 124.4 |
| B | 4 | 206 | 327614 | 2629.86 | 592 | 573 | 124.4 |
| B | 4 | 81 | 184903 | 1482.27 | 592 | 573 | 124.4 |
| C | 15 | 224 | 5124395 | 37008.34 | 495 | 490 | 138.5 |
| C | 15 | 147 | 717132 | 5176.08 | 495 | 490 | 138.5 |
| C | 13 | 3 | 201433 | 1451.35 | 495 | 490 | 138.5 |
| D | 6 | 42 | 1175690 | 6934.62 | 595 | 568 | 169.5 |
| D | 10 | 199 | 764501 | 4508.11 | 595 | 568 | 169.5 |
| D | 7 | 126 | 271580 | 1599.29 | 595 | 568 | 169.5 |
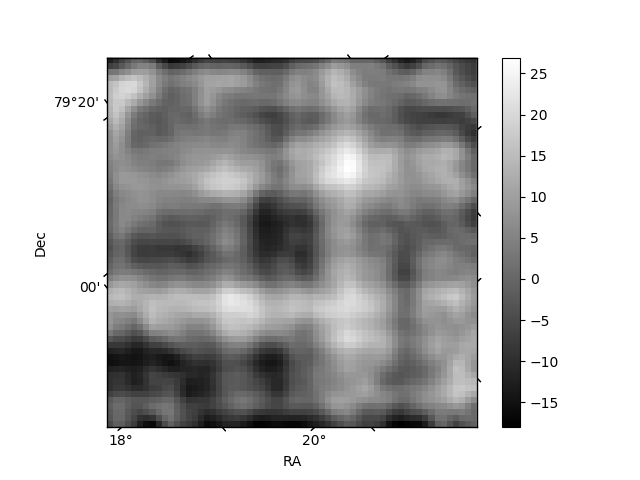
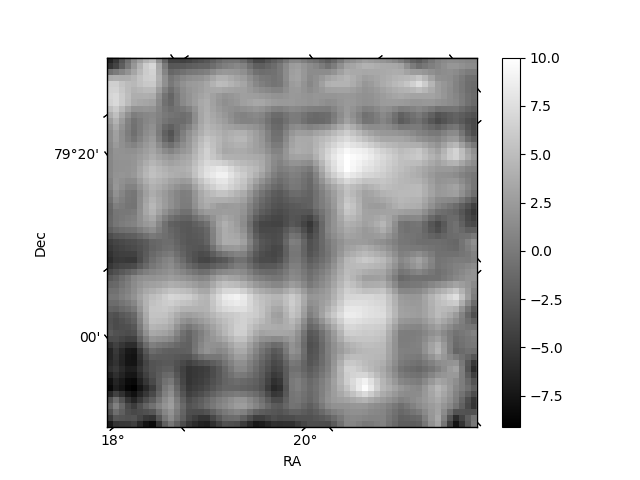
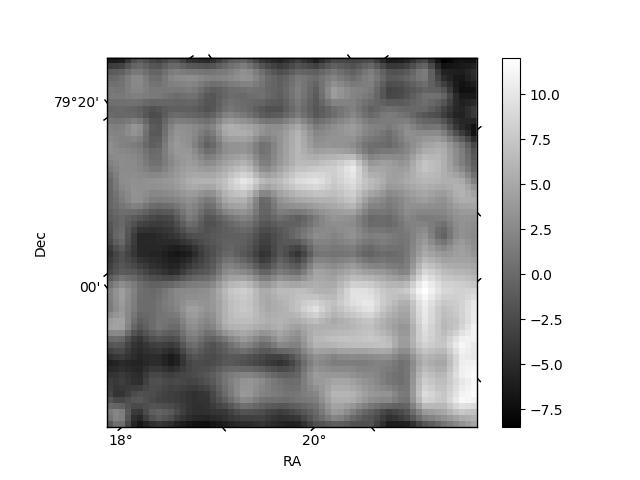
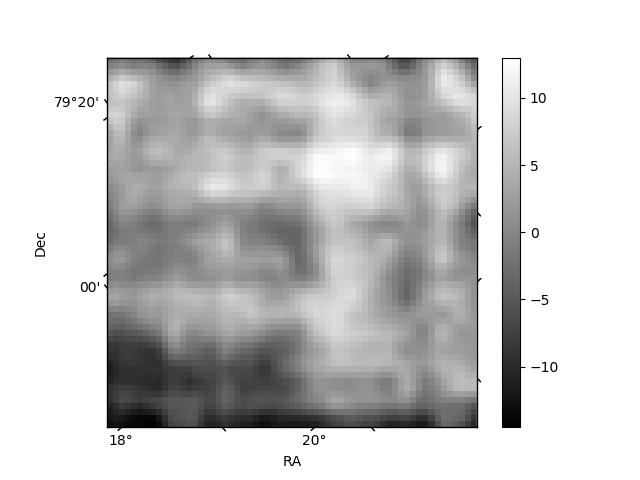
Histogram calculated using DETX and DETY for each event in the final _common_clean file
| Quadrant A | 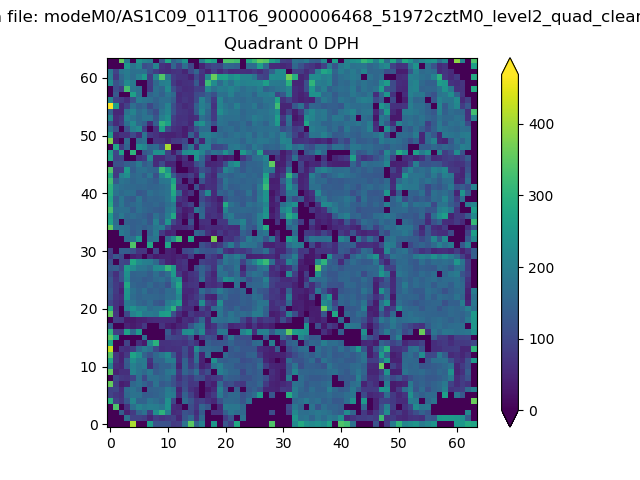 |
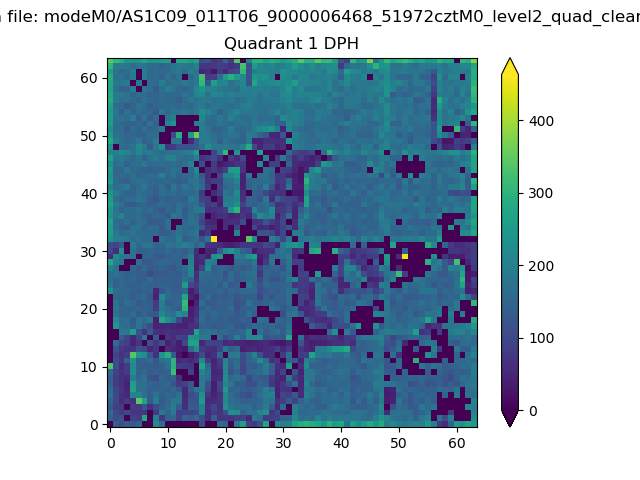 |
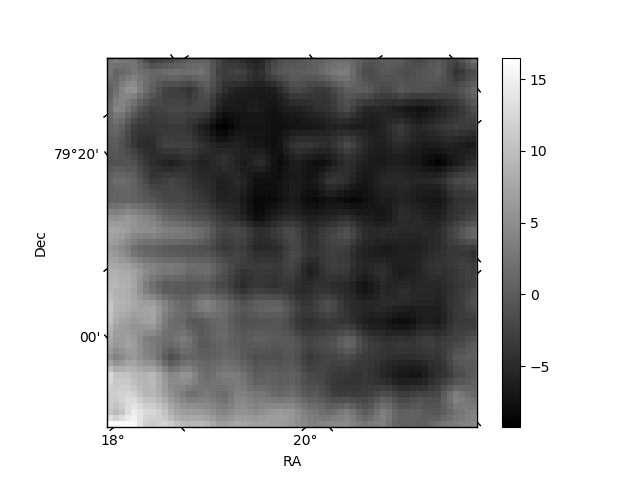
Quadrant B |
|---|---|---|---|
| Quadrant D | 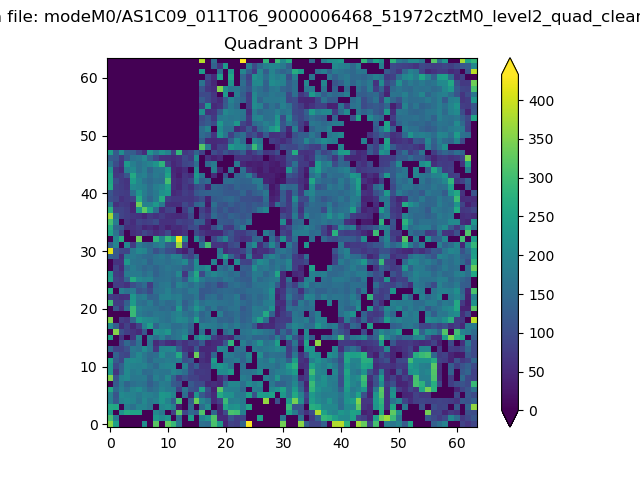 |
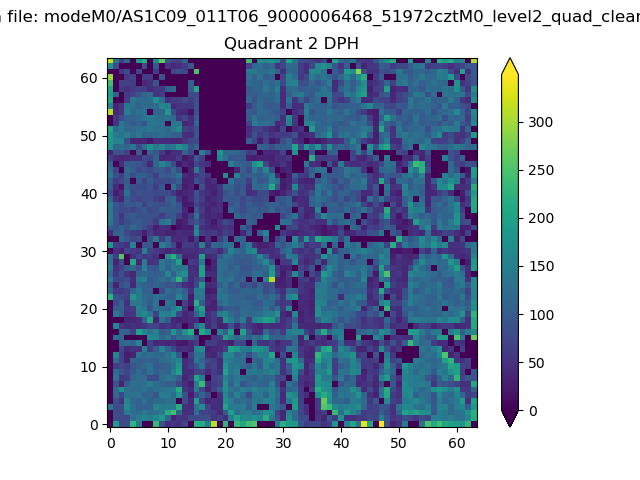 |
Quadrant C |
| Plot type | Count rate plots | Images |
|---|---|---|
| Comparison with Poisson distribution Blue bars denote a histogram of data divided into 1 sec bins. Red curve is a Poisson curve with rate = median count rate of data. |
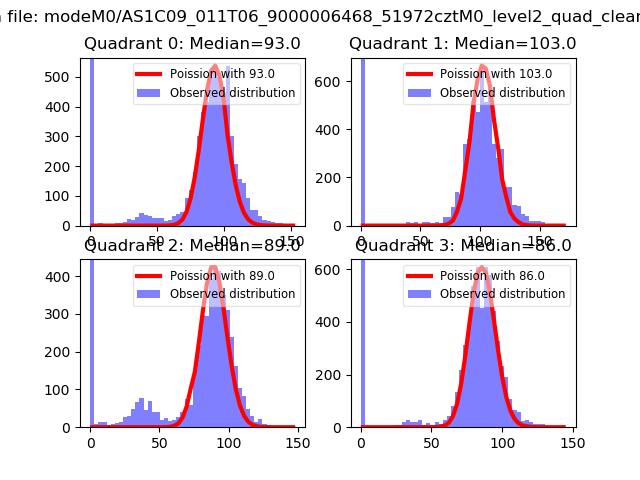 |
 |
| Quadrant-wise count rates Data is divided into 100 sec bins |
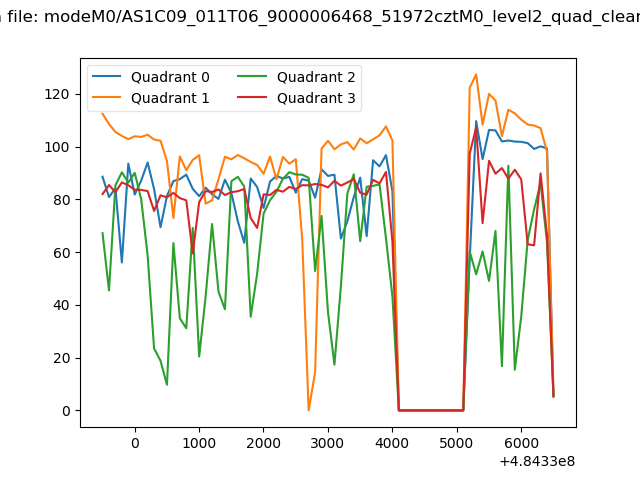 |
|
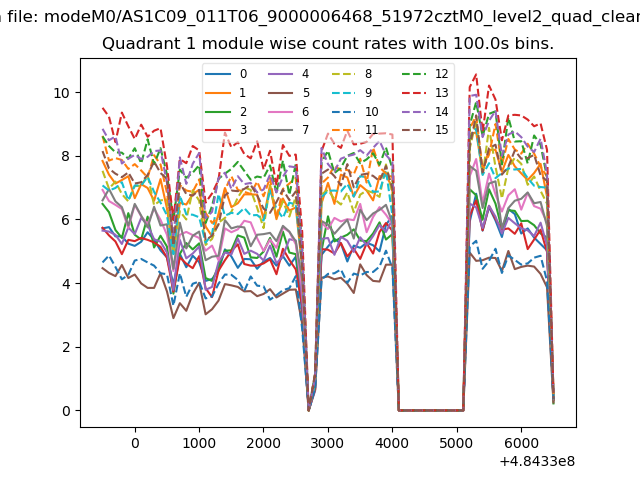
| Module-wise count rates for Quadrant A Data is divided into 100 sec bins |
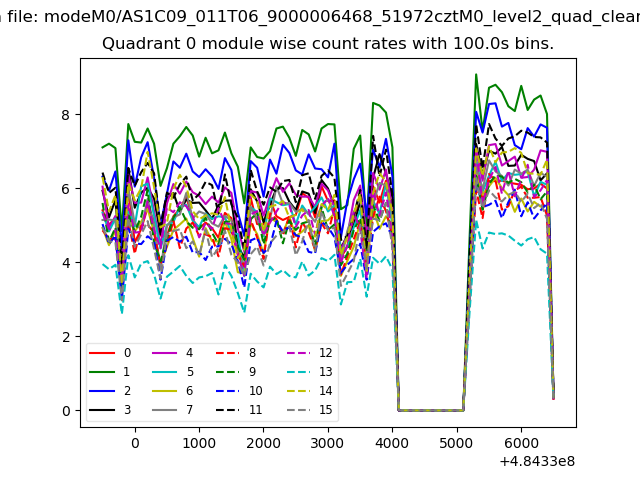 |
 |
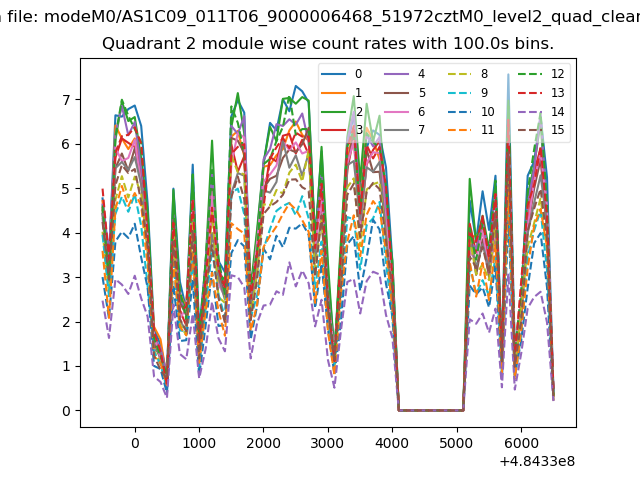
| Module-wise count rates for Quadrant B Data is divided into 100 sec bins |
 |
 |
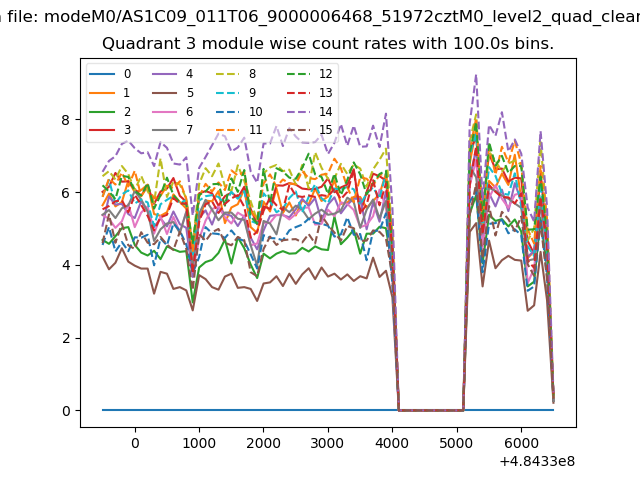
| Module-wise count rates for Quadrant C Data is divided into 100 sec bins |
 |
 |
| Module-wise count rates for Quadrant D Data is divided into 100 sec bins |
 |
 |
| Parameter | Plot |
|---|---|
| CZT HV Monitor | 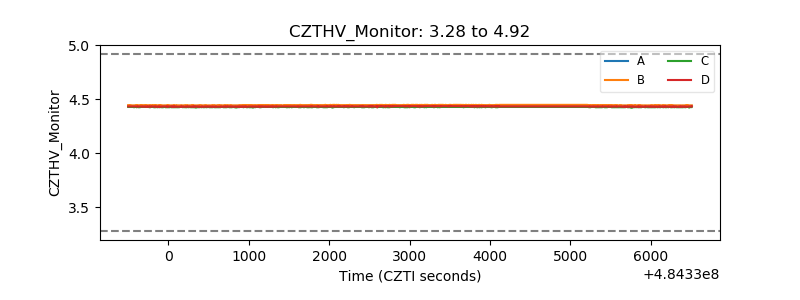 |
| D_VDD | 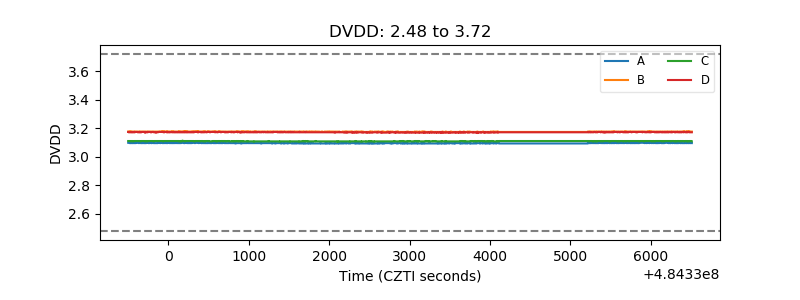 |
| Temperature 1 | 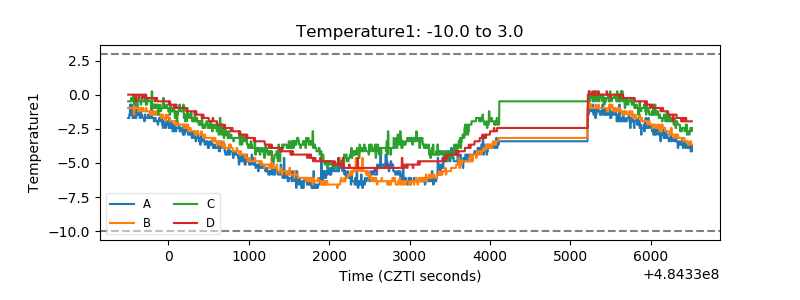 |
| Veto HV Monitor | 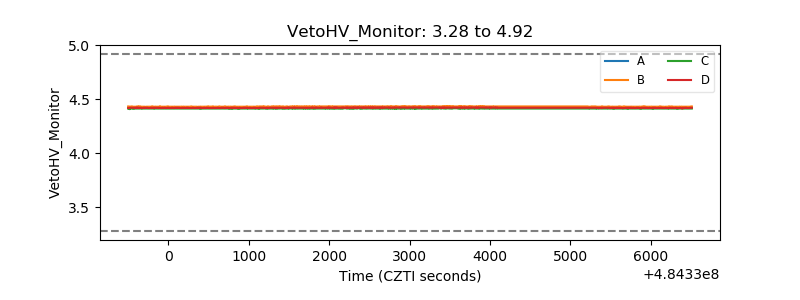 |
| Veto LLD | 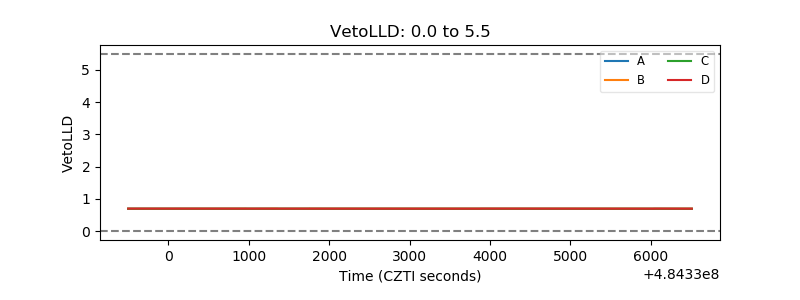 |
| Alpha Counter | 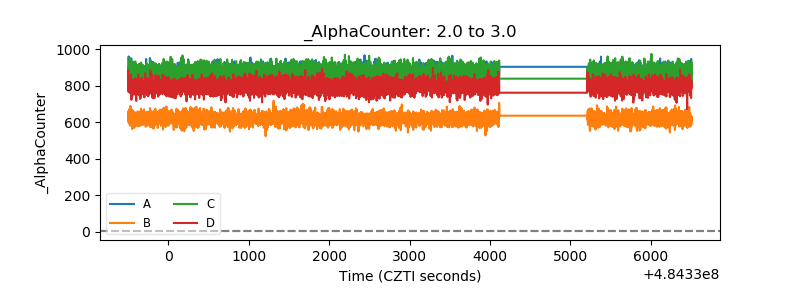 |
| _CPM_Rate | 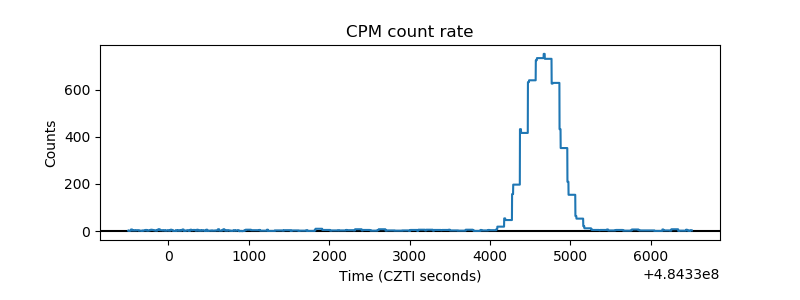 |
| CZT Counter | 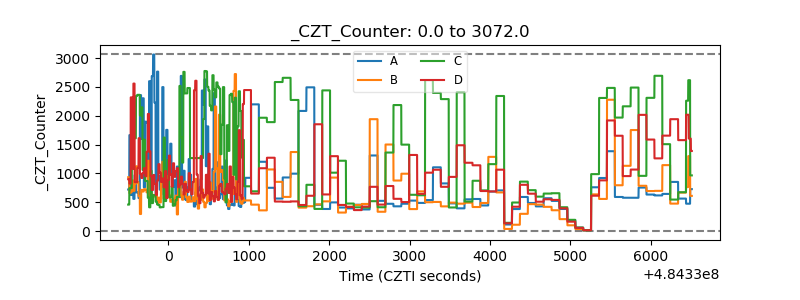 |
| +2.5 Volts monitor | 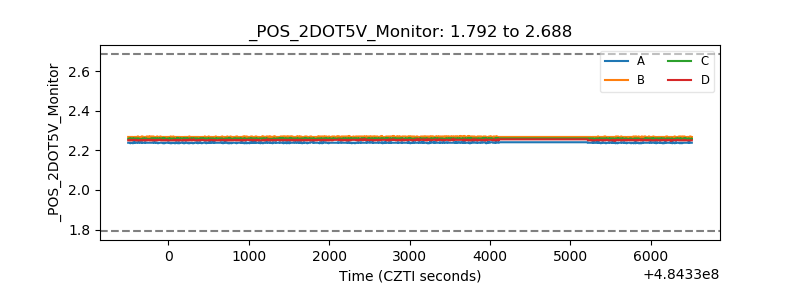 |
| +5 Volts monitor | 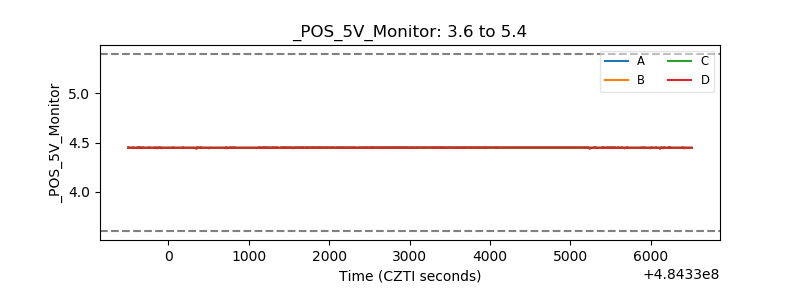 |
| _ROLL_ROT | 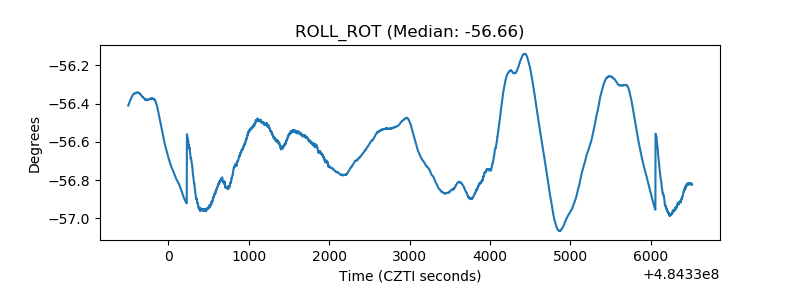 |
| _Roll_DEC | 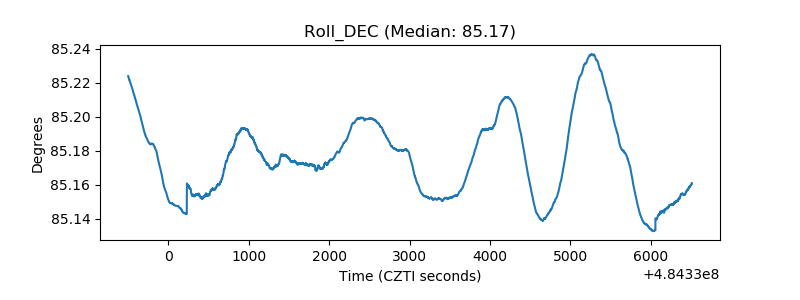 |
| _Roll_RA | 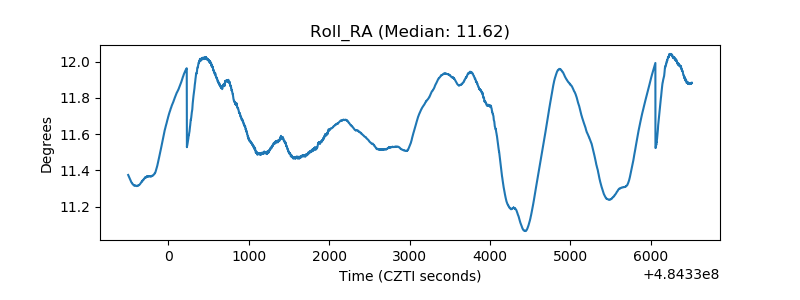 |
| Veto Counter | 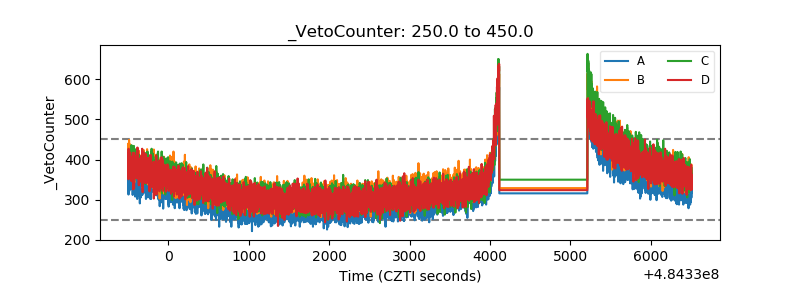 |