| Param | Original file | Final file |
|---|---|---|
| Filename | modeM0/AS1C09_011T06_9000006468_51973cztM0_level2.fits | modeM0/AS1C09_011T06_9000006468_51973cztM0_level2_quad_clean.evt |
| Size (bytes) | 819,815,040 | 83,931,840 |
| Size | 781.8 MB | 80.0 MB |
| Events in quadrant A | 6,292,641 | 576,713 |
| Events in quadrant B | 4,936,922 | 637,313 |
| Events in quadrant C | 9,366,566 | 404,265 |
| Events in quadrant D | 9,257,953 | 476,590 |
| Mode M0 | |||
|---|---|---|---|
| Quadrant | BADHDUFLAG | Total packets | Discarded packets |
| A | 0 | 23213 | 3 |
| B | 0 | 19175 | 2 |
| C | 0 | 32274 | 2 |
| D | 0 | 31922 | 2 |
| Mode M9 | |||
|---|---|---|---|
| Quadrant | BADHDUFLAG | Total packets | Discarded packets |
| A | 0 | 11 | 0 |
| B | 0 | 11 | 0 |
| C | 0 | 11 | 0 |
| D | 0 | 11 | 0 |
| Mode SS | |||
|---|---|---|---|
| Quadrant | BADHDUFLAG | Total packets | Discarded packets |
| A | 0 | 132 | 0 |
| B | 0 | 132 | 0 |
| C | 0 | 132 | 0 |
| D | 0 | 132 | 0 |
| Quadrant | Total seconds | Saturated seconds | Saturation percentage |
|---|---|---|---|
| A | 6382 | 681 | 10.670636% |
| B | 6383 | 506 | 7.927307% |
| C | 6383 | 2477 | 38.806204% |
| D | 6383 | 1442 | 22.591258% |
Noise dominated data is calculated using 1-second bins in cleaned event files. If a bin has >2000 counts, and if more than 50% of those come from <1% of pixels, then it is considered to be noise-dominated and hence unusable.
| Quadrant | # 1 sec bins | Bins with >0 counts | Bins with >2000 counts | High rate bins dominated by noise | Noise dominated (total time) | Noise dominated (detector-on time) | Marked lightcurve |
|---|---|---|---|---|---|---|---|
| A | 7536 | 6382 | 531 | 531 | 7.05% | 8.32% | 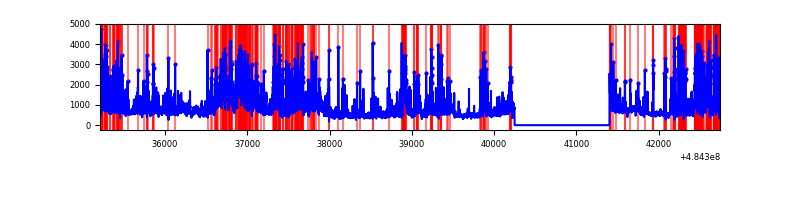 |
| B | 7538 | 6384 | 306 | 306 | 4.06% | 4.79% | 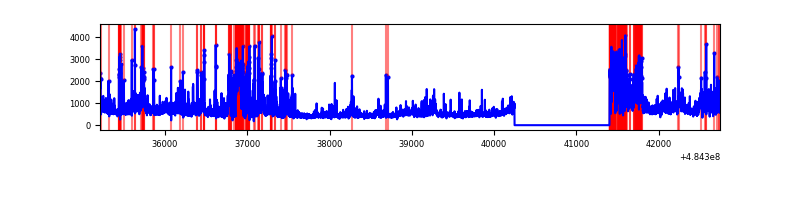 |
| C | 7538 | 6383 | 1873 | 1873 | 24.85% | 29.34% | 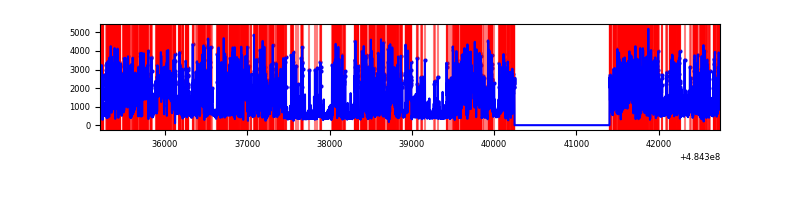 |
| D | 7538 | 6384 | 1434 | 1434 | 19.02% | 22.46% | 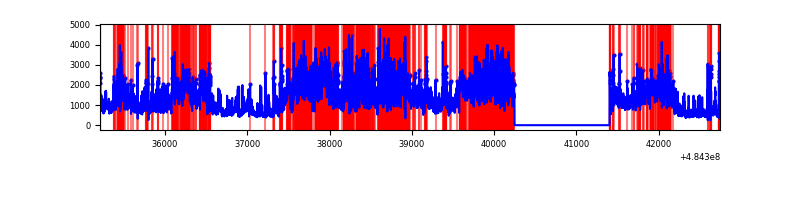 |
Top three noisy pixels from each quadrant. If the there are fewer than three noisy pixels in the level2.evt file, extra rows are filled as -1
| Pixel properties | Quadrant properties | ||||||
|---|---|---|---|---|---|---|---|
| Quadrant | DetID | PixID | Counts | Sigma | Mean | Median | Sigma |
| A | 7 | 64 | 1521755 | 9222.26 | 657 | 642 | 164.9 |
| A | 4 | 249 | 548940 | 3324.24 | 657 | 642 | 164.9 |
| A | 3 | 14 | 537439 | 3254.51 | 657 | 642 | 164.9 |
| B | 4 | 249 | 367291 | 2643.3 | 664 | 643 | 138.7 |
| B | 4 | 170 | 325359 | 2341.0 | 664 | 643 | 138.7 |
| B | 4 | 81 | 189314 | 1360.2 | 664 | 643 | 138.7 |
| C | 15 | 224 | 5733031 | 37823.45 | 546 | 542 | 151.6 |
| C | 15 | 147 | 605274 | 3990.07 | 546 | 542 | 151.6 |
| C | 13 | 3 | 273345 | 1799.98 | 546 | 542 | 151.6 |
| D | 2 | 172 | 2857504 | 15918.43 | 624 | 596 | 179.5 |
| D | 6 | 42 | 2035667 | 11339.23 | 624 | 596 | 179.5 |
| D | 10 | 199 | 601534 | 3348.37 | 624 | 596 | 179.5 |
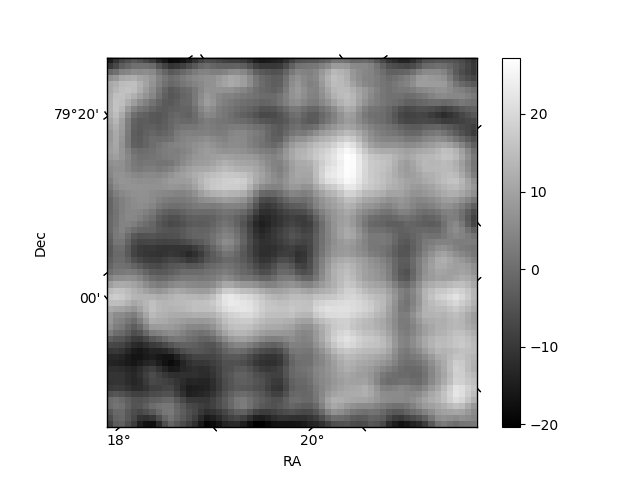
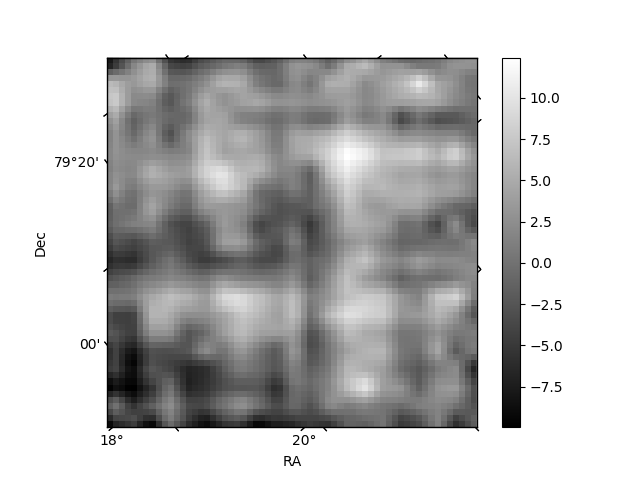
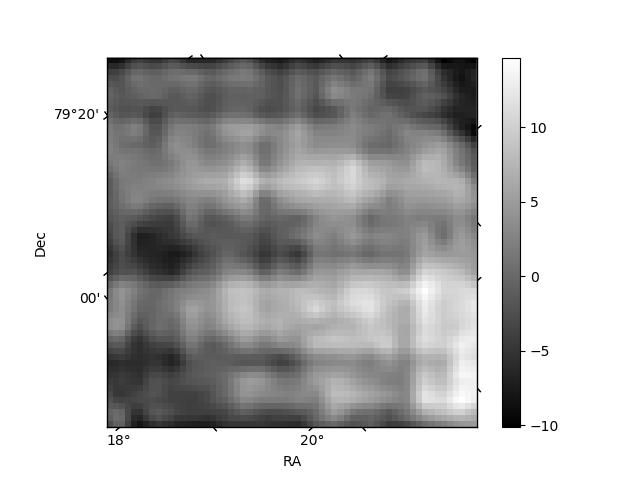
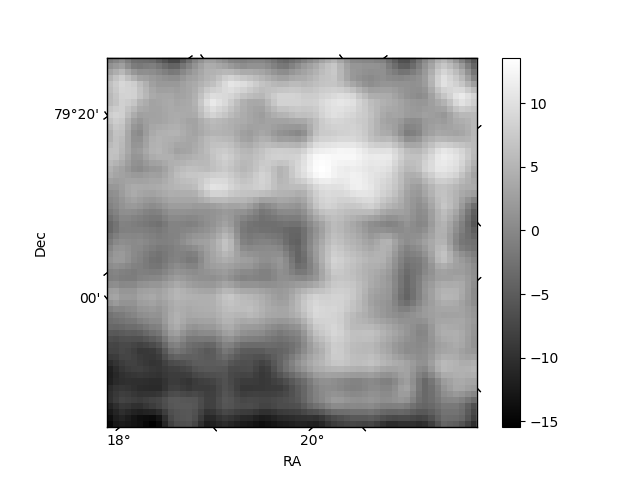
Histogram calculated using DETX and DETY for each event in the final _common_clean file
| Quadrant A | 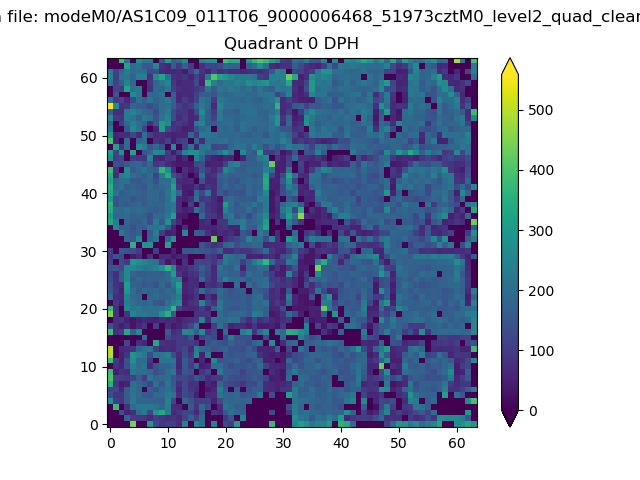 |
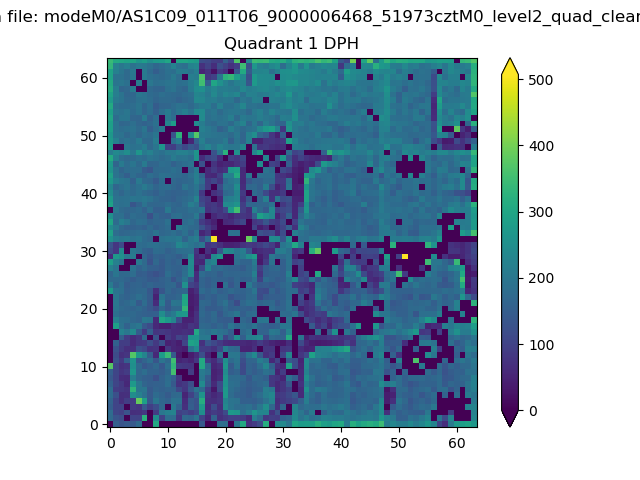 |
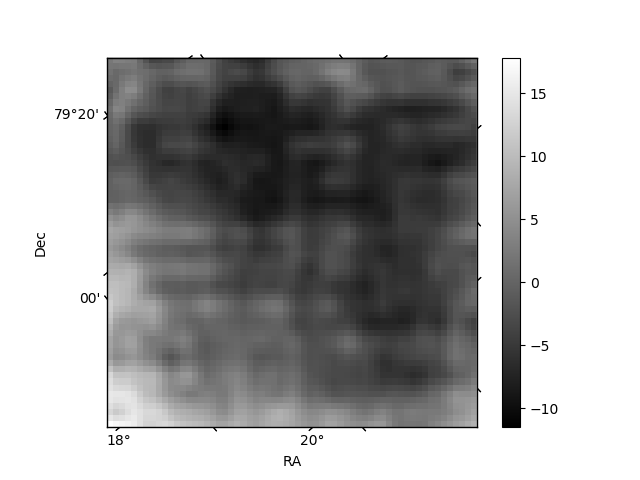
Quadrant B |
|---|---|---|---|
| Quadrant D | 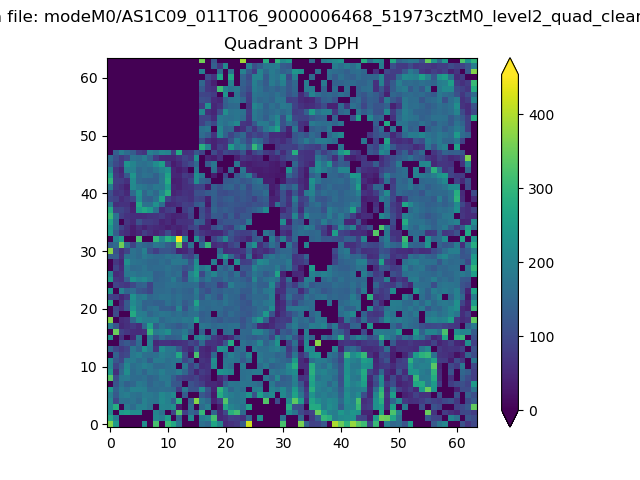 |
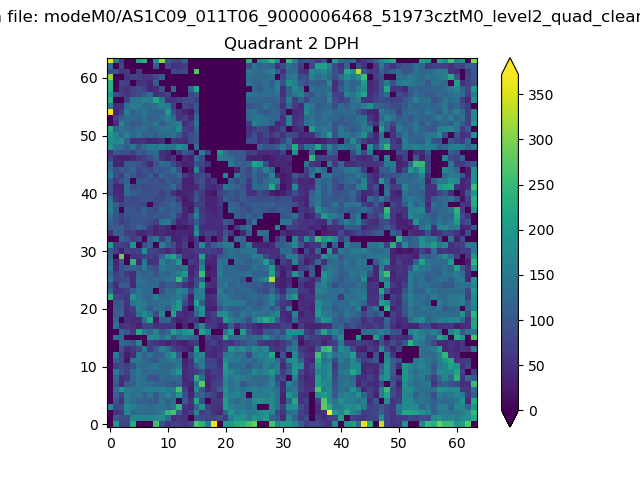 |
Quadrant C |
| Plot type | Count rate plots | Images |
|---|---|---|
| Comparison with Poisson distribution Blue bars denote a histogram of data divided into 1 sec bins. Red curve is a Poisson curve with rate = median count rate of data. |
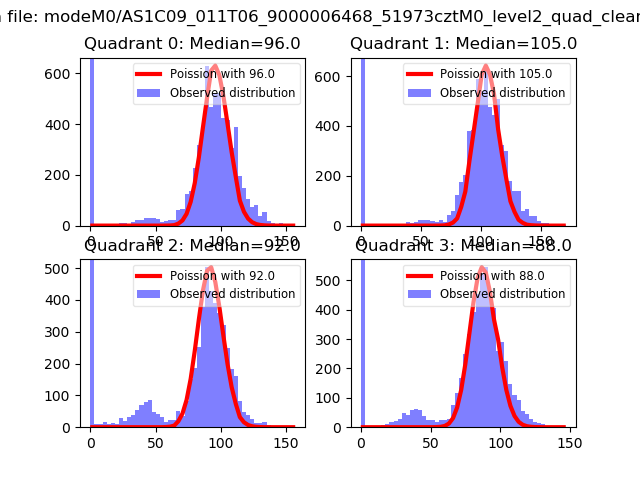 |
 |
| Quadrant-wise count rates Data is divided into 100 sec bins |
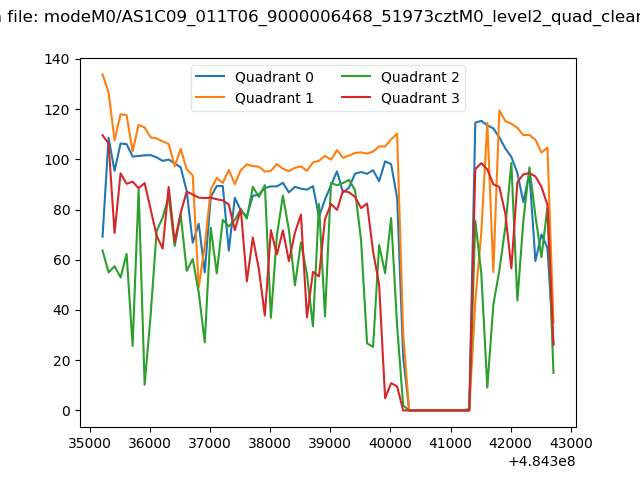 |
|
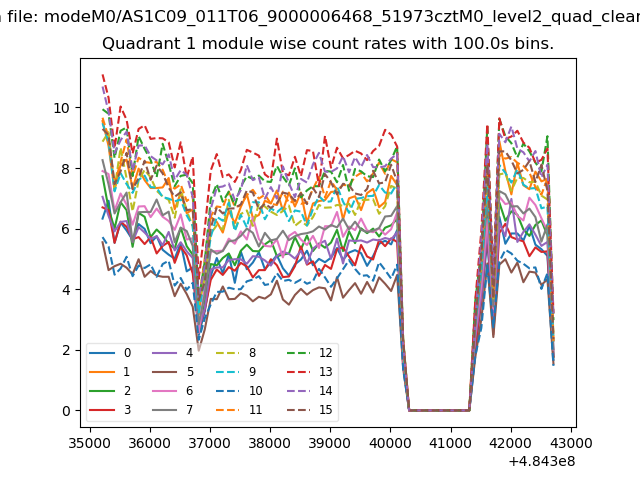
| Module-wise count rates for Quadrant A Data is divided into 100 sec bins |
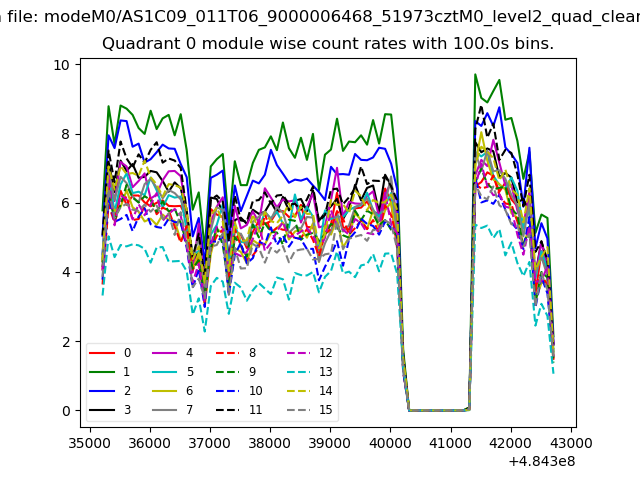 |
 |
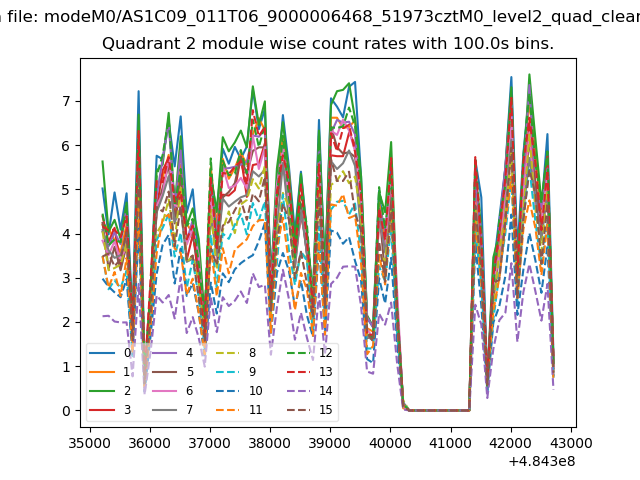
| Module-wise count rates for Quadrant B Data is divided into 100 sec bins |
 |
 |
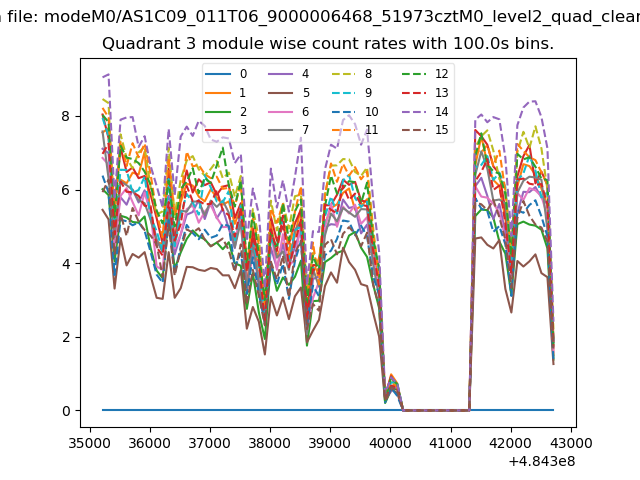
| Module-wise count rates for Quadrant C Data is divided into 100 sec bins |
 |
 |
| Module-wise count rates for Quadrant D Data is divided into 100 sec bins |
 |
 |
| Parameter | Plot |
|---|---|
| CZT HV Monitor | 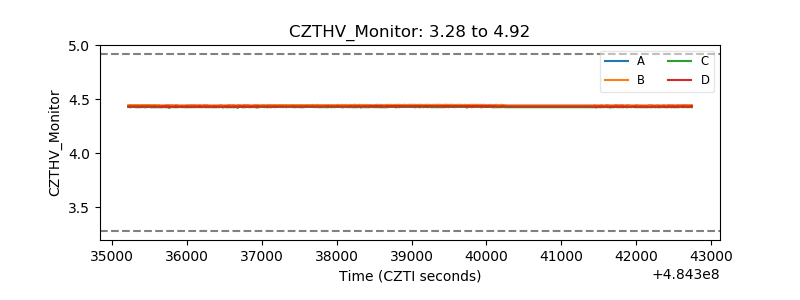 |
| D_VDD | 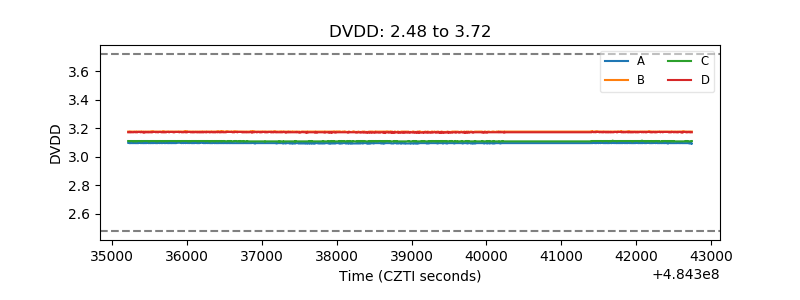 |
| Temperature 1 | 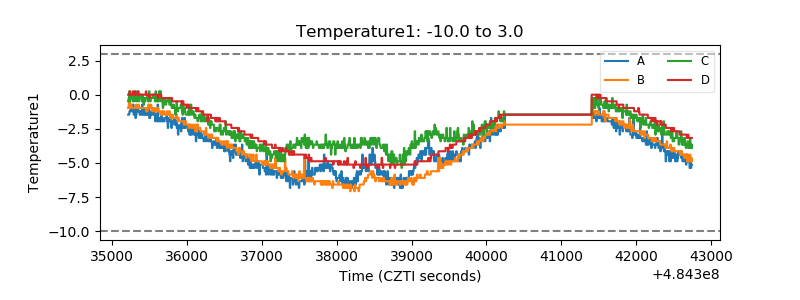 |
| Veto HV Monitor | 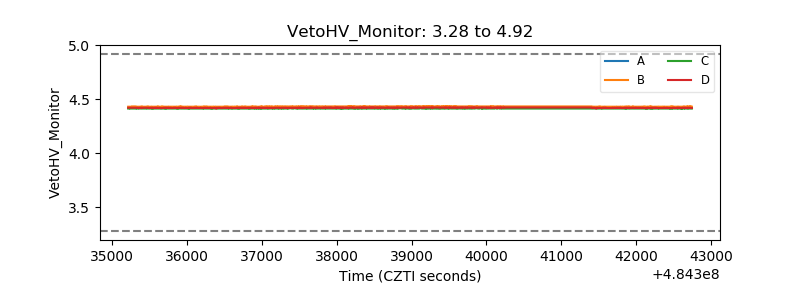 |
| Veto LLD | 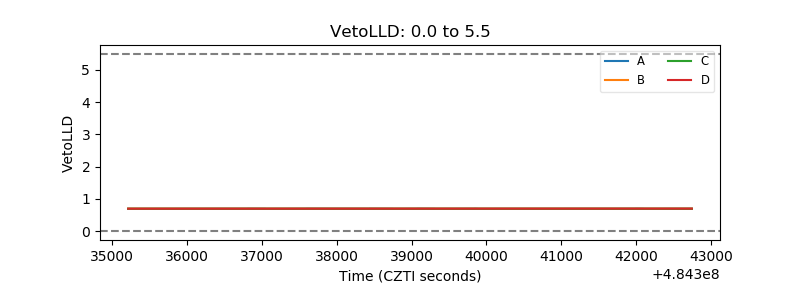 |
| Alpha Counter | 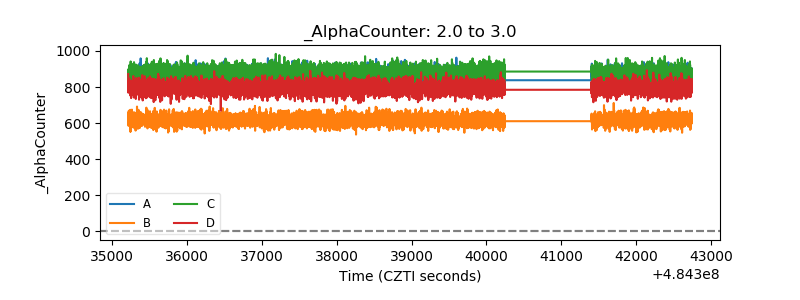 |
| _CPM_Rate | 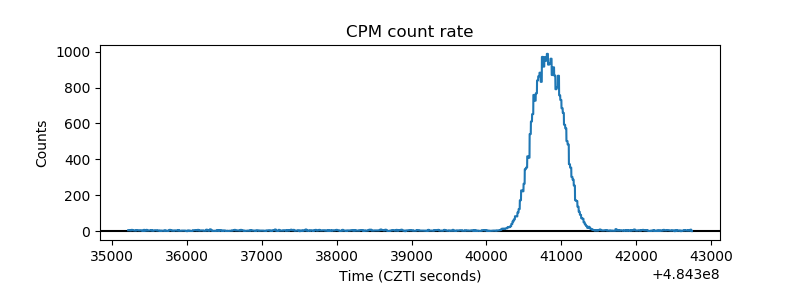 |
| CZT Counter | 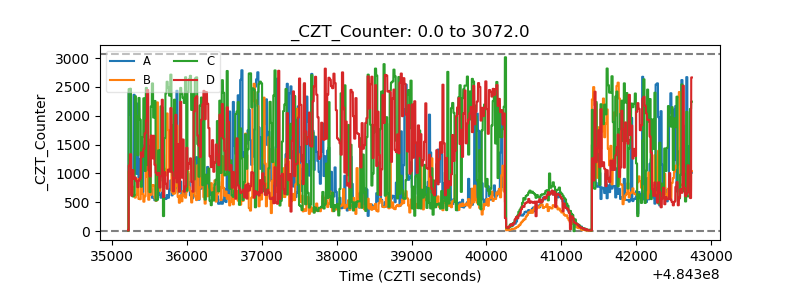 |
| +2.5 Volts monitor | 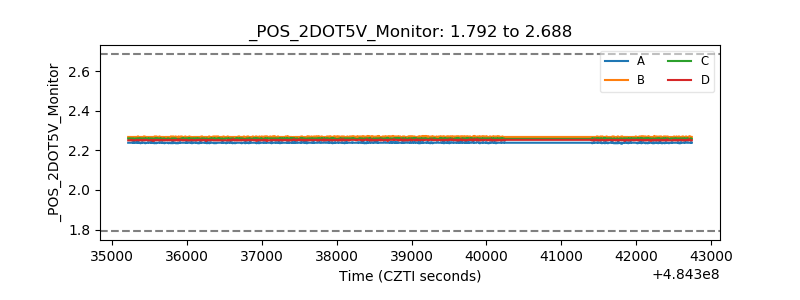 |
| +5 Volts monitor | 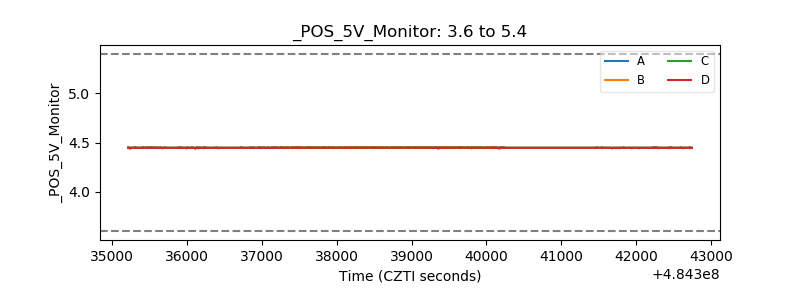 |
| _ROLL_ROT | 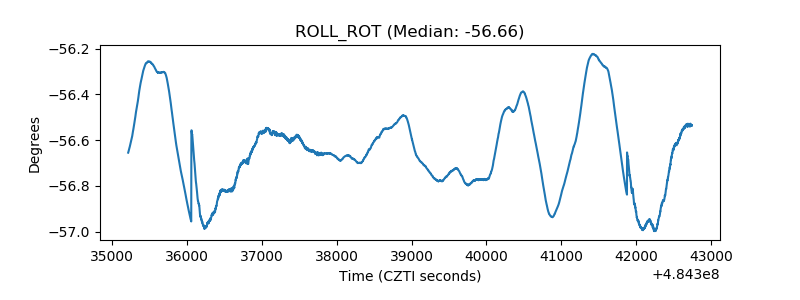 |
| _Roll_DEC | 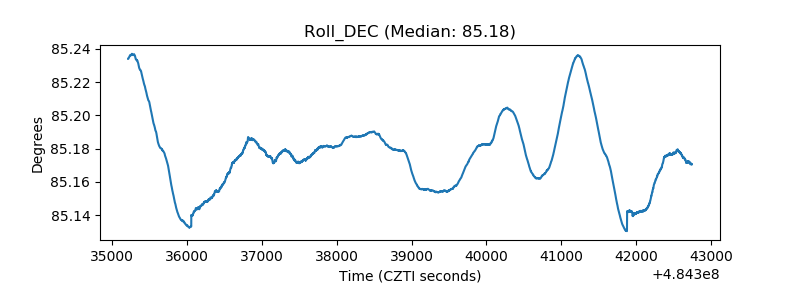 |
| _Roll_RA | 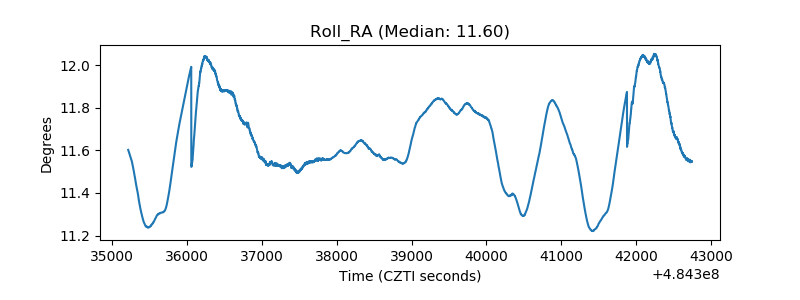 |
| Veto Counter | 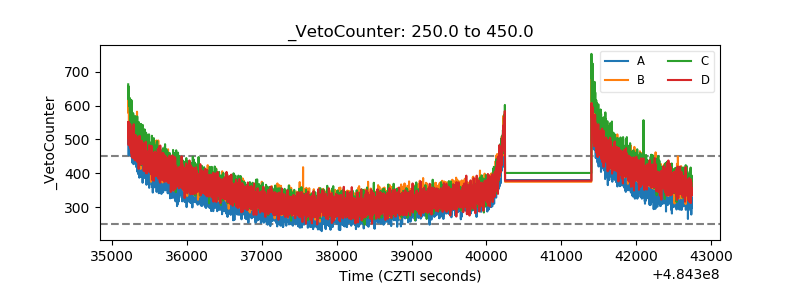 |