| Param | Original file | Final file |
|---|---|---|
| Filename | modeM0/AS1C09_011T06_9000006468_51974cztM0_level2.fits | modeM0/AS1C09_011T06_9000006468_51974cztM0_level2_quad_clean.evt |
| Size (bytes) | 728,821,440 | 85,734,720 |
| Size | 695.1 MB | 81.8 MB |
| Events in quadrant A | 5,986,091 | 551,523 |
| Events in quadrant B | 5,010,676 | 637,455 |
| Events in quadrant C | 8,776,083 | 448,098 |
| Events in quadrant D | 6,714,859 | 515,347 |
| Mode M0 | |||
|---|---|---|---|
| Quadrant | BADHDUFLAG | Total packets | Discarded packets |
| A | 0 | 22306 | 2 |
| B | 0 | 19278 | 2 |
| C | 0 | 30461 | 2 |
| D | 0 | 24396 | 2 |
| Mode M9 | |||
|---|---|---|---|
| Quadrant | BADHDUFLAG | Total packets | Discarded packets |
| A | 0 | 12 | 0 |
| B | 0 | 13 | 0 |
| C | 0 | 13 | 0 |
| D | 0 | 13 | 0 |
| Mode SS | |||
|---|---|---|---|
| Quadrant | BADHDUFLAG | Total packets | Discarded packets |
| A | 0 | 130 | 0 |
| B | 0 | 130 | 0 |
| C | 0 | 130 | 0 |
| D | 0 | 130 | 0 |
| Quadrant | Total seconds | Saturated seconds | Saturation percentage |
|---|---|---|---|
| A | 6347 | 909 | 14.321727% |
| B | 6346 | 491 | 7.737157% |
| C | 6346 | 2068 | 32.587457% |
| D | 6346 | 814 | 12.826978% |
Noise dominated data is calculated using 1-second bins in cleaned event files. If a bin has >2000 counts, and if more than 50% of those come from <1% of pixels, then it is considered to be noise-dominated and hence unusable.
| Quadrant | # 1 sec bins | Bins with >0 counts | Bins with >2000 counts | High rate bins dominated by noise | Noise dominated (total time) | Noise dominated (detector-on time) | Marked lightcurve |
|---|---|---|---|---|---|---|---|
| A | 7533 | 6349 | 699 | 699 | 9.28% | 11.01% | 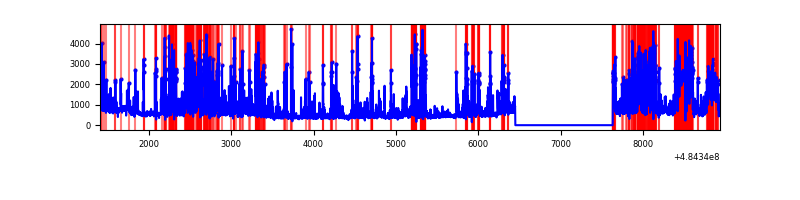 |
| B | 7532 | 6348 | 256 | 256 | 3.40% | 4.03% | 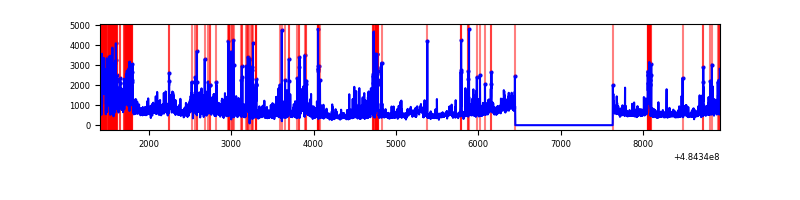 |
| C | 7532 | 6348 | 1542 | 1542 | 20.47% | 24.29% | 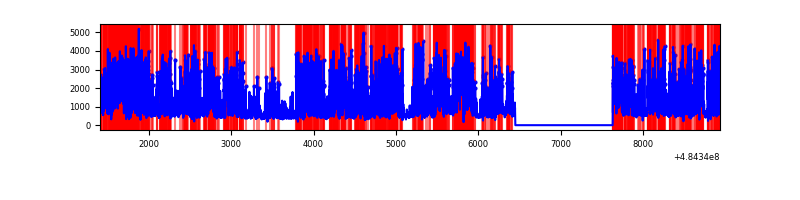 |
| D | 7532 | 6348 | 771 | 771 | 10.24% | 12.15% | 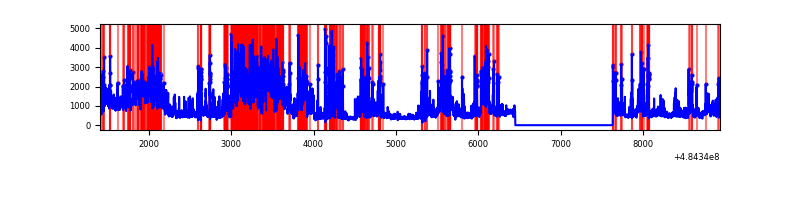 |
Top three noisy pixels from each quadrant. If the there are fewer than three noisy pixels in the level2.evt file, extra rows are filled as -1
| Pixel properties | Quadrant properties | ||||||
|---|---|---|---|---|---|---|---|
| Quadrant | DetID | PixID | Counts | Sigma | Mean | Median | Sigma |
| A | 7 | 64 | 1122928 | 7106.58 | 632 | 615 | 157.9 |
| A | 8 | 249 | 1114690 | 7054.41 | 632 | 615 | 157.9 |
| A | 4 | 249 | 444070 | 2807.99 | 632 | 615 | 157.9 |
| B | 8 | 128 | 352137 | 2520.66 | 661 | 639 | 139.4 |
| B | 5 | 250 | 331886 | 2375.44 | 661 | 639 | 139.4 |
| B | 4 | 170 | 327585 | 2344.59 | 661 | 639 | 139.4 |
| C | 15 | 224 | 5543592 | 34749.54 | 573 | 568 | 159.5 |
| C | 4 | 5 | 276851 | 1732.03 | 573 | 568 | 159.5 |
| C | 13 | 3 | 250719 | 1568.21 | 573 | 568 | 159.5 |
| D | 6 | 42 | 2736516 | 14991.89 | 637 | 610 | 182.5 |
| D | 3 | 12 | 298409 | 1631.84 | 637 | 610 | 182.5 |
| D | 7 | 96 | 188212 | 1028.0 | 637 | 610 | 182.5 |
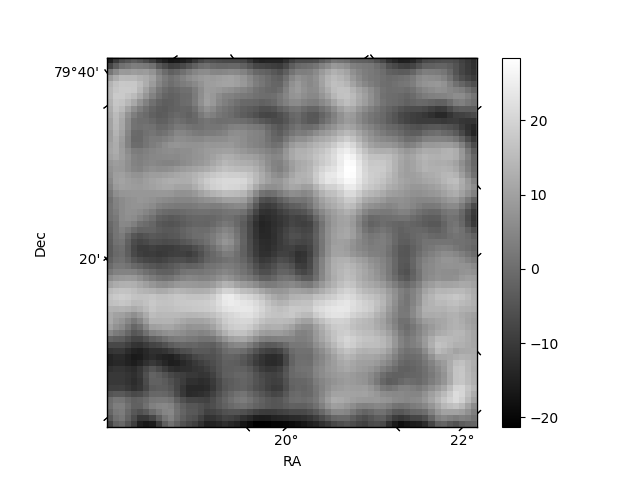
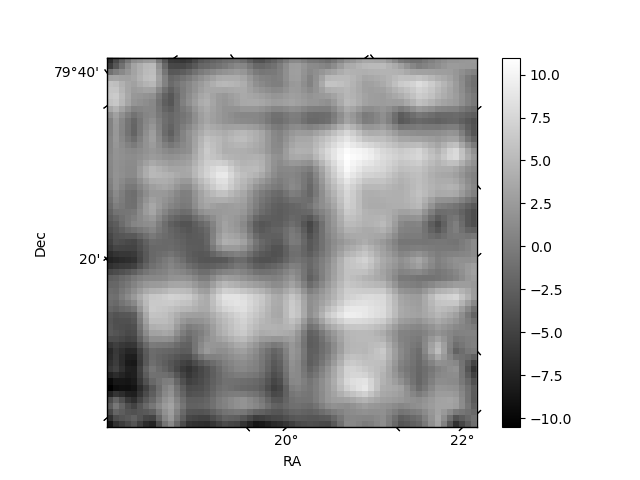
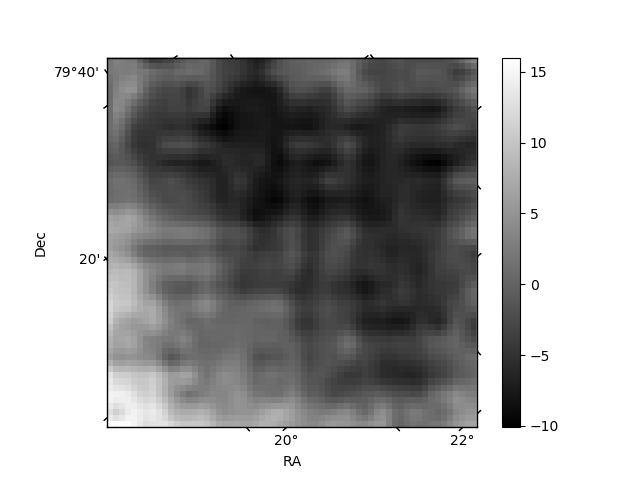
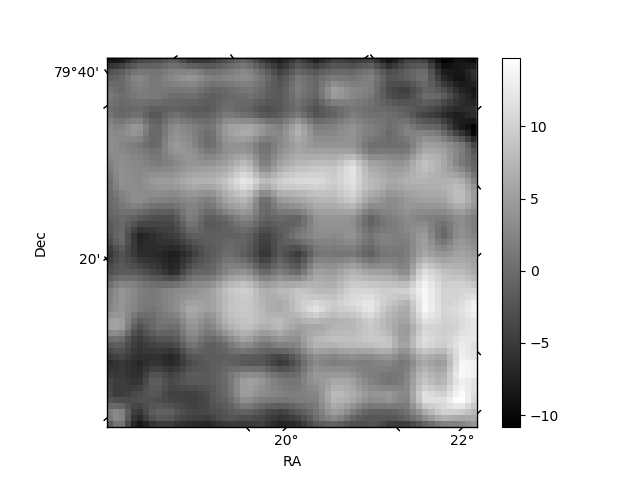
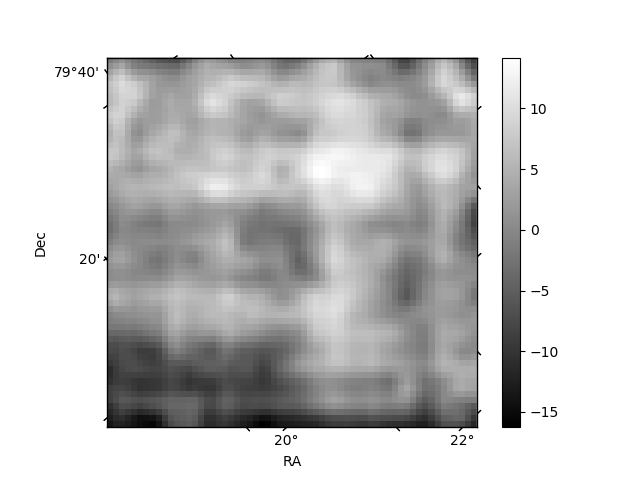
Histogram calculated using DETX and DETY for each event in the final _common_clean file
| Quadrant A | 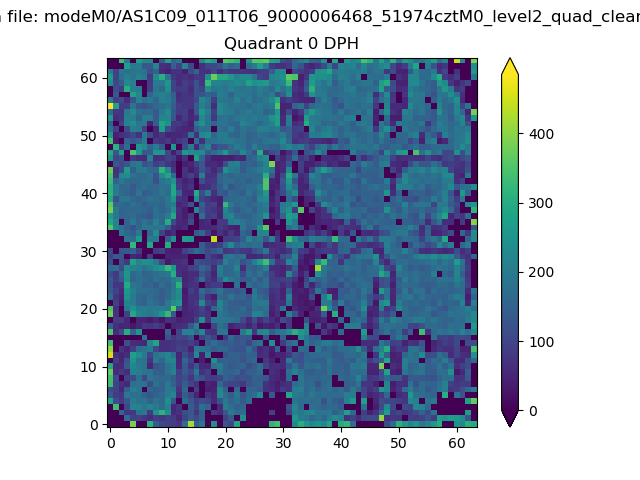 |
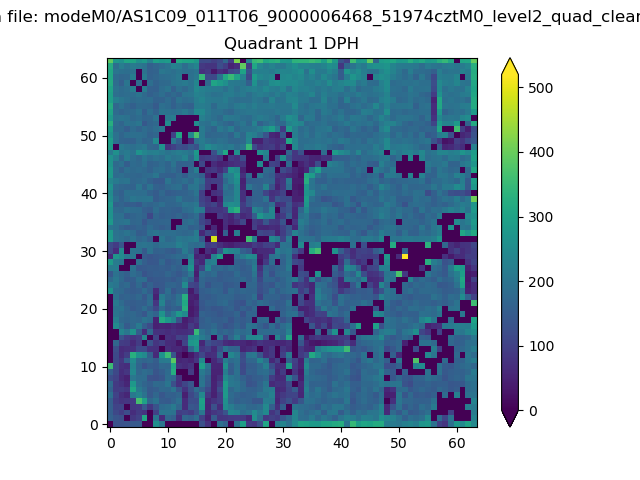 |
Quadrant B |
|---|---|---|---|
| Quadrant D | 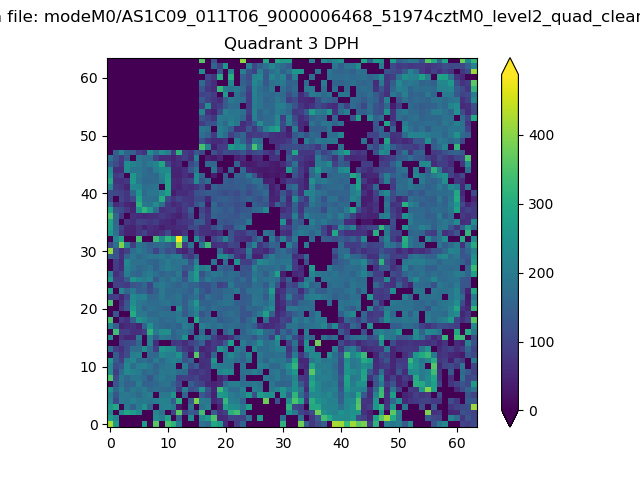 |
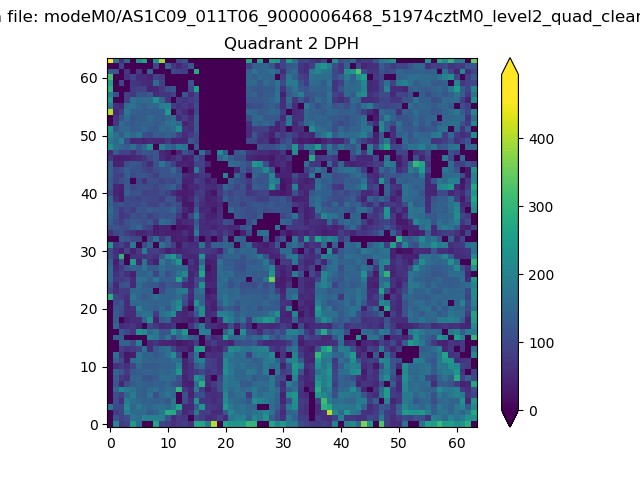 |
Quadrant C |
| Plot type | Count rate plots | Images |
|---|---|---|
| Comparison with Poisson distribution Blue bars denote a histogram of data divided into 1 sec bins. Red curve is a Poisson curve with rate = median count rate of data. |
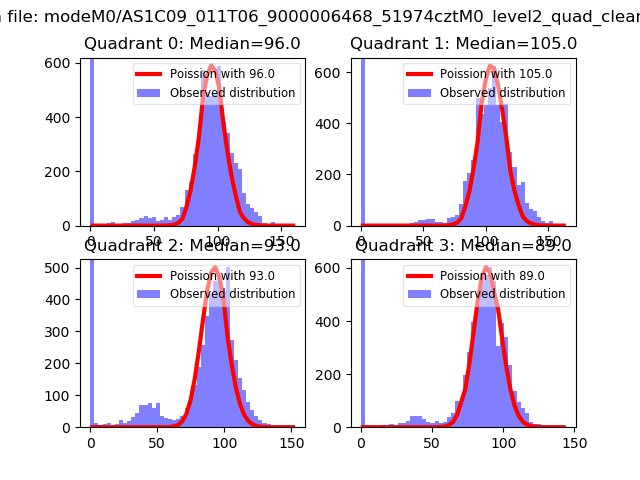 |
 |
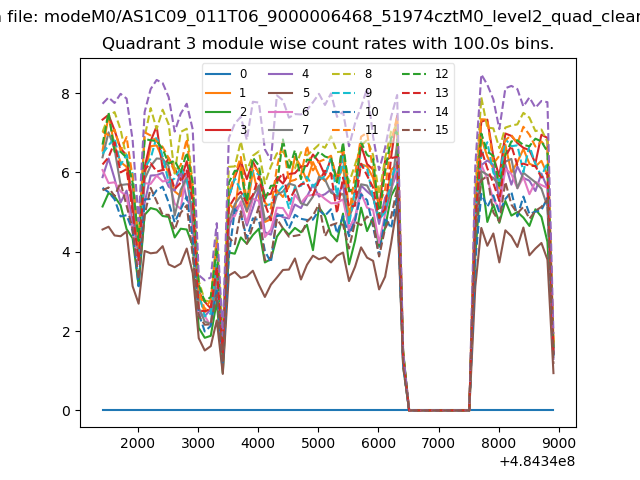
| Quadrant-wise count rates Data is divided into 100 sec bins |
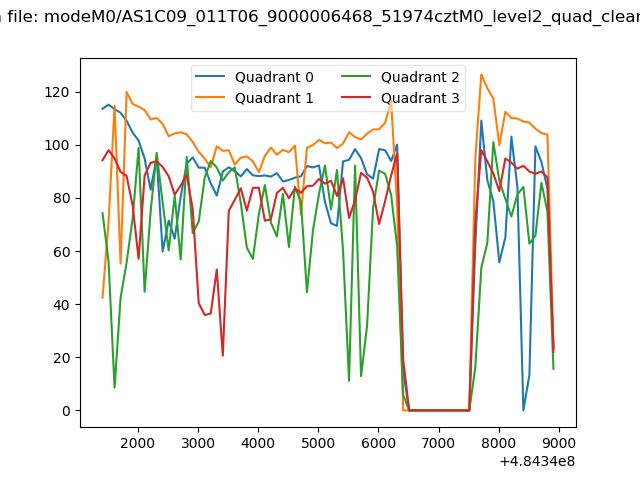 |
|
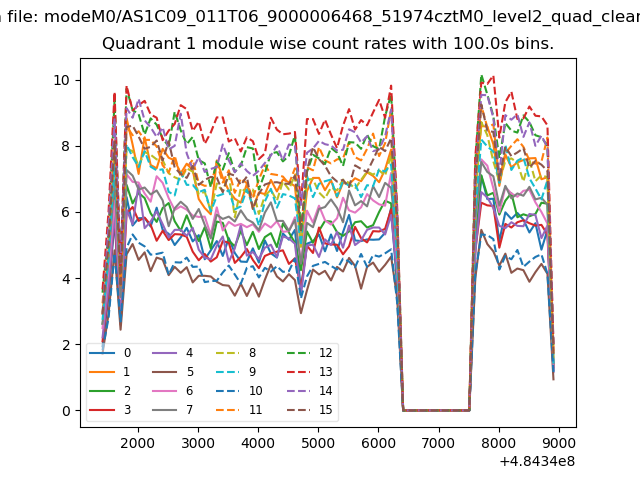
| Module-wise count rates for Quadrant A Data is divided into 100 sec bins |
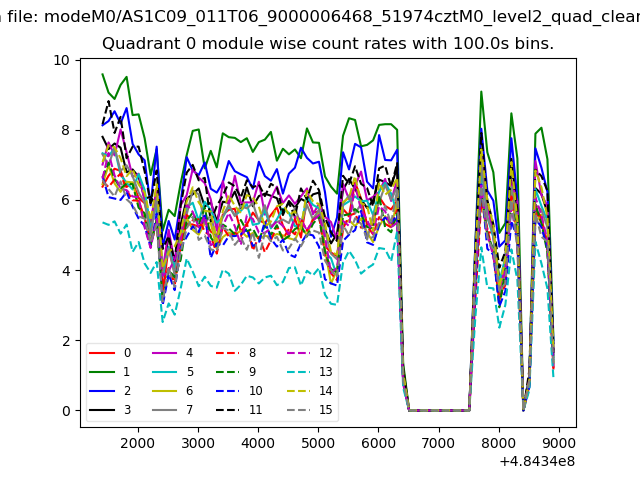 |
 |
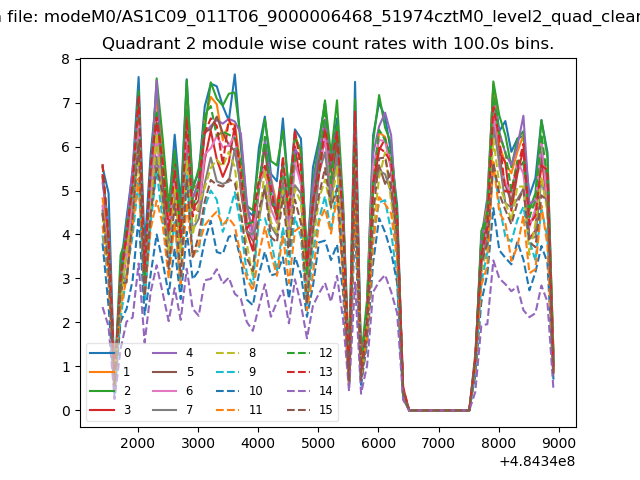
| Module-wise count rates for Quadrant B Data is divided into 100 sec bins |
 |
 |
| Module-wise count rates for Quadrant C Data is divided into 100 sec bins |
 |
 |
| Module-wise count rates for Quadrant D Data is divided into 100 sec bins |
 |
 |
| Parameter | Plot |
|---|---|
| CZT HV Monitor | 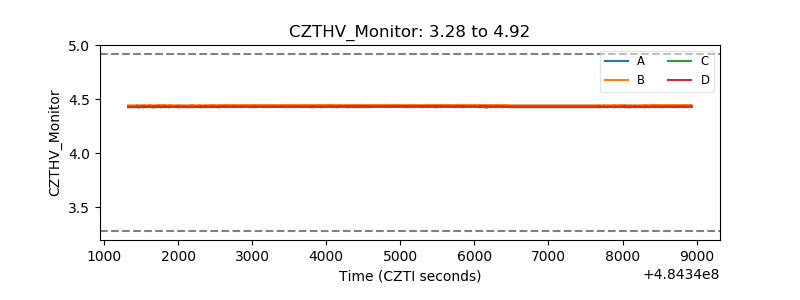 |
| D_VDD | 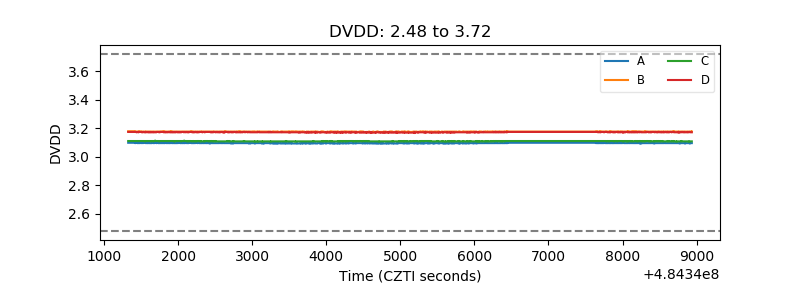 |
| Temperature 1 | 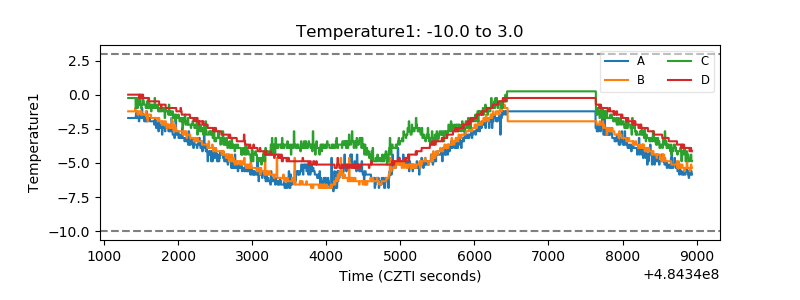 |
| Veto HV Monitor | 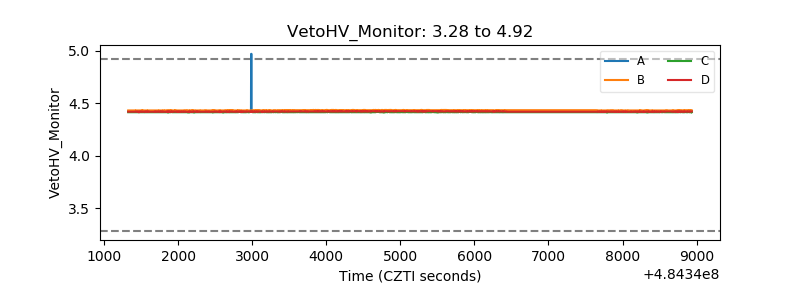 |
| Veto LLD | 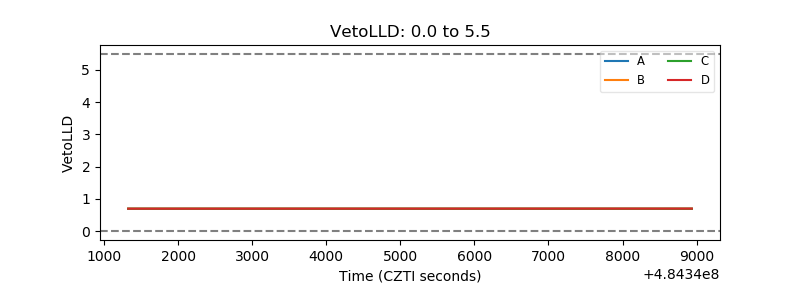 |
| Alpha Counter | 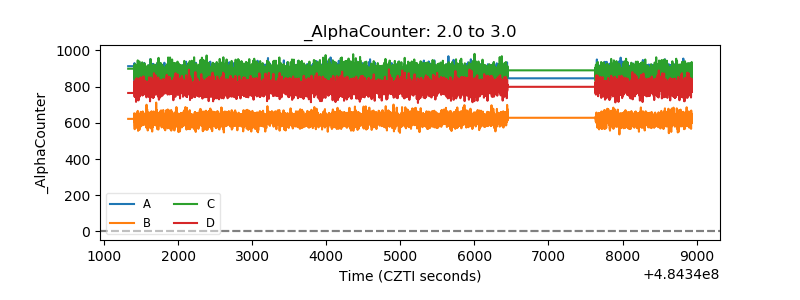 |
| _CPM_Rate | 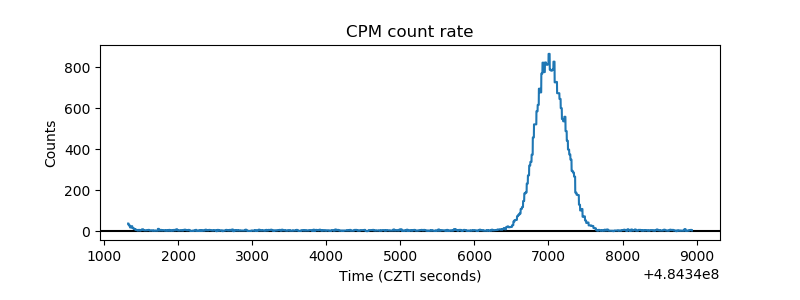 |
| CZT Counter | 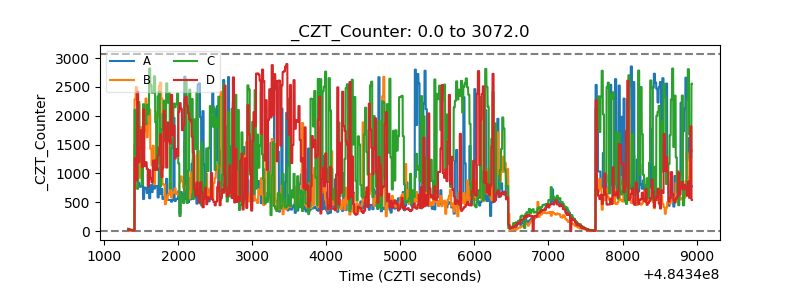 |
| +2.5 Volts monitor | 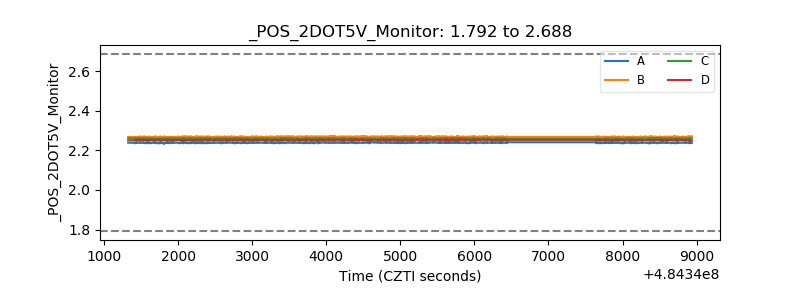 |
| +5 Volts monitor | 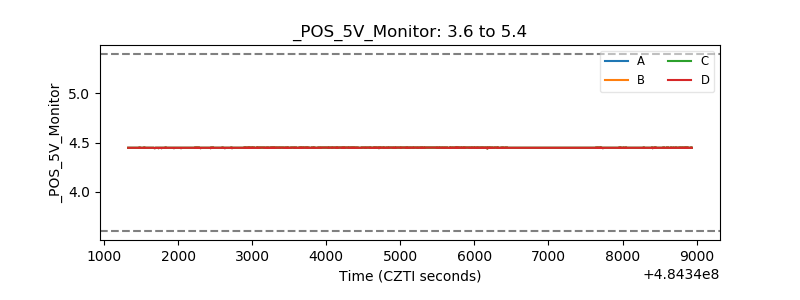 |
| _ROLL_ROT | 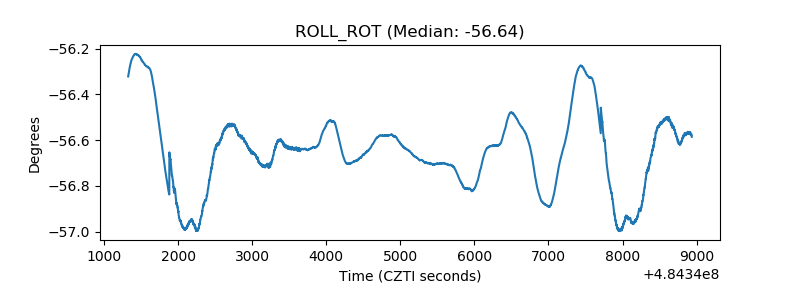 |
| _Roll_DEC | 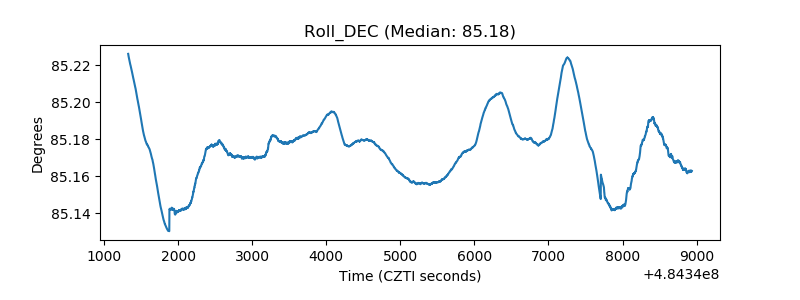 |
| _Roll_RA | 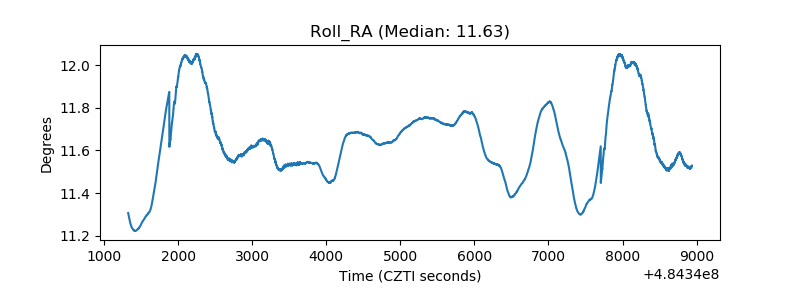 |
| Veto Counter | 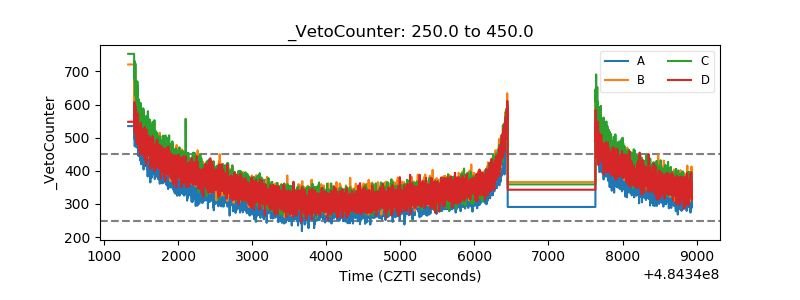 |