| Param | Original file | Final file |
|---|---|---|
| Filename | modeM0/AS1C09_011T06_9000006468_51975cztM0_level2.fits | modeM0/AS1C09_011T06_9000006468_51975cztM0_level2_quad_clean.evt |
| Size (bytes) | 649,105,920 | 89,280,000 |
| Size | 619.0 MB | 85.1 MB |
| Events in quadrant A | 6,021,106 | 553,847 |
| Events in quadrant B | 4,229,106 | 671,779 |
| Events in quadrant C | 8,296,025 | 464,684 |
| Events in quadrant D | 4,980,176 | 561,083 |
| Mode M0 | |||
|---|---|---|---|
| Quadrant | BADHDUFLAG | Total packets | Discarded packets |
| A | 0 | 22528 | 2 |
| B | 0 | 17074 | 2 |
| C | 0 | 29197 | 2 |
| D | 0 | 19258 | 2 |
| Mode M9 | |||
|---|---|---|---|
| Quadrant | BADHDUFLAG | Total packets | Discarded packets |
| A | 0 | 11 | 0 |
| B | 0 | 11 | 0 |
| C | 0 | 11 | 0 |
| D | 0 | 11 | 0 |
| Mode SS | |||
|---|---|---|---|
| Quadrant | BADHDUFLAG | Total packets | Discarded packets |
| A | 0 | 132 | 0 |
| B | 0 | 132 | 0 |
| C | 0 | 132 | 0 |
| D | 0 | 132 | 0 |
| Quadrant | Total seconds | Saturated seconds | Saturation percentage |
|---|---|---|---|
| A | 6472 | 857 | 13.241656% |
| B | 6473 | 151 | 2.332767% |
| C | 6472 | 1891 | 29.218171% |
| D | 6472 | 189 | 2.920272% |
Noise dominated data is calculated using 1-second bins in cleaned event files. If a bin has >2000 counts, and if more than 50% of those come from <1% of pixels, then it is considered to be noise-dominated and hence unusable.
| Quadrant | # 1 sec bins | Bins with >0 counts | Bins with >2000 counts | High rate bins dominated by noise | Noise dominated (total time) | Noise dominated (detector-on time) | Marked lightcurve |
|---|---|---|---|---|---|---|---|
| A | 7603 | 6474 | 650 | 650 | 8.55% | 10.04% | 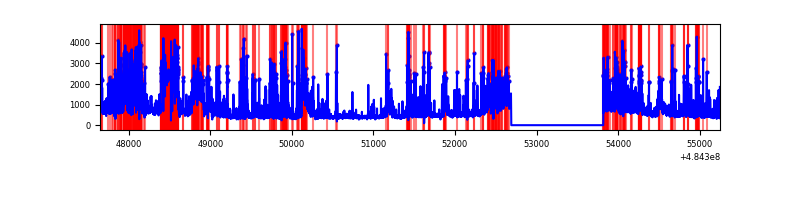 |
| B | 7604 | 6475 | 70 | 70 | 0.92% | 1.08% | 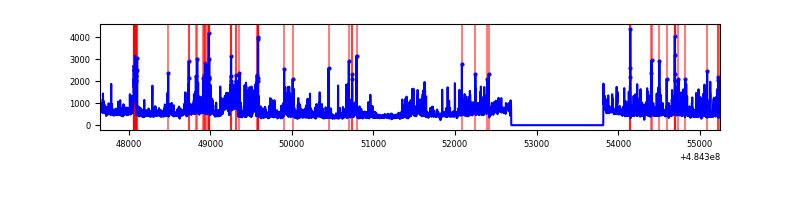 |
| C | 7603 | 6474 | 1389 | 1389 | 18.27% | 21.46% | 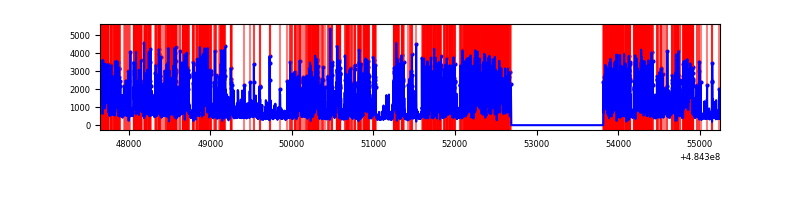 |
| D | 7603 | 6474 | 148 | 148 | 1.95% | 2.29% | 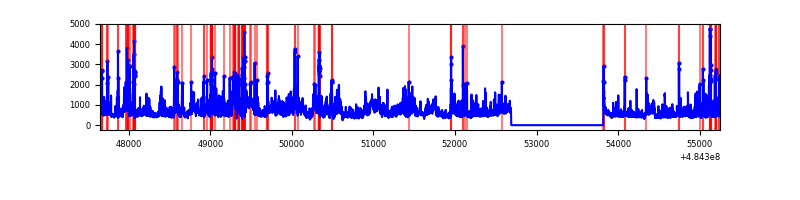 |
Top three noisy pixels from each quadrant. If the there are fewer than three noisy pixels in the level2.evt file, extra rows are filled as -1
| Pixel properties | Quadrant properties | ||||||
|---|---|---|---|---|---|---|---|
| Quadrant | DetID | PixID | Counts | Sigma | Mean | Median | Sigma |
| A | 8 | 249 | 1274672 | 8055.75 | 634 | 619 | 158.2 |
| A | 7 | 64 | 1199541 | 7580.7 | 634 | 619 | 158.2 |
| A | 8 | 62 | 310124 | 1956.98 | 634 | 619 | 158.2 |
| B | 8 | 128 | 290611 | 2049.78 | 678 | 655 | 141.5 |
| B | 10 | 254 | 167572 | 1179.98 | 678 | 655 | 141.5 |
| B | 4 | 171 | 153839 | 1082.9 | 678 | 655 | 141.5 |
| C | 15 | 224 | 4999748 | 30991.38 | 579 | 574 | 161.3 |
| C | 13 | 3 | 479061 | 2966.28 | 579 | 574 | 161.3 |
| C | 4 | 5 | 168735 | 1042.48 | 579 | 574 | 161.3 |
| D | 6 | 42 | 876958 | 4637.8 | 657 | 627 | 189.0 |
| D | 2 | 172 | 307448 | 1623.79 | 657 | 627 | 189.0 |
| D | 3 | 12 | 258868 | 1366.69 | 657 | 627 | 189.0 |
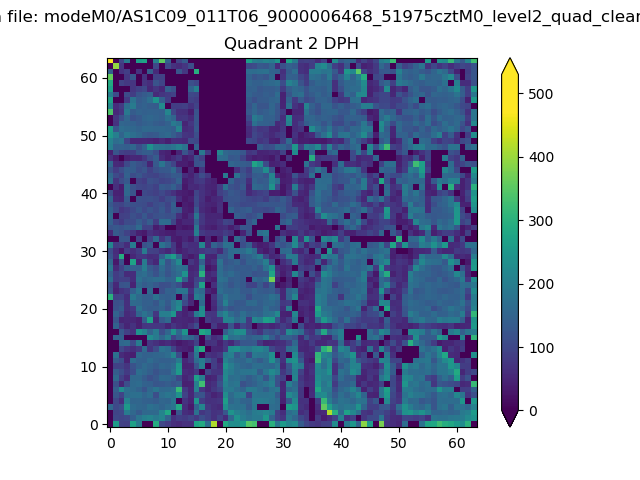
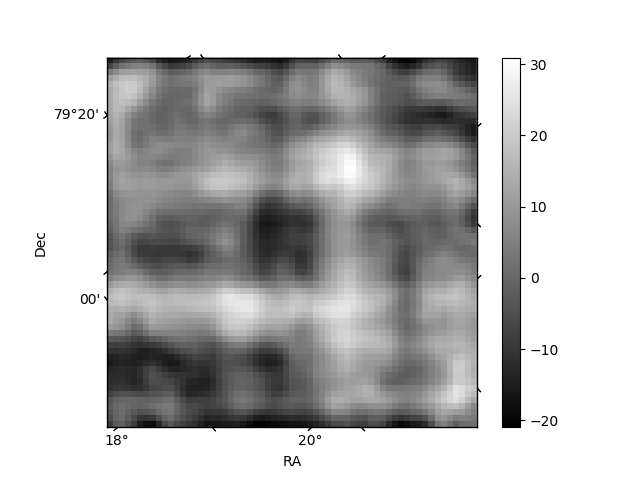
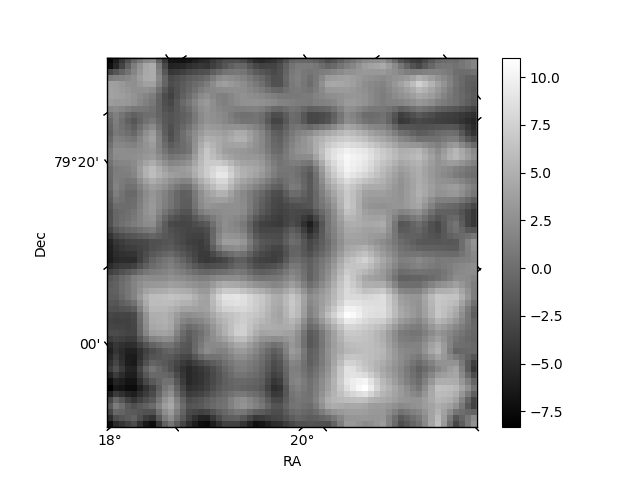
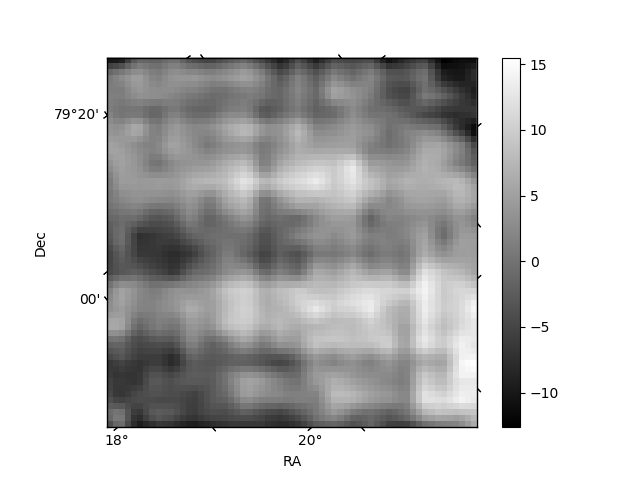
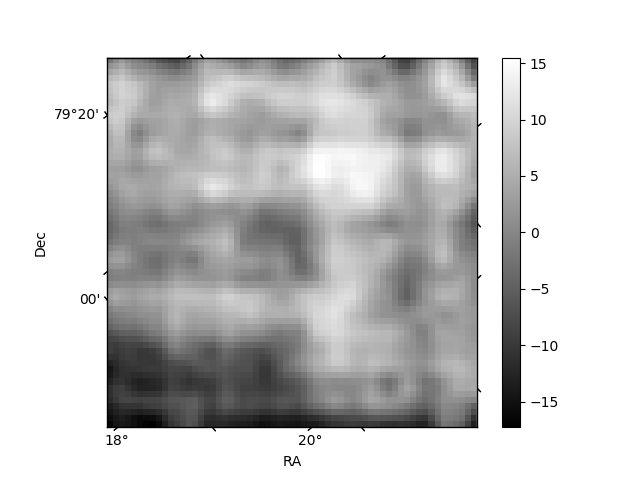
Histogram calculated using DETX and DETY for each event in the final _common_clean file
| Quadrant A | 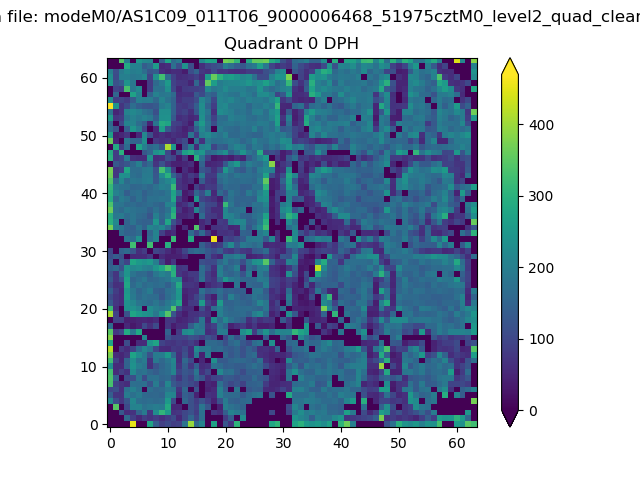 |
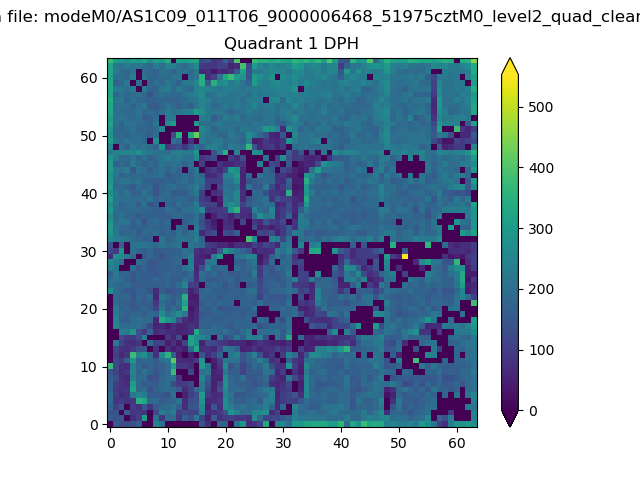 |
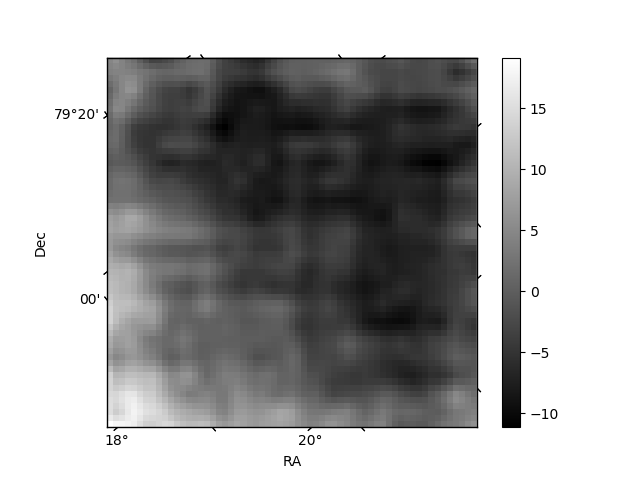
Quadrant B |
|---|---|---|---|
| Quadrant D | 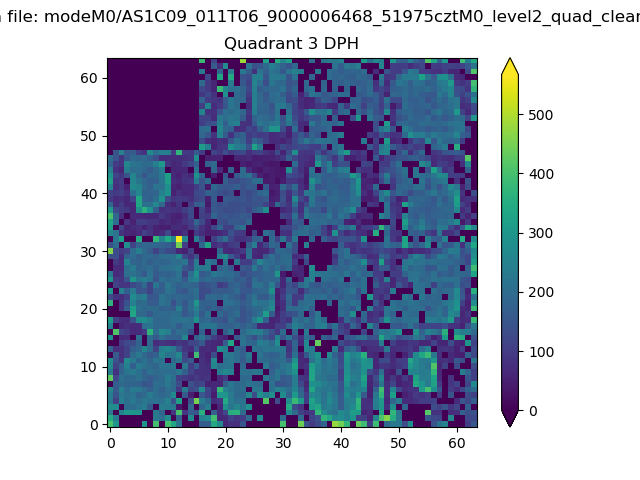 |
 |
Quadrant C |
| Plot type | Count rate plots | Images |
|---|---|---|
| Comparison with Poisson distribution Blue bars denote a histogram of data divided into 1 sec bins. Red curve is a Poisson curve with rate = median count rate of data. |
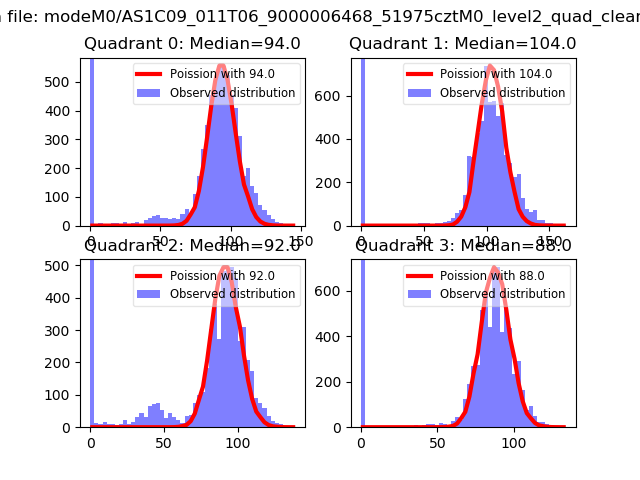 |
 |
| Quadrant-wise count rates Data is divided into 100 sec bins |
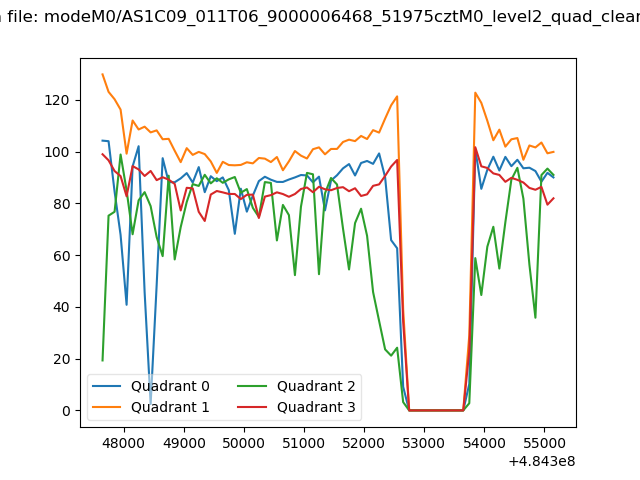 |
|
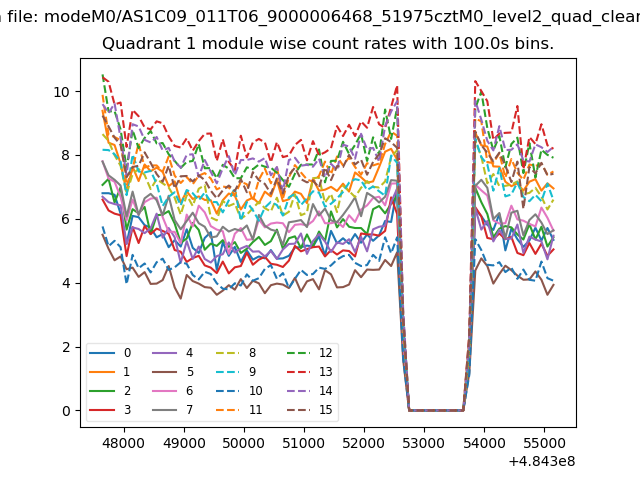
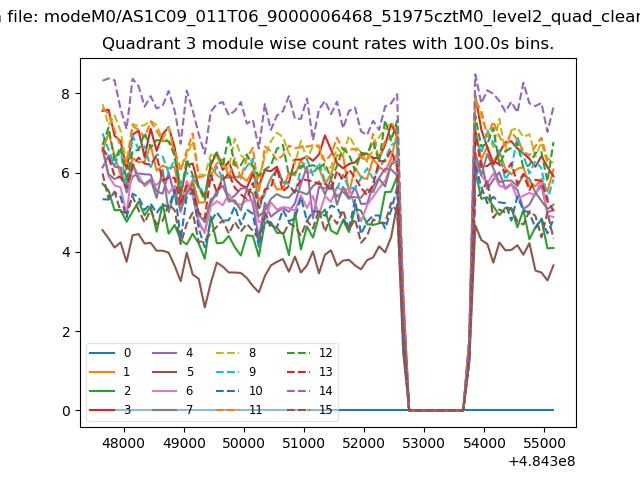
| Module-wise count rates for Quadrant A Data is divided into 100 sec bins |
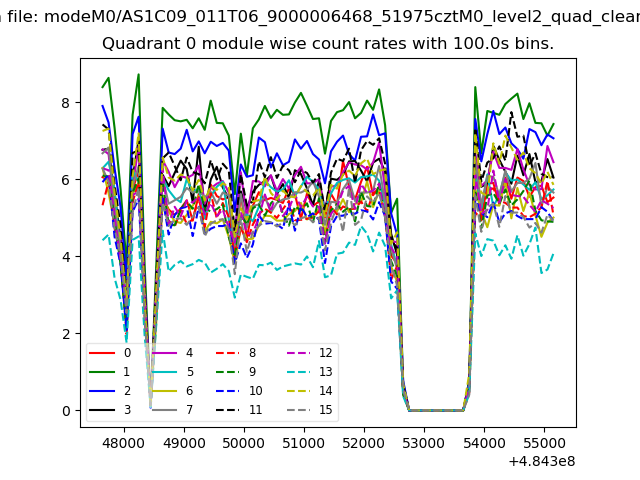 |
 |
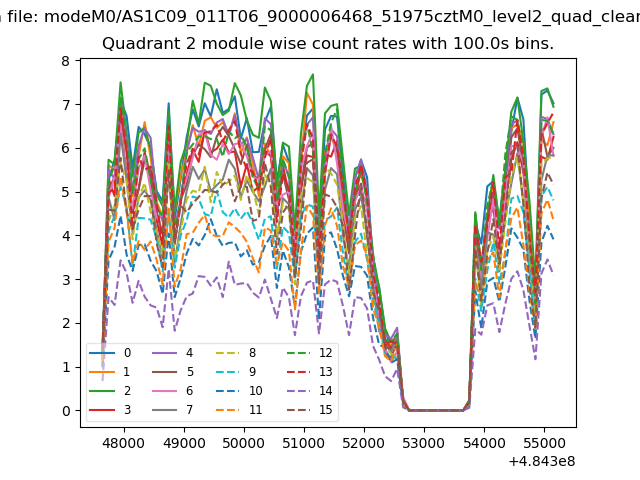
| Module-wise count rates for Quadrant B Data is divided into 100 sec bins |
 |
 |
| Module-wise count rates for Quadrant C Data is divided into 100 sec bins |
 |
 |
| Module-wise count rates for Quadrant D Data is divided into 100 sec bins |
 |
 |
| Parameter | Plot |
|---|---|
| CZT HV Monitor | 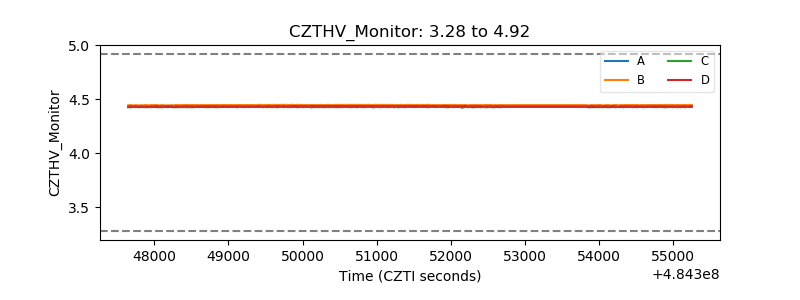 |
| D_VDD | 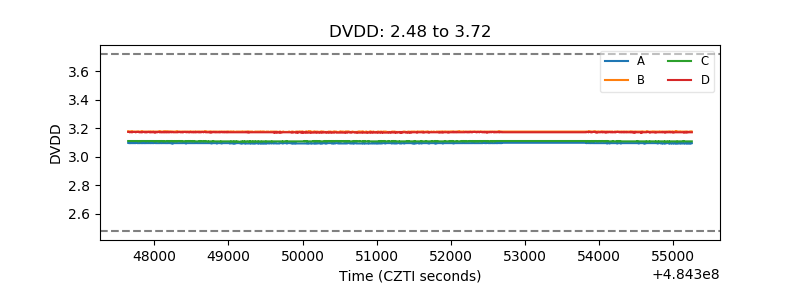 |
| Temperature 1 | 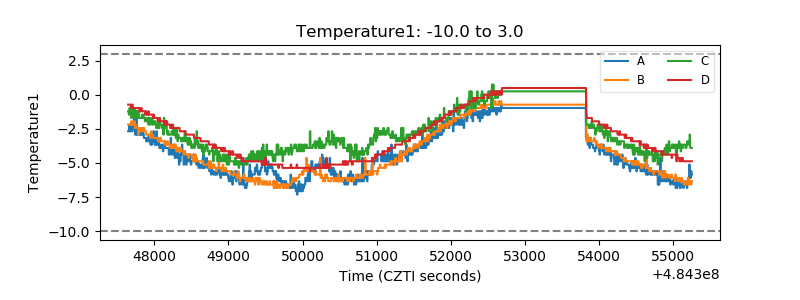 |
| Veto HV Monitor | 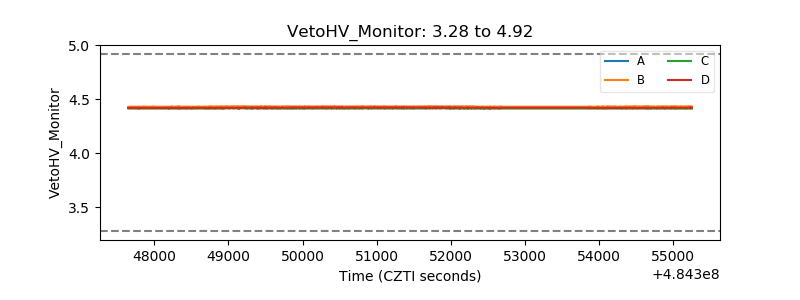 |
| Veto LLD | 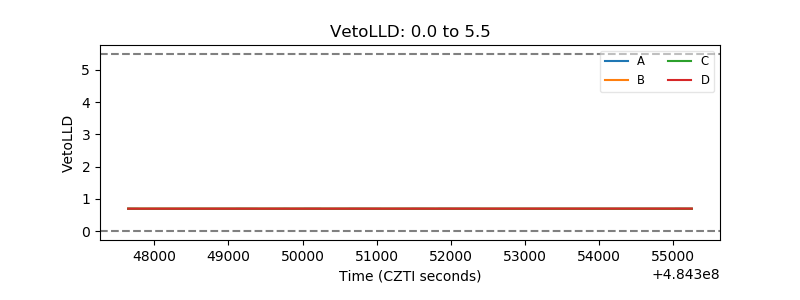 |
| Alpha Counter | 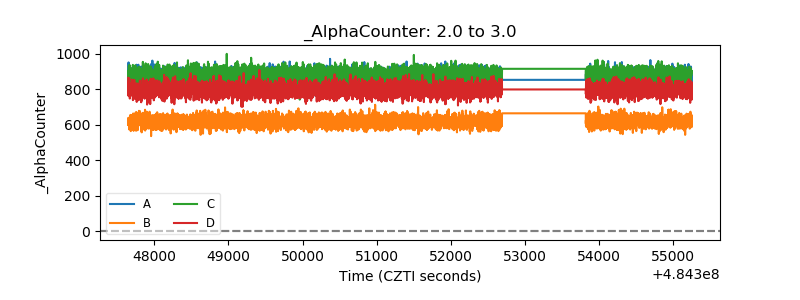 |
| _CPM_Rate | 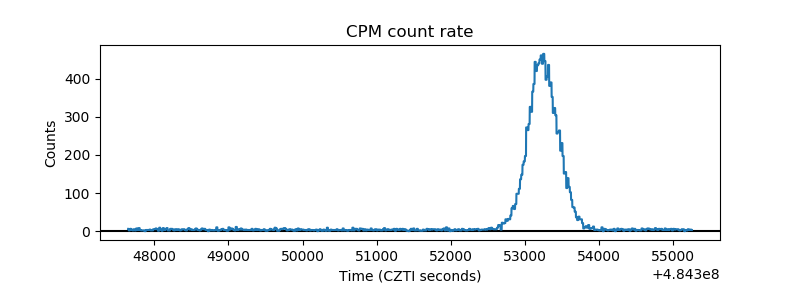 |
| CZT Counter | 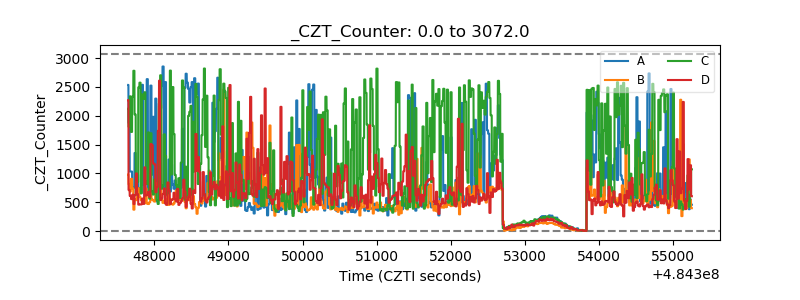 |
| +2.5 Volts monitor | 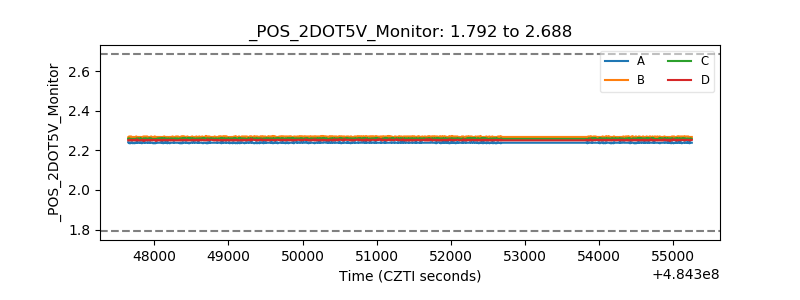 |
| +5 Volts monitor |  |
| _ROLL_ROT | 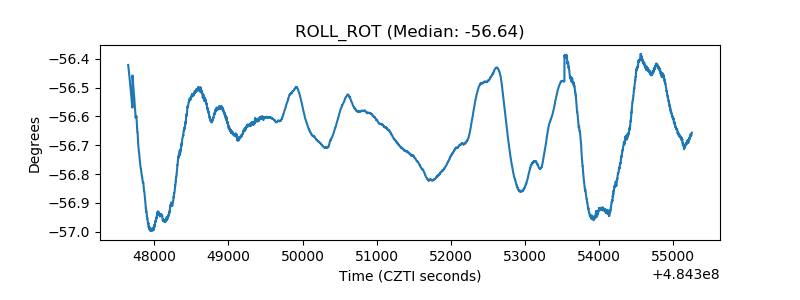 |
| _Roll_DEC | 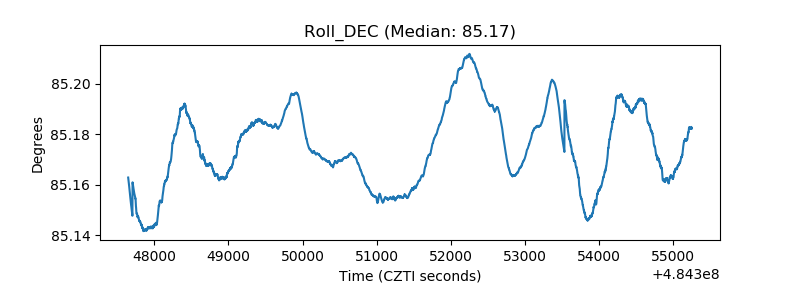 |
| _Roll_RA | 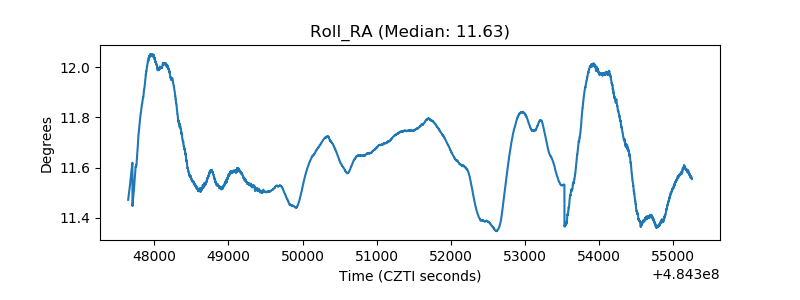 |
| Veto Counter | 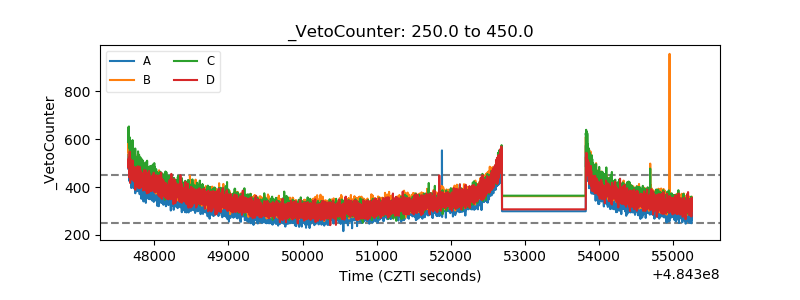 |