| Param | Original file | Final file |
|---|---|---|
| Filename | modeM0/AS1C09_011T06_9000006468_51977cztM0_level2.fits | modeM0/AS1C09_011T06_9000006468_51977cztM0_level2_quad_clean.evt |
| Size (bytes) | 794,056,320 | 93,922,560 |
| Size | 757.3 MB | 89.6 MB |
| Events in quadrant A | 5,028,494 | 639,352 |
| Events in quadrant B | 4,620,569 | 710,778 |
| Events in quadrant C | 10,269,373 | 482,413 |
| Events in quadrant D | 8,909,348 | 502,116 |
| Mode M0 | |||
|---|---|---|---|
| Quadrant | BADHDUFLAG | Total packets | Discarded packets |
| A | 0 | 20071 | 1 |
| B | 0 | 19148 | 1 |
| C | 0 | 35664 | 8 |
| D | 0 | 31587 | 1 |
| Mode M9 | |||
|---|---|---|---|
| Quadrant | BADHDUFLAG | Total packets | Discarded packets |
| A | 0 | 6 | 0 |
| B | 0 | 6 | 0 |
| C | 0 | 6 | 0 |
| D | 0 | 6 | 0 |
| Mode SS | |||
|---|---|---|---|
| Quadrant | BADHDUFLAG | Total packets | Discarded packets |
| A | 0 | 148 | 0 |
| B | 0 | 148 | 0 |
| C | 0 | 148 | 0 |
| D | 0 | 148 | 0 |
| Quadrant | Total seconds | Saturated seconds | Saturation percentage |
|---|---|---|---|
| A | 7309 | 500 | 6.840881% |
| B | 7309 | 331 | 4.528663% |
| C | 7308 | 2324 | 31.800766% |
| D | 7309 | 1547 | 21.165686% |
Noise dominated data is calculated using 1-second bins in cleaned event files. If a bin has >2000 counts, and if more than 50% of those come from <1% of pixels, then it is considered to be noise-dominated and hence unusable.
| Quadrant | # 1 sec bins | Bins with >0 counts | Bins with >2000 counts | High rate bins dominated by noise | Noise dominated (total time) | Noise dominated (detector-on time) | Marked lightcurve |
|---|---|---|---|---|---|---|---|
| A | 7914 | 7311 | 378 | 378 | 4.78% | 5.17% | 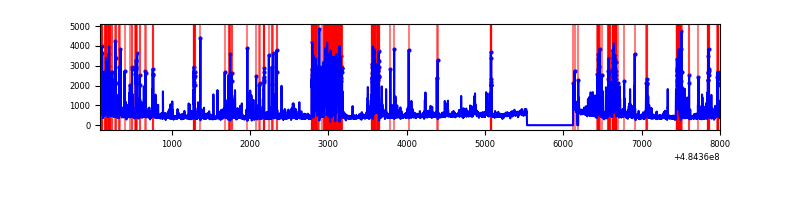 |
| B | 7914 | 7311 | 202 | 202 | 2.55% | 2.76% | 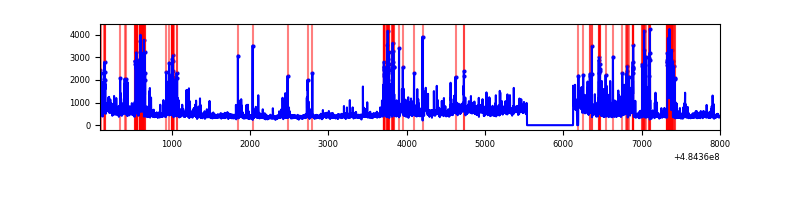 |
| C | 7913 | 7310 | 2032 | 2032 | 25.68% | 27.80% | 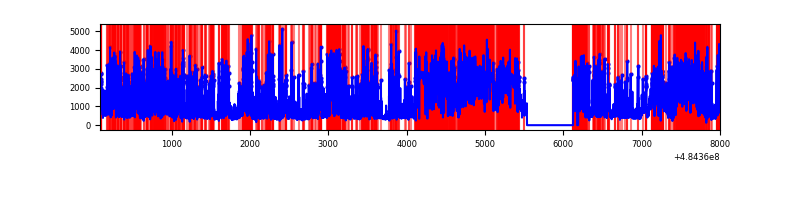 |
| D | 7913 | 7309 | 1367 | 1367 | 17.28% | 18.70% | 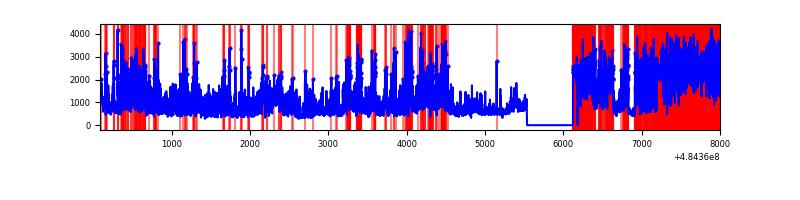 |
Top three noisy pixels from each quadrant. If the there are fewer than three noisy pixels in the level2.evt file, extra rows are filled as -1
| Pixel properties | Quadrant properties | ||||||
|---|---|---|---|---|---|---|---|
| Quadrant | DetID | PixID | Counts | Sigma | Mean | Median | Sigma |
| A | 7 | 64 | 1592655 | 8665.06 | 727 | 708 | 183.7 |
| A | 5 | 240 | 109408 | 591.66 | 727 | 708 | 183.7 |
| A | 4 | 3 | 89772 | 484.78 | 727 | 708 | 183.7 |
| B | 8 | 128 | 384763 | 2492.52 | 737 | 712 | 154.1 |
| B | 10 | 44 | 275244 | 1781.74 | 737 | 712 | 154.1 |
| B | 4 | 81 | 128874 | 831.78 | 737 | 712 | 154.1 |
| C | 15 | 224 | 4719000 | 27836.69 | 610 | 605 | 169.5 |
| C | 12 | 252 | 2376257 | 14015.42 | 610 | 605 | 169.5 |
| C | 13 | 3 | 259568 | 1527.78 | 610 | 605 | 169.5 |
| D | 2 | 172 | 4065371 | 22030.04 | 652 | 625 | 184.5 |
| D | 6 | 42 | 728427 | 3944.53 | 652 | 625 | 184.5 |
| D | 8 | 176 | 387216 | 2095.24 | 652 | 625 | 184.5 |
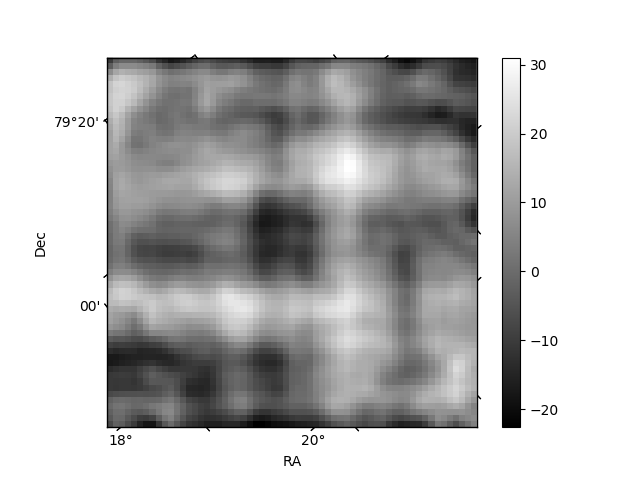
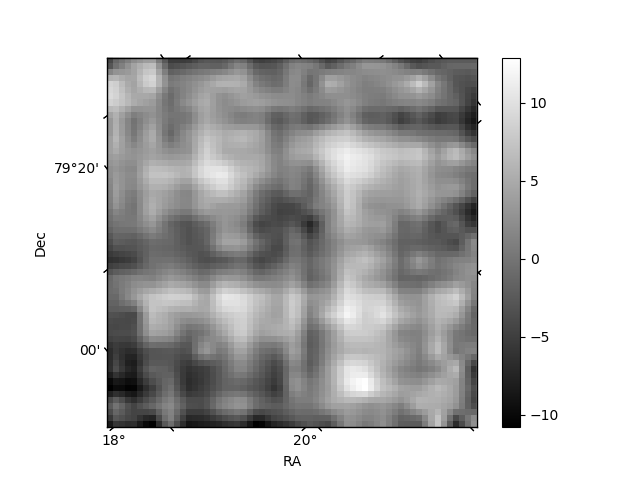
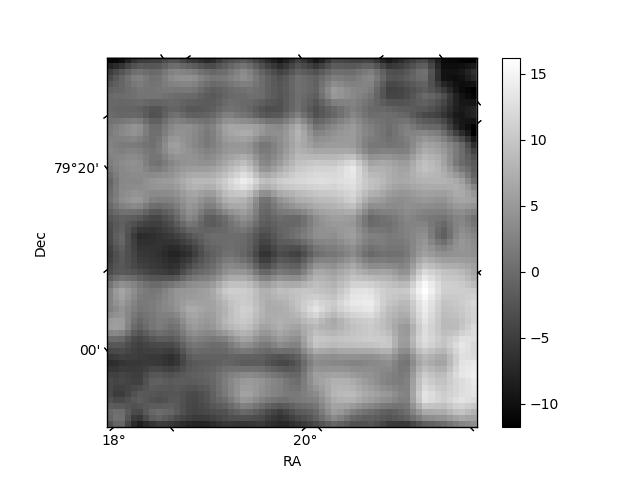
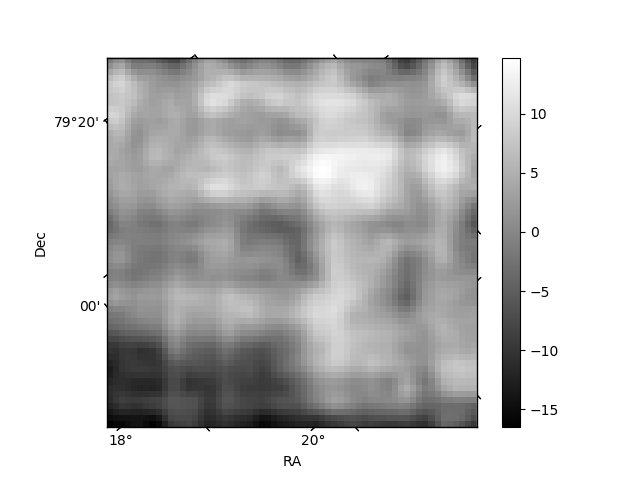
Histogram calculated using DETX and DETY for each event in the final _common_clean file
| Quadrant A | 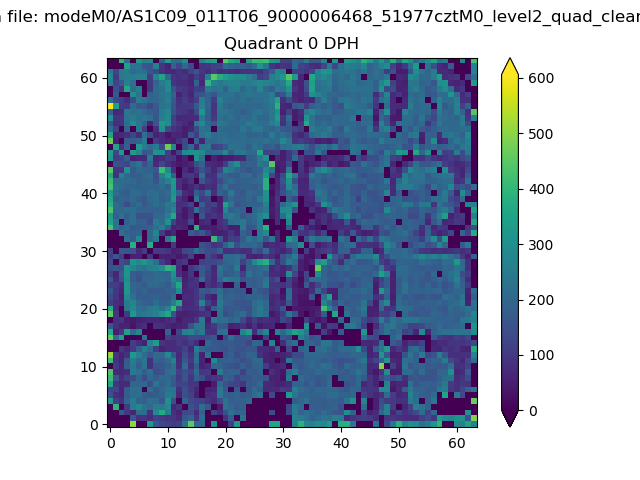 |
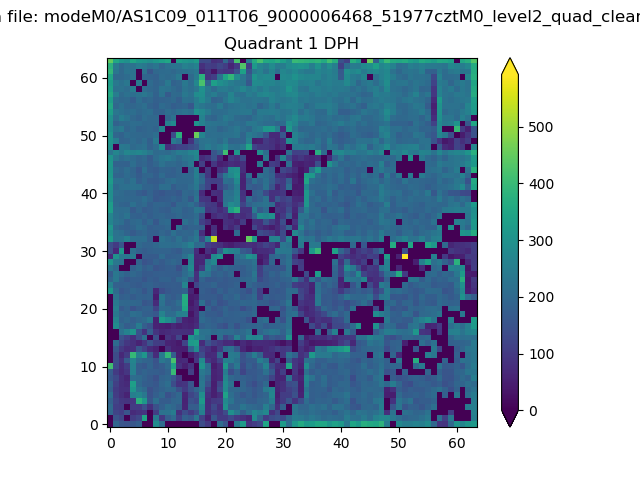 |
Quadrant B |
|---|---|---|---|
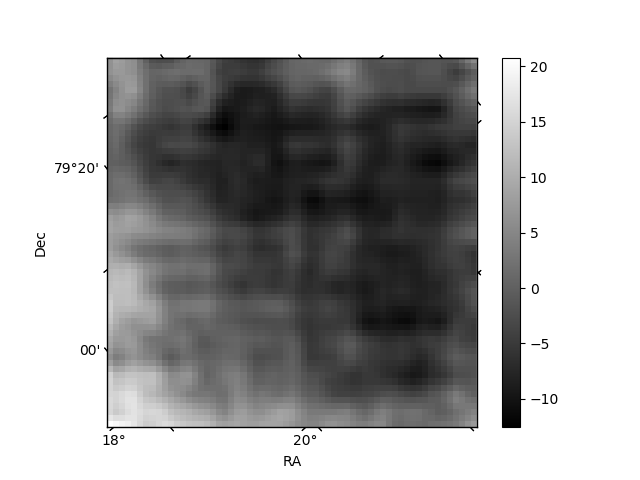
| Quadrant D | 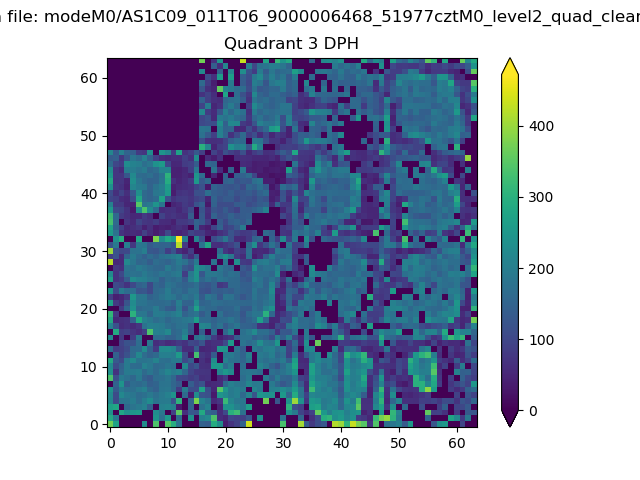 |
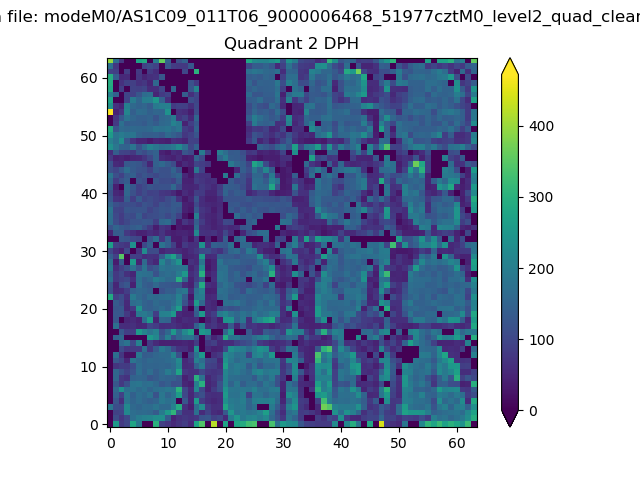 |
Quadrant C |
| Plot type | Count rate plots | Images |
|---|---|---|
| Comparison with Poisson distribution Blue bars denote a histogram of data divided into 1 sec bins. Red curve is a Poisson curve with rate = median count rate of data. |
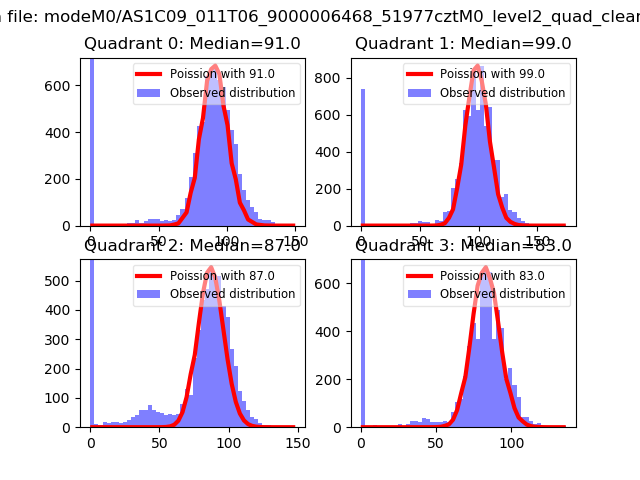 |
 |
| Quadrant-wise count rates Data is divided into 100 sec bins |
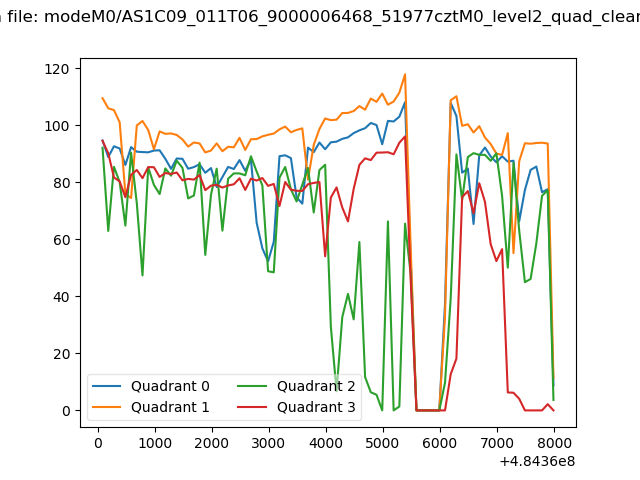 |
|
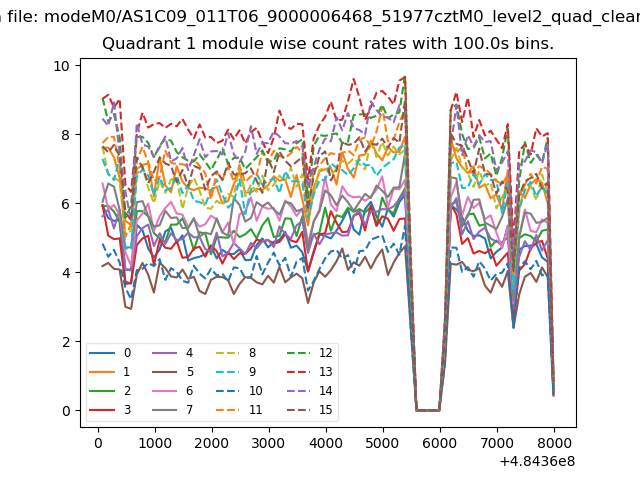
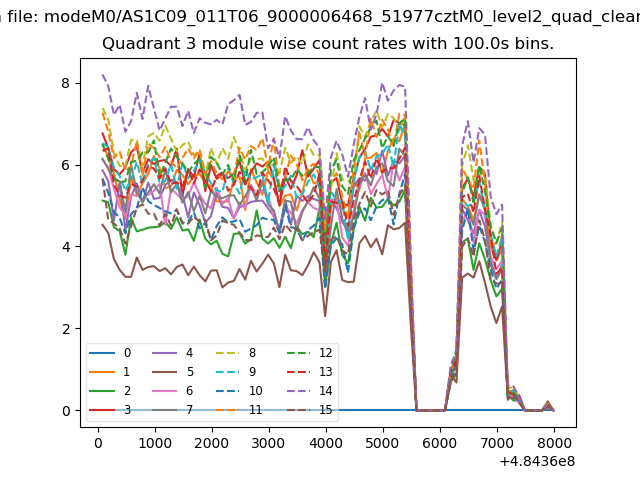
| Module-wise count rates for Quadrant A Data is divided into 100 sec bins |
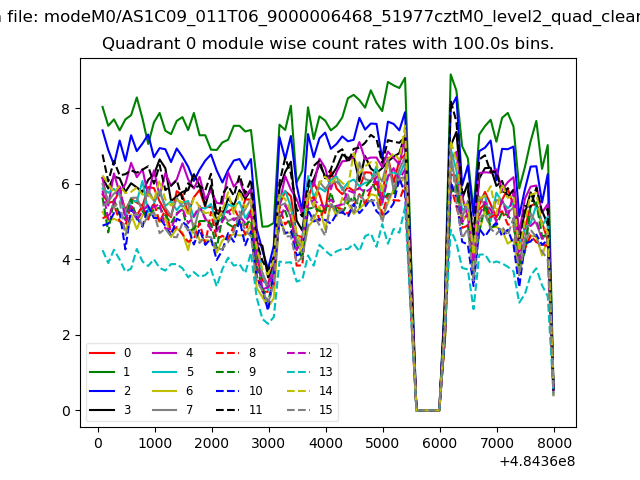 |
 |
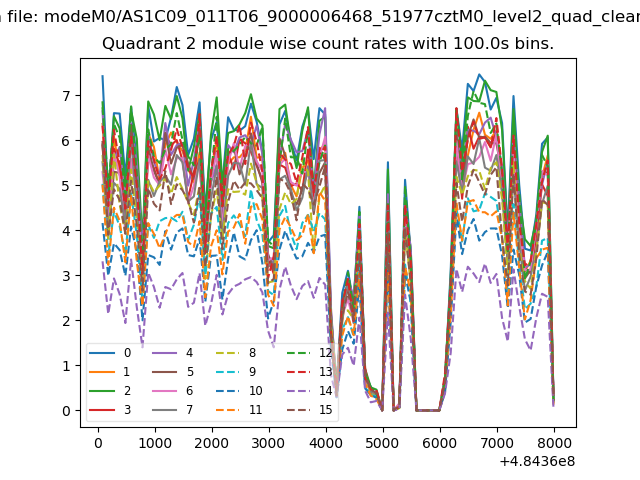
| Module-wise count rates for Quadrant B Data is divided into 100 sec bins |
 |
 |
| Module-wise count rates for Quadrant C Data is divided into 100 sec bins |
 |
 |
| Module-wise count rates for Quadrant D Data is divided into 100 sec bins |
 |
 |
| Parameter | Plot |
|---|---|
| CZT HV Monitor | 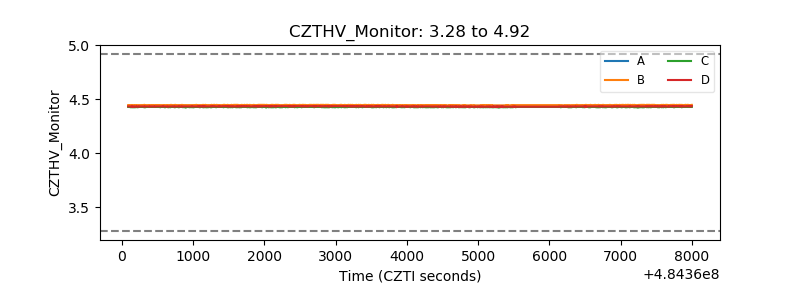 |
| D_VDD | 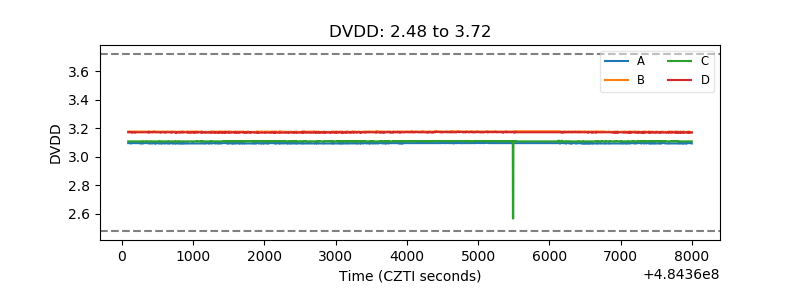 |
| Temperature 1 | 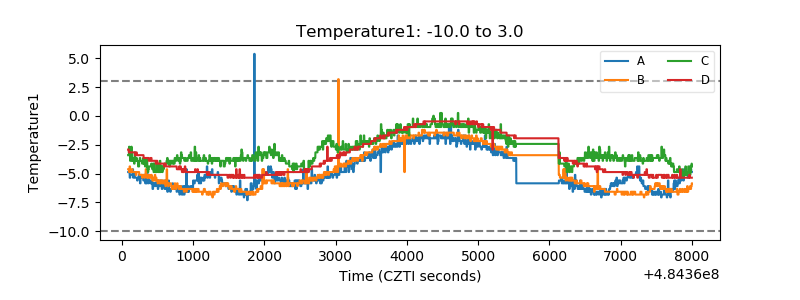 |
| Veto HV Monitor | 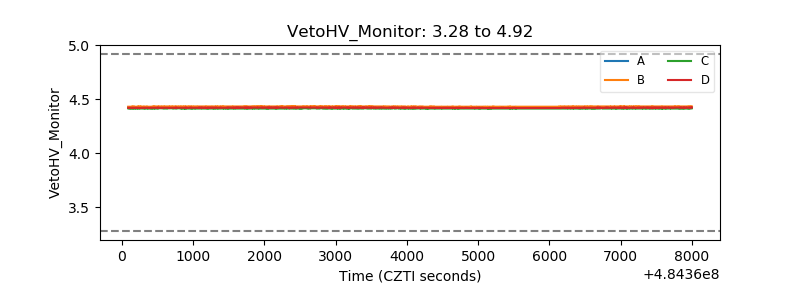 |
| Veto LLD | 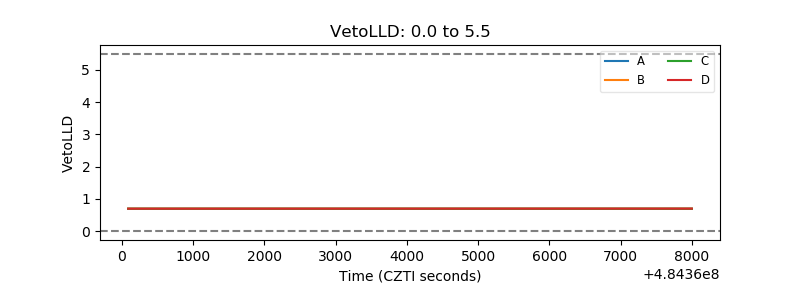 |
| Alpha Counter | 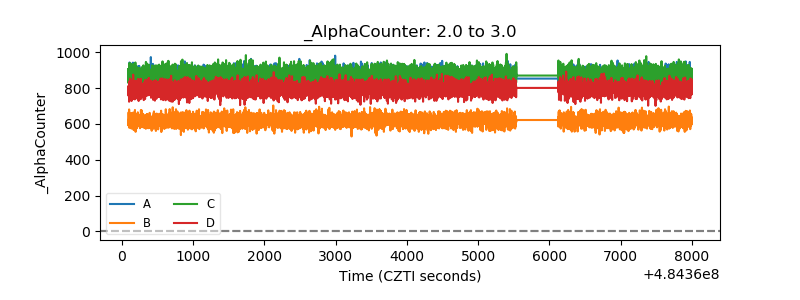 |
| _CPM_Rate | 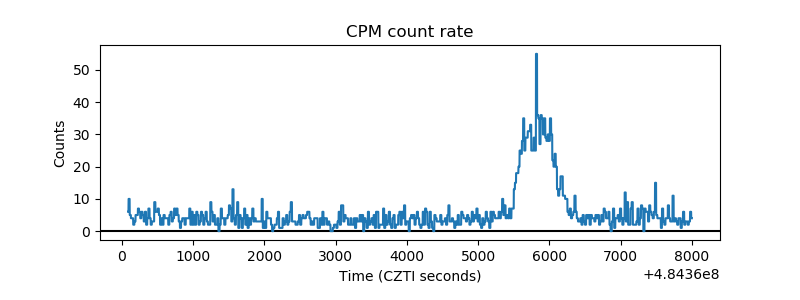 |
| CZT Counter | 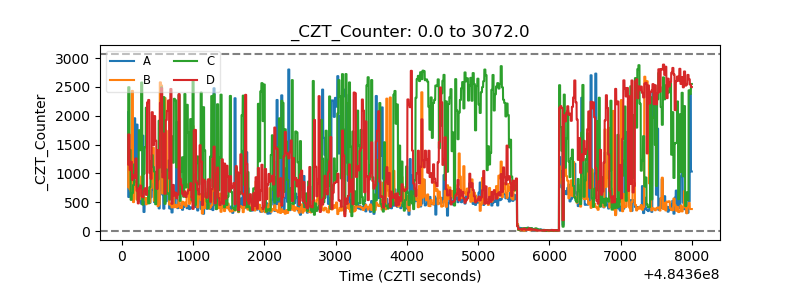 |
| +2.5 Volts monitor | 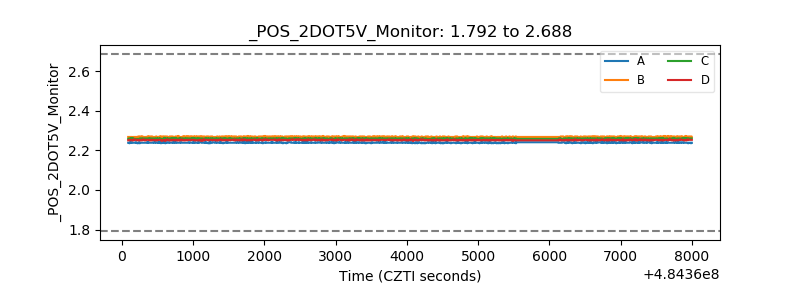 |
| +5 Volts monitor | 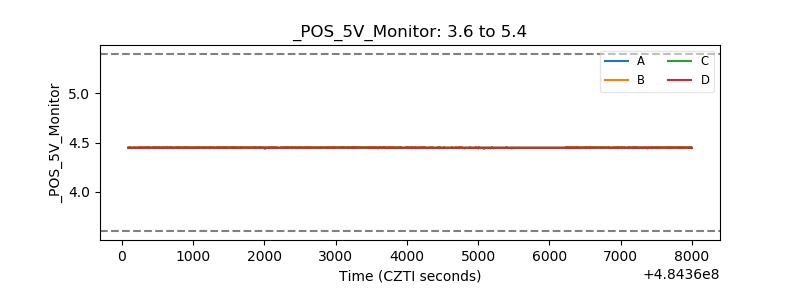 |
| _ROLL_ROT | 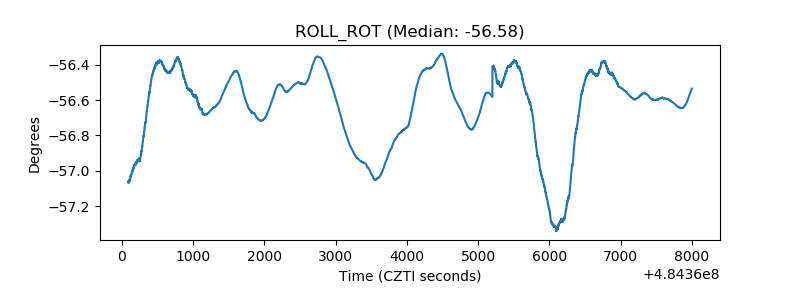 |
| _Roll_DEC | 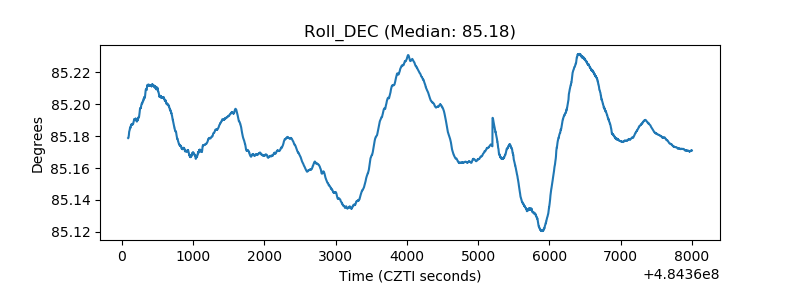 |
| _Roll_RA | 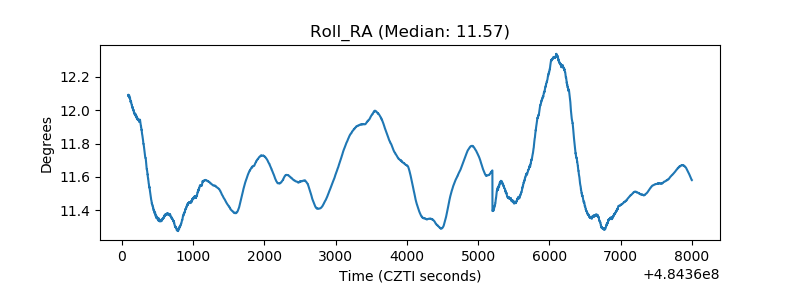 |
| Veto Counter | 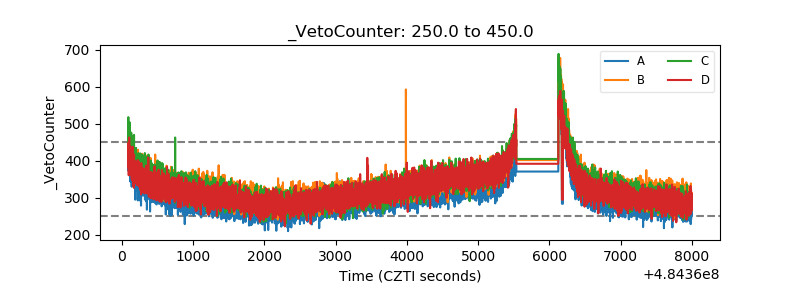 |