| Param | Original file | Final file |
|---|---|---|
| Filename | modeM0/AS1C09_011T06_9000006468_51983cztM0_level2.fits | modeM0/AS1C09_011T06_9000006468_51983cztM0_level2_quad_clean.evt |
| Size (bytes) | 2,358,455,040 | 178,764,480 |
| Size | 2.2 GB | 170.5 MB |
| Events in quadrant A | 14,177,685 | 1,376,795 |
| Events in quadrant B | 15,917,031 | 1,447,795 |
| Events in quadrant C | 18,846,360 | 1,129,775 |
| Events in quadrant D | 37,074,856 | 305,447 |
| Mode M0 | |||
|---|---|---|---|
| Quadrant | BADHDUFLAG | Total packets | Discarded packets |
| A | 0 | 53429 | 4 |
| B | 0 | 58759 | 3 |
| C | 0 | 67640 | 3 |
| D | 0 | 121391 | 3 |
| Mode M9 | |||
|---|---|---|---|
| Quadrant | BADHDUFLAG | Total packets | Discarded packets |
| A | 0 | 6 | 0 |
| B | 0 | 6 | 0 |
| C | 0 | 6 | 0 |
| D | 0 | 6 | 0 |
| Mode SS | |||
|---|---|---|---|
| Quadrant | BADHDUFLAG | Total packets | Discarded packets |
| A | 0 | 336 | 0 |
| B | 0 | 336 | 0 |
| C | 0 | 336 | 0 |
| D | 0 | 336 | 0 |
| Quadrant | Total seconds | Saturated seconds | Saturation percentage |
|---|---|---|---|
| A | 16698 | 1780 | 10.659959% |
| B | 16698 | 2574 | 15.415020% |
| C | 16699 | 4108 | 24.600275% |
| D | 16699 | 13335 | 79.855081% |
Noise dominated data is calculated using 1-second bins in cleaned event files. If a bin has >2000 counts, and if more than 50% of those come from <1% of pixels, then it is considered to be noise-dominated and hence unusable.
| Quadrant | # 1 sec bins | Bins with >0 counts | Bins with >2000 counts | High rate bins dominated by noise | Noise dominated (total time) | Noise dominated (detector-on time) | Marked lightcurve |
|---|---|---|---|---|---|---|---|
| A | 17228 | 16702 | 1234 | 1234 | 7.16% | 7.39% | 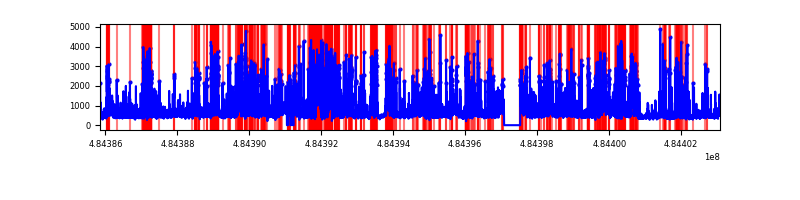 |
| B | 17227 | 16699 | 1594 | 1594 | 9.25% | 9.55% |  |
| C | 17229 | 16702 | 3525 | 3525 | 20.46% | 21.11% | 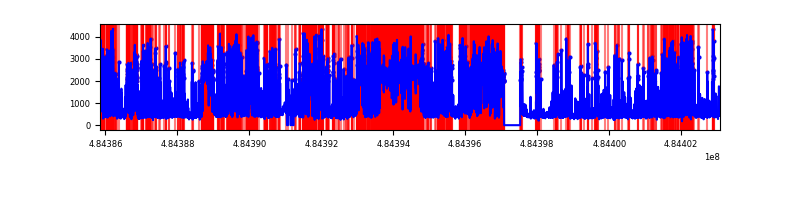 |
| D | 17228 | 16698 | 12687 | 12687 | 73.64% | 75.98% | 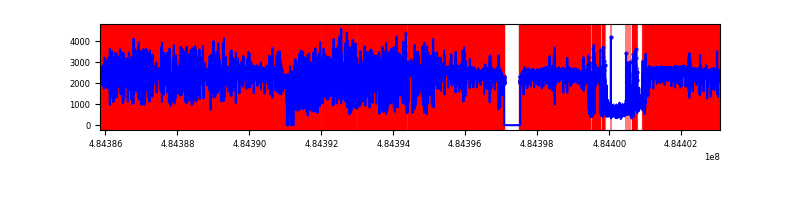 |
Top three noisy pixels from each quadrant. If the there are fewer than three noisy pixels in the level2.evt file, extra rows are filled as -1
| Pixel properties | Quadrant properties | ||||||
|---|---|---|---|---|---|---|---|
| Quadrant | DetID | PixID | Counts | Sigma | Mean | Median | Sigma |
| A | 7 | 64 | 4743950 | 11301.35 | 1679 | 1636 | 419.6 |
| A | 4 | 95 | 487907 | 1158.82 | 1679 | 1636 | 419.6 |
| A | 4 | 3 | 329510 | 781.35 | 1679 | 1636 | 419.6 |
| B | 4 | 206 | 2742456 | 7867.44 | 1641 | 1583 | 348.4 |
| B | 12 | 32 | 1746102 | 5007.49 | 1641 | 1583 | 348.4 |
| B | 8 | 128 | 1121238 | 3213.87 | 1641 | 1583 | 348.4 |
| C | 13 | 3 | 6284744 | 15242.12 | 1489 | 1476 | 412.2 |
| C | 15 | 224 | 4891414 | 11862.15 | 1489 | 1476 | 412.2 |
| C | 15 | 147 | 665689 | 1611.27 | 1489 | 1476 | 412.2 |
| D | 2 | 172 | 22692972 | 95042.42 | 826 | 787 | 238.8 |
| D | 7 | 126 | 4041306 | 16923.04 | 826 | 787 | 238.8 |
| D | 12 | 17 | 3058888 | 12808.34 | 826 | 787 | 238.8 |
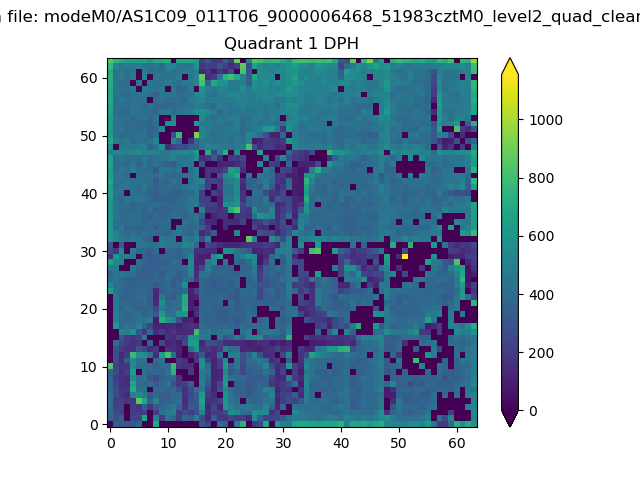
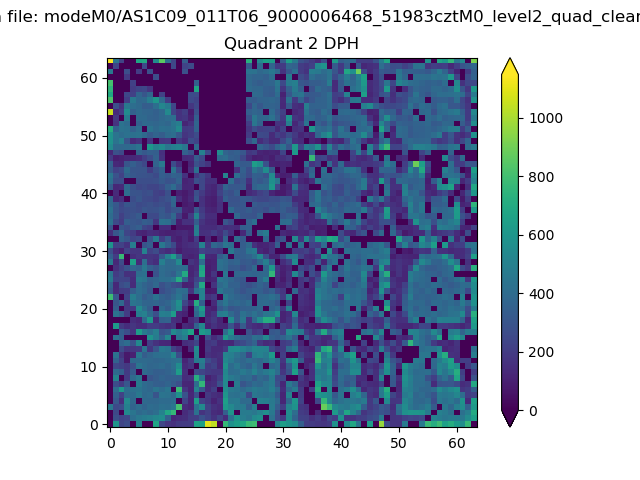
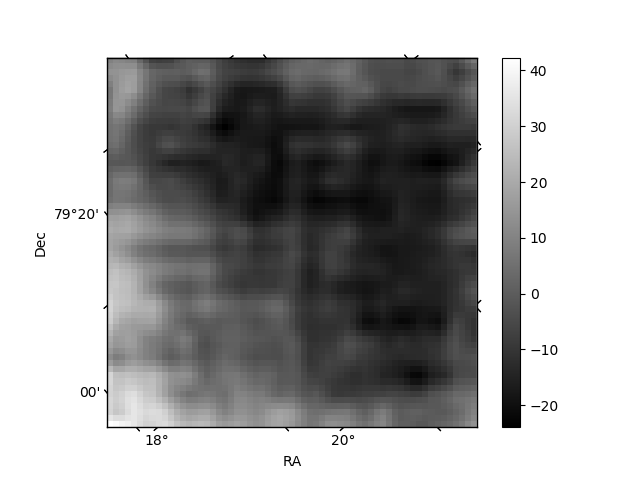
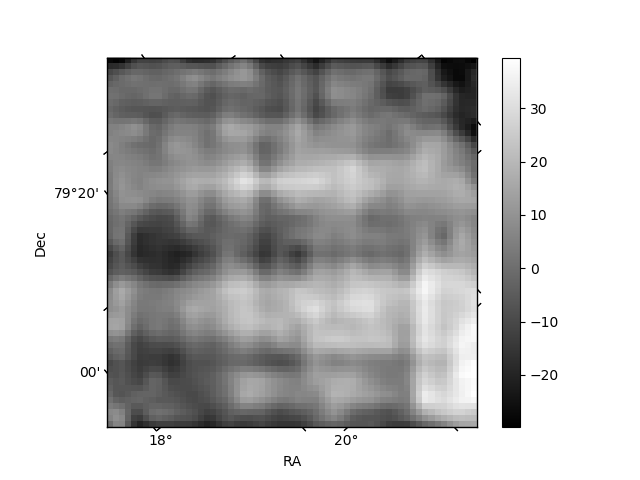
Histogram calculated using DETX and DETY for each event in the final _common_clean file
| Quadrant A |  |
 |
Quadrant B |
|---|---|---|---|
| Quadrant D | 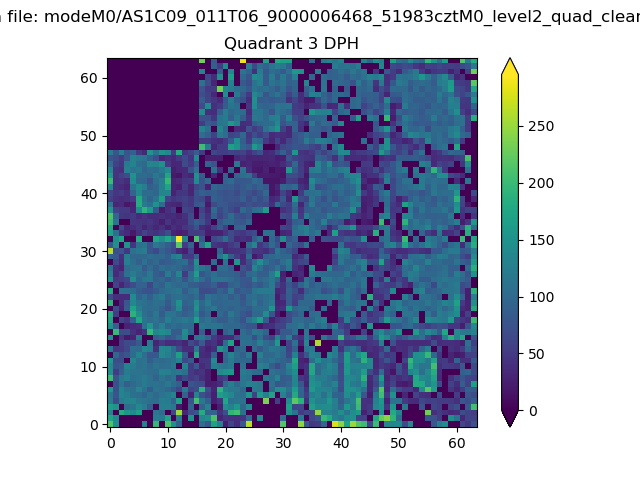 |
 |
Quadrant C |
| Plot type | Count rate plots | Images |
|---|---|---|
| Comparison with Poisson distribution Blue bars denote a histogram of data divided into 1 sec bins. Red curve is a Poisson curve with rate = median count rate of data. |
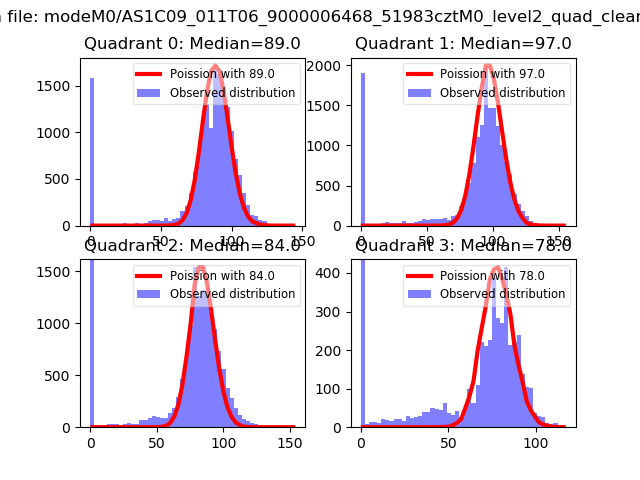 |
 |
| Quadrant-wise count rates Data is divided into 100 sec bins |
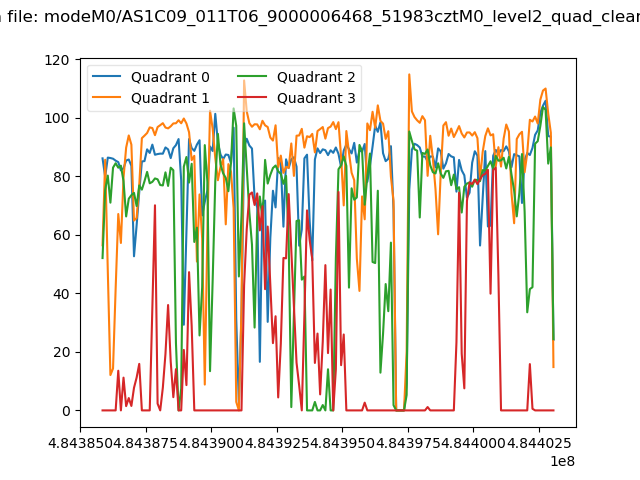 |
|
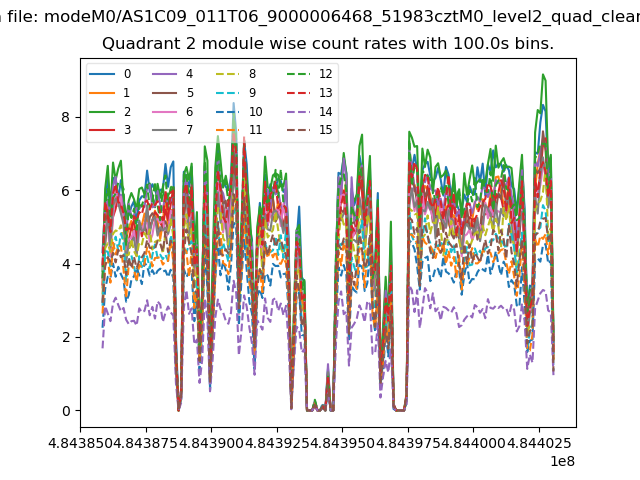
| Module-wise count rates for Quadrant A Data is divided into 100 sec bins |
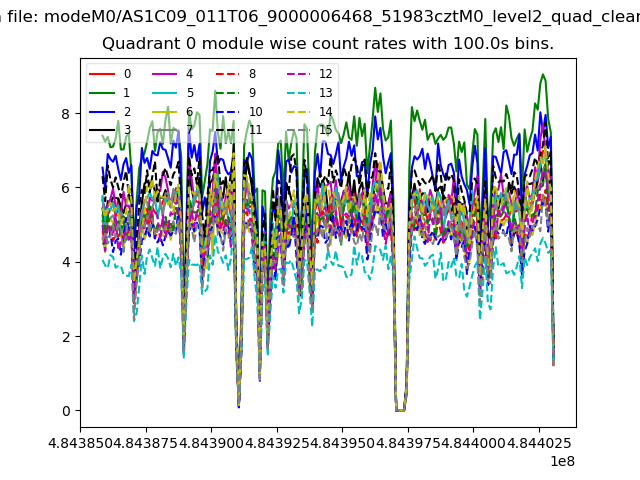 |
 |
| Module-wise count rates for Quadrant B Data is divided into 100 sec bins |
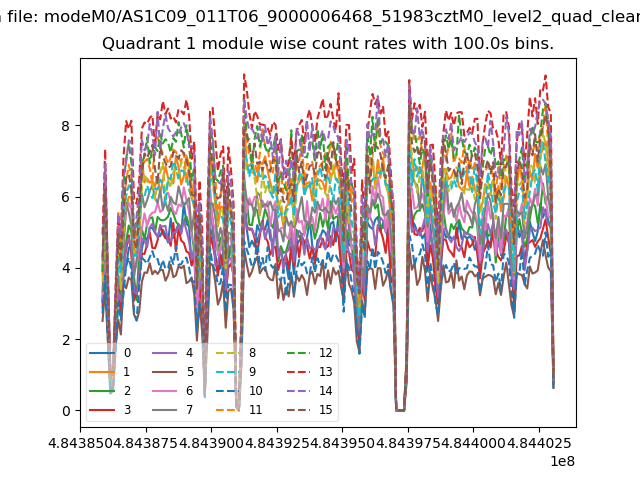 |
 |
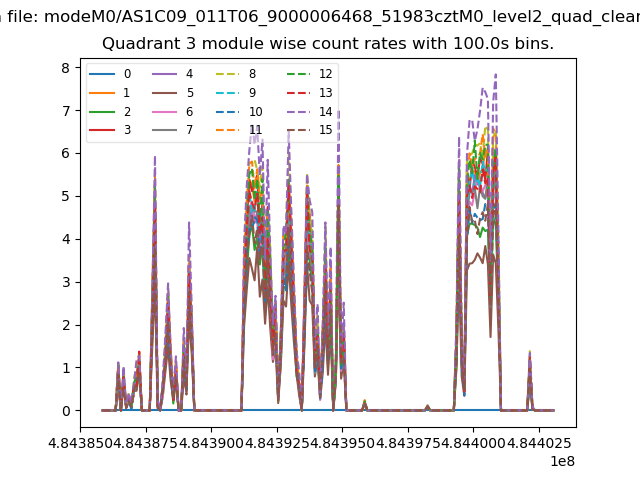
| Module-wise count rates for Quadrant C Data is divided into 100 sec bins |
 |
 |
| Module-wise count rates for Quadrant D Data is divided into 100 sec bins |
 |
 |
| Parameter | Plot |
|---|---|
| CZT HV Monitor | 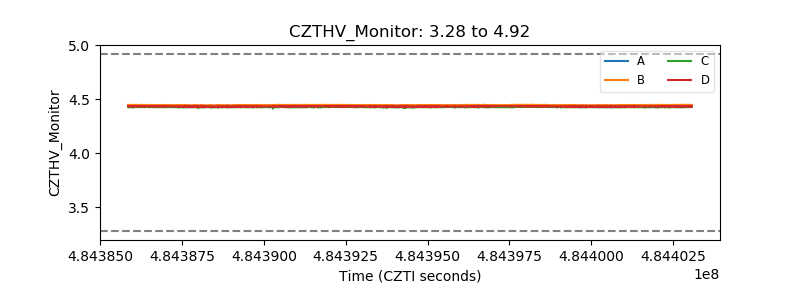 |
| D_VDD | 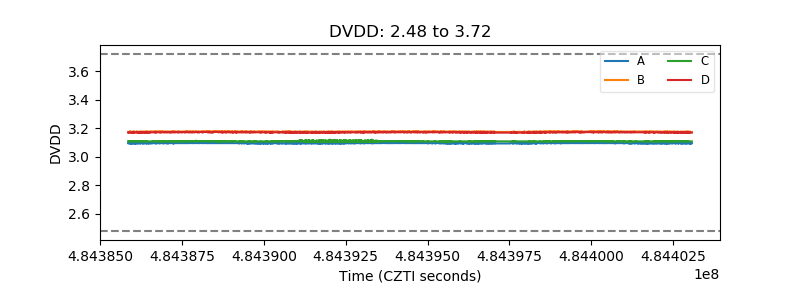 |
| Temperature 1 | 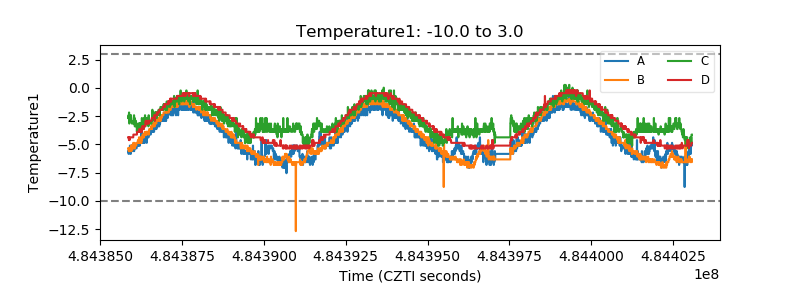 |
| Veto HV Monitor | 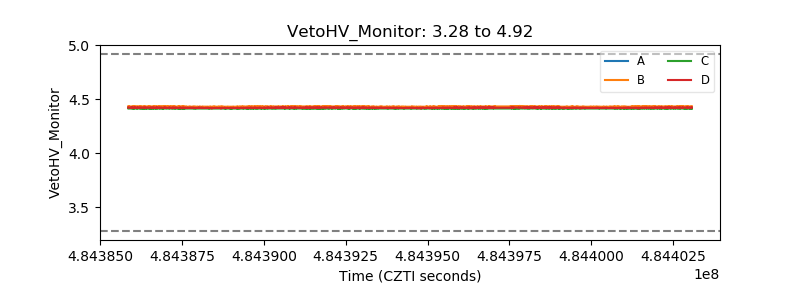 |
| Veto LLD | 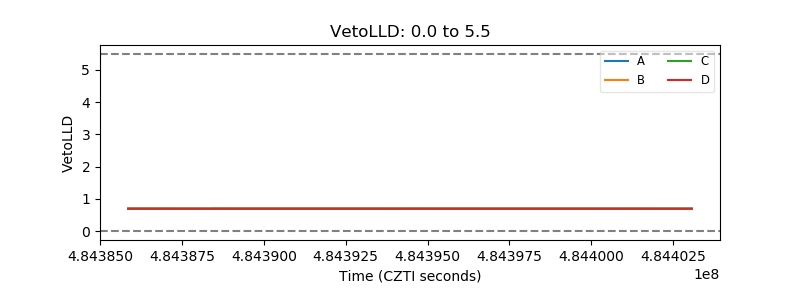 |
| Alpha Counter | 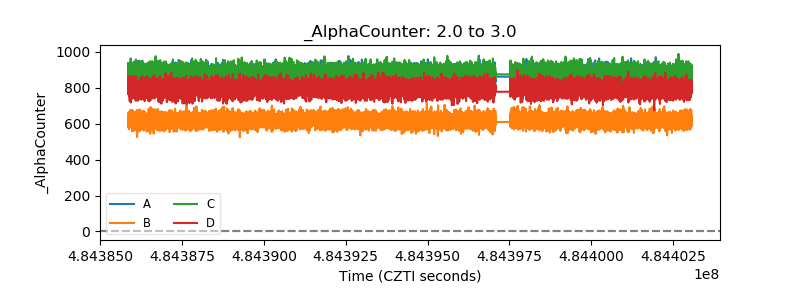 |
| _CPM_Rate | 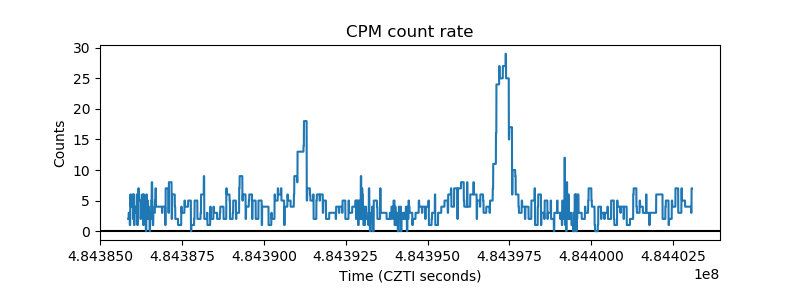 |
| CZT Counter | 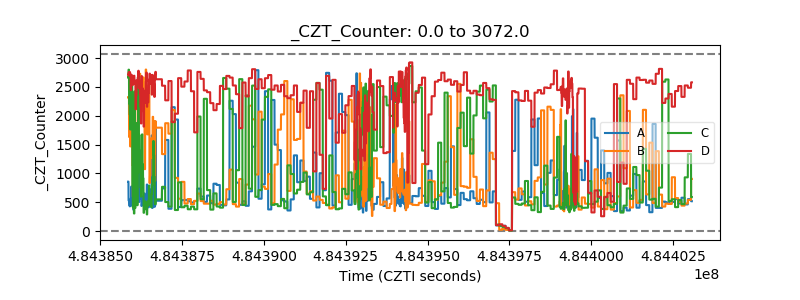 |
| +2.5 Volts monitor | 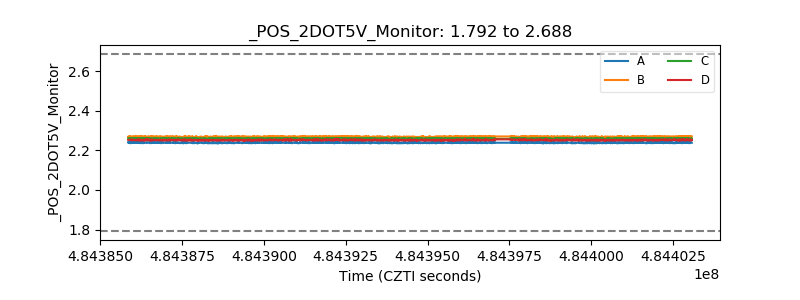 |
| +5 Volts monitor | 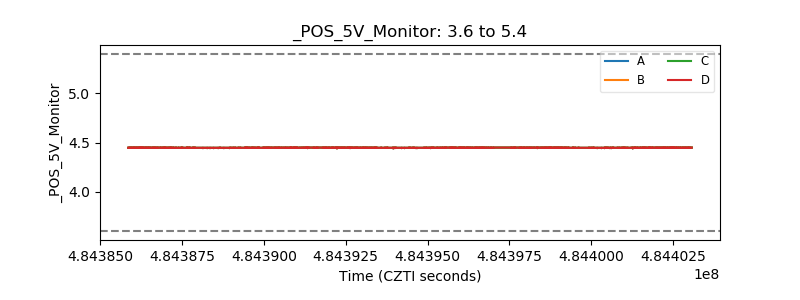 |
| _ROLL_ROT | 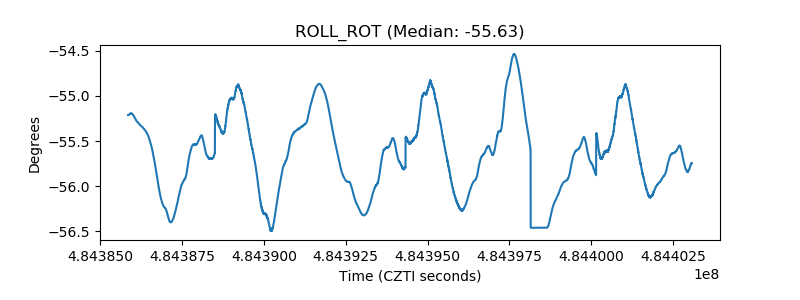 |
| _Roll_DEC | 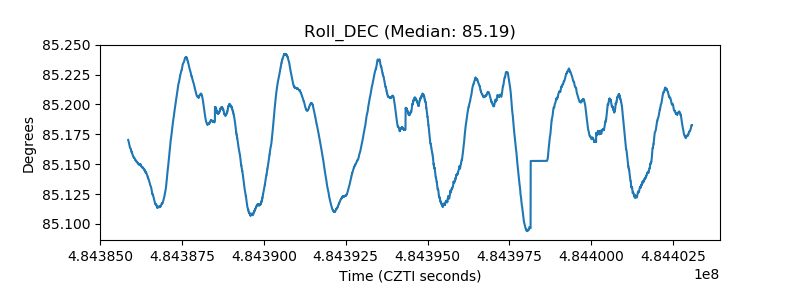 |
| _Roll_RA | 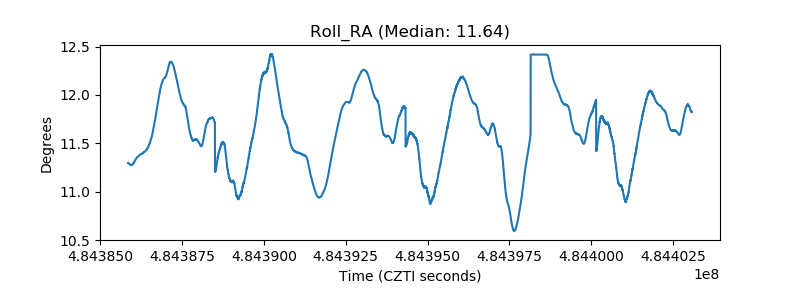 |
| Veto Counter | 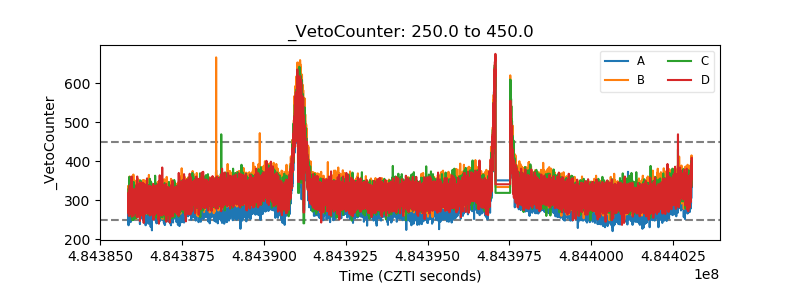 |