| Param | Original file | Final file |
|---|---|---|
| Filename | modeM0/AS1C09_011T06_9000006468_51986cztM0_level2.fits | modeM0/AS1C09_011T06_9000006468_51986cztM0_level2_quad_clean.evt |
| Size (bytes) | 896,103,360 | 70,655,040 |
| Size | 854.6 MB | 67.4 MB |
| Events in quadrant A | 7,884,711 | 438,915 |
| Events in quadrant B | 5,980,039 | 594,001 |
| Events in quadrant C | 5,263,431 | 518,282 |
| Events in quadrant D | 13,566,193 | 157,024 |
| Mode M0 | |||
|---|---|---|---|
| Quadrant | BADHDUFLAG | Total packets | Discarded packets |
| A | 0 | 27693 | 1 |
| B | 0 | 22097 | 1 |
| C | 0 | 19934 | 1 |
| D | 0 | 44494 | 7 |
| Mode M9 | |||
|---|---|---|---|
| Quadrant | BADHDUFLAG | Total packets | Discarded packets |
| A | 0 | 10 | 0 |
| B | 0 | 10 | 0 |
| C | 0 | 10 | 0 |
| D | 0 | 10 | 0 |
| Mode SS | |||
|---|---|---|---|
| Quadrant | BADHDUFLAG | Total packets | Discarded packets |
| A | 0 | 126 | 0 |
| B | 0 | 126 | 0 |
| C | 0 | 126 | 0 |
| D | 0 | 126 | 0 |
| Quadrant | Total seconds | Saturated seconds | Saturation percentage |
|---|---|---|---|
| A | 6165 | 1790 | 29.034874% |
| B | 6166 | 591 | 9.584820% |
| C | 6166 | 692 | 11.222835% |
| D | 6165 | 4534 | 73.544201% |
Noise dominated data is calculated using 1-second bins in cleaned event files. If a bin has >2000 counts, and if more than 50% of those come from <1% of pixels, then it is considered to be noise-dominated and hence unusable.
| Quadrant | # 1 sec bins | Bins with >0 counts | Bins with >2000 counts | High rate bins dominated by noise | Noise dominated (total time) | Noise dominated (detector-on time) | Marked lightcurve |
|---|---|---|---|---|---|---|---|
| A | 7175 | 6166 | 1514 | 1514 | 21.10% | 24.55% | 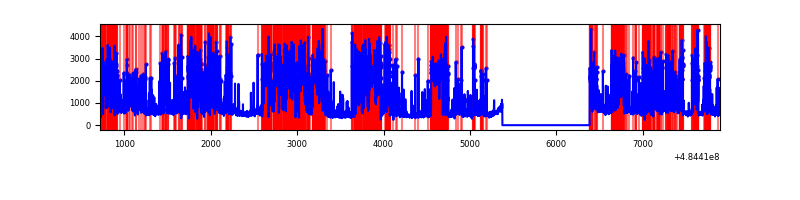 |
| B | 7176 | 6167 | 429 | 429 | 5.98% | 6.96% | 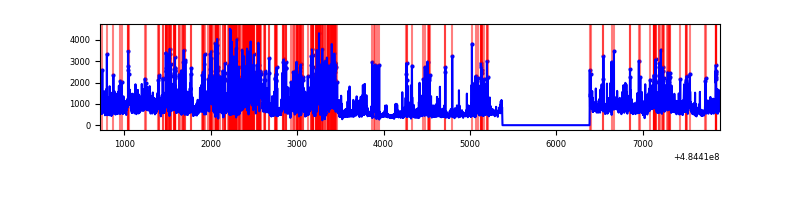 |
| C | 7176 | 6167 | 523 | 523 | 7.29% | 8.48% | 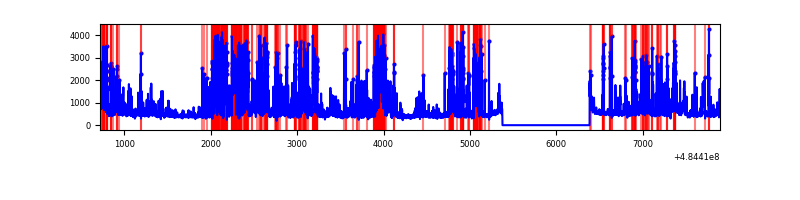 |
| D | 7174 | 6164 | 4295 | 4295 | 59.87% | 69.68% | 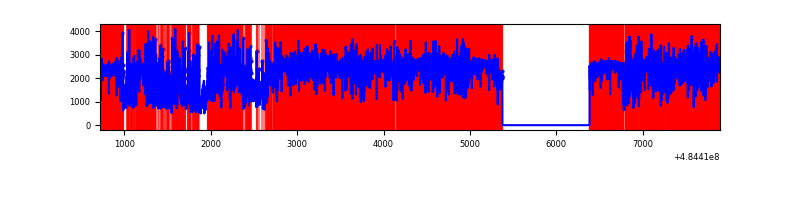 |
Top three noisy pixels from each quadrant. If the there are fewer than three noisy pixels in the level2.evt file, extra rows are filled as -1
| Pixel properties | Quadrant properties | ||||||
|---|---|---|---|---|---|---|---|
| Quadrant | DetID | PixID | Counts | Sigma | Mean | Median | Sigma |
| A | 7 | 64 | 4369028 | 31041.26 | 561 | 547 | 140.7 |
| A | 7 | 174 | 269925 | 1914.13 | 561 | 547 | 140.7 |
| A | 13 | 248 | 162327 | 1149.57 | 561 | 547 | 140.7 |
| B | 10 | 128 | 1765489 | 13269.42 | 630 | 609 | 133.0 |
| B | 4 | 206 | 322226 | 2418.11 | 630 | 609 | 133.0 |
| B | 4 | 81 | 294622 | 2210.56 | 630 | 609 | 133.0 |
| C | 15 | 224 | 1729603 | 10103.46 | 612 | 606 | 171.1 |
| C | 13 | 3 | 600654 | 3506.4 | 612 | 606 | 171.1 |
| C | 1 | 109 | 114751 | 667.01 | 612 | 606 | 171.1 |
| D | 2 | 172 | 4713263 | 39804.1 | 413 | 396 | 118.4 |
| D | 6 | 42 | 2565905 | 21667.86 | 413 | 396 | 118.4 |
| D | 12 | 17 | 1888452 | 15946.21 | 413 | 396 | 118.4 |
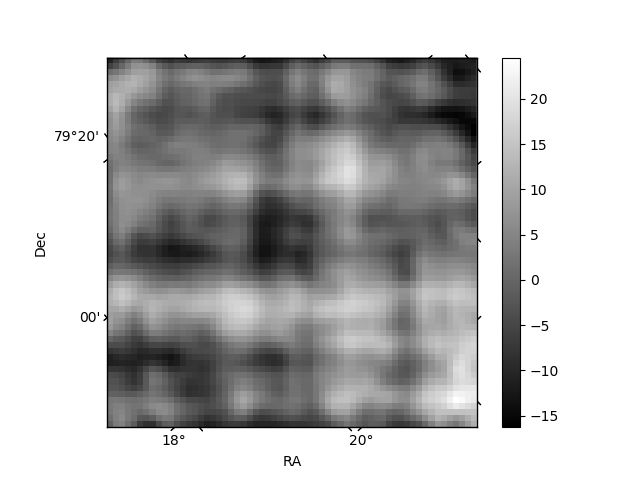
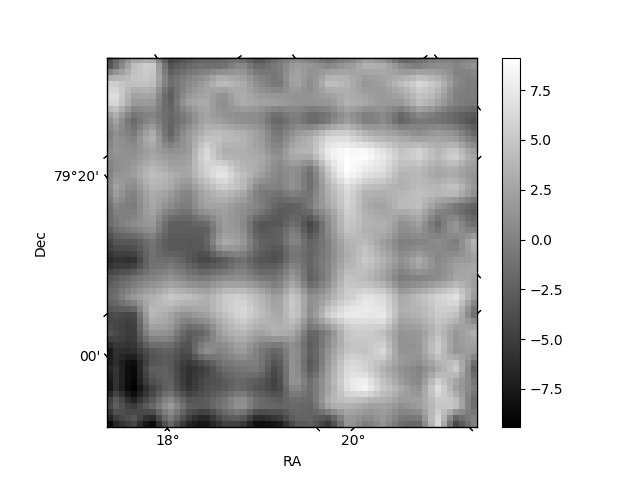
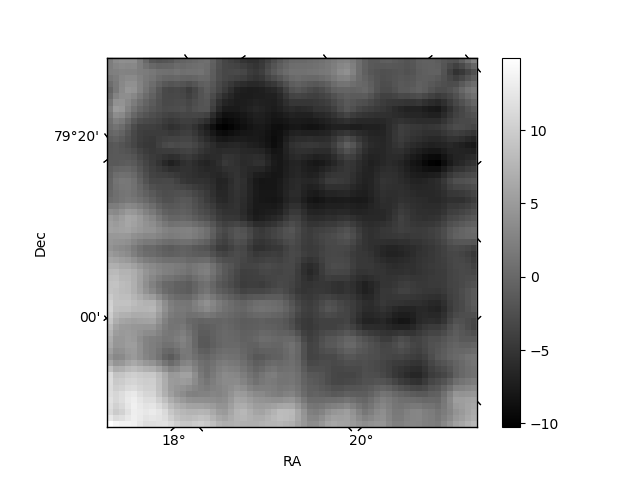
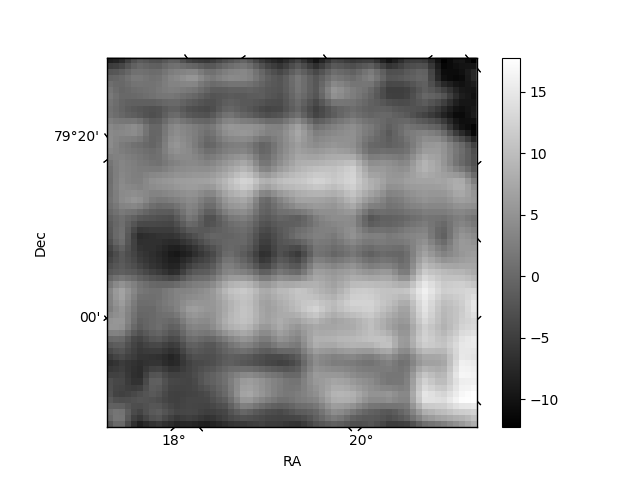
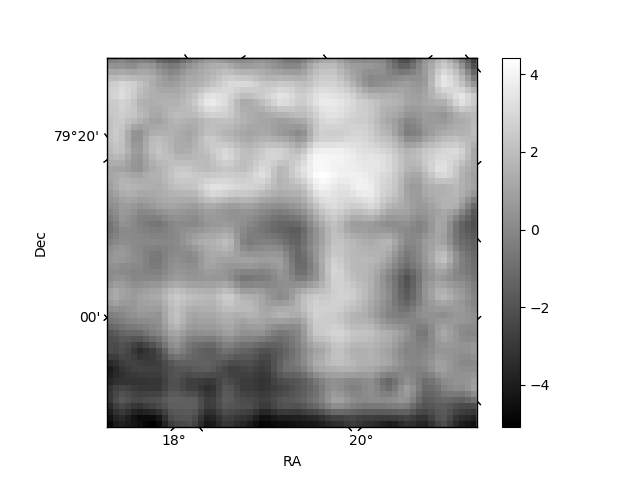
Histogram calculated using DETX and DETY for each event in the final _common_clean file
| Quadrant A | 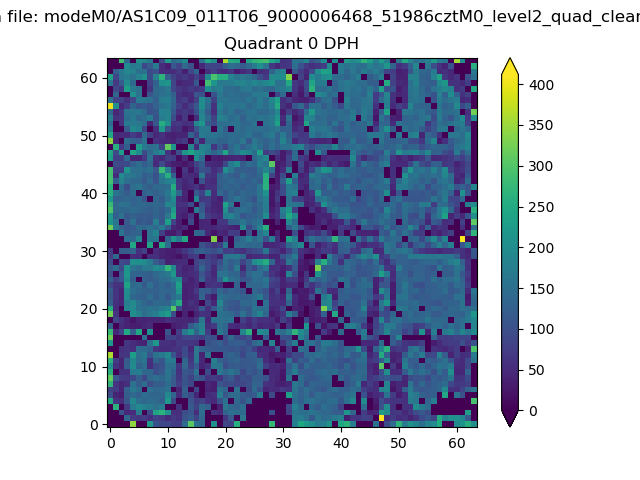 |
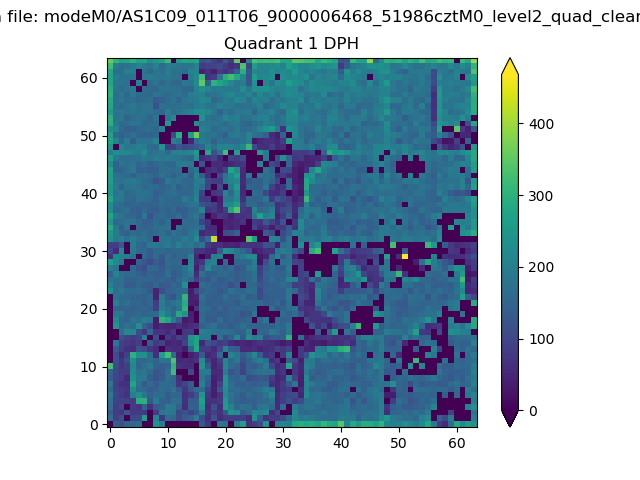 |
Quadrant B |
|---|---|---|---|
| Quadrant D | 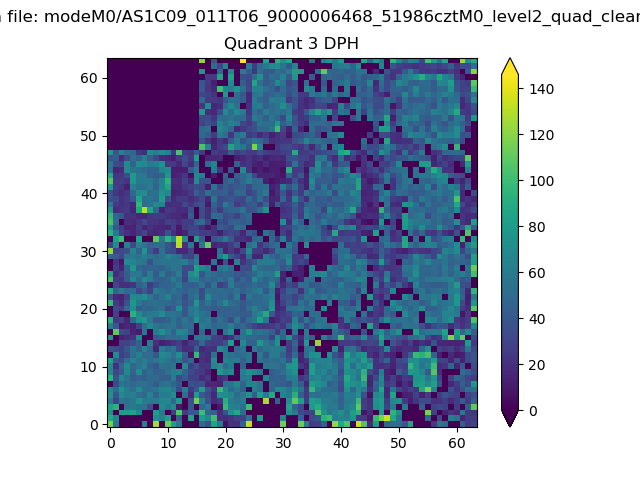 |
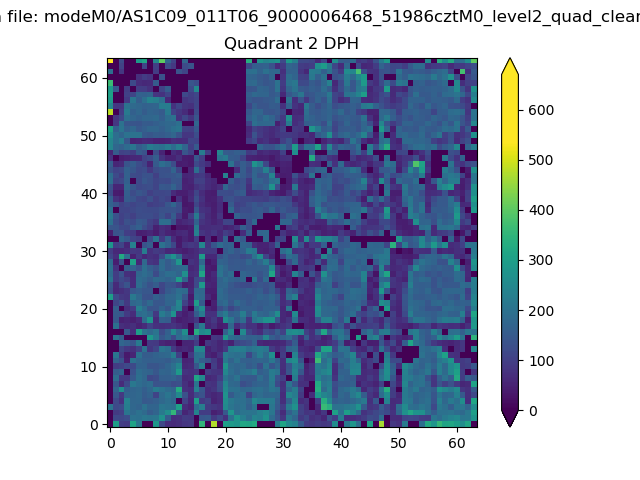 |
Quadrant C |
| Plot type | Count rate plots | Images |
|---|---|---|
| Comparison with Poisson distribution Blue bars denote a histogram of data divided into 1 sec bins. Red curve is a Poisson curve with rate = median count rate of data. |
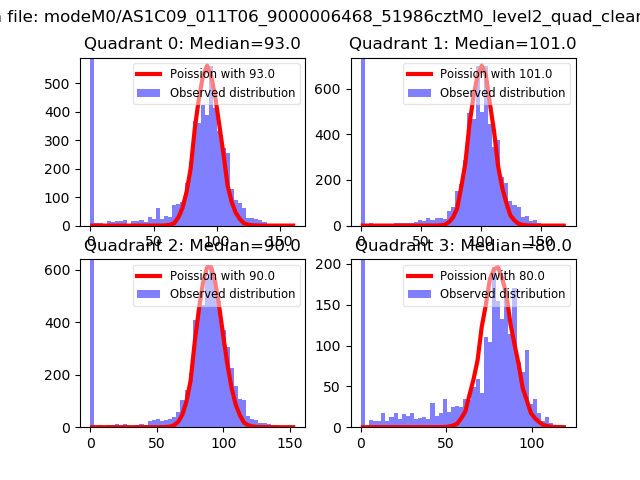 |
 |
| Quadrant-wise count rates Data is divided into 100 sec bins |
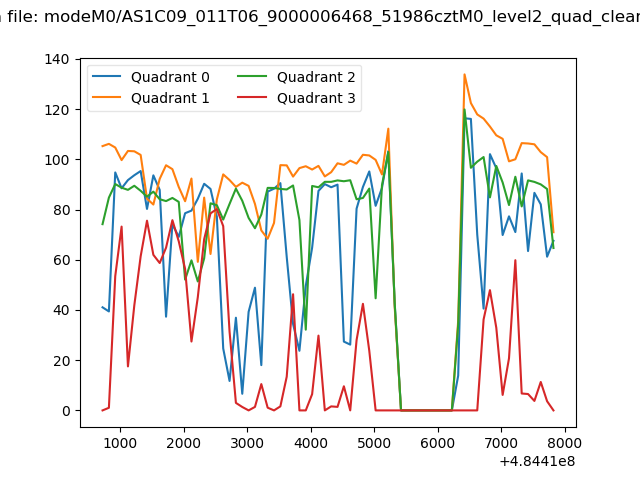 |
|
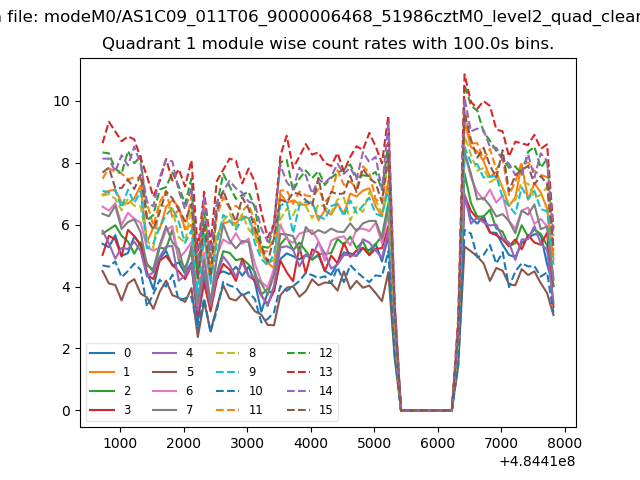
| Module-wise count rates for Quadrant A Data is divided into 100 sec bins |
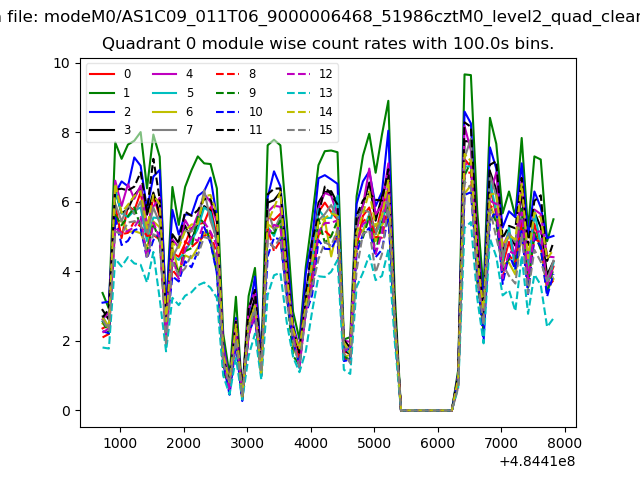 |
 |
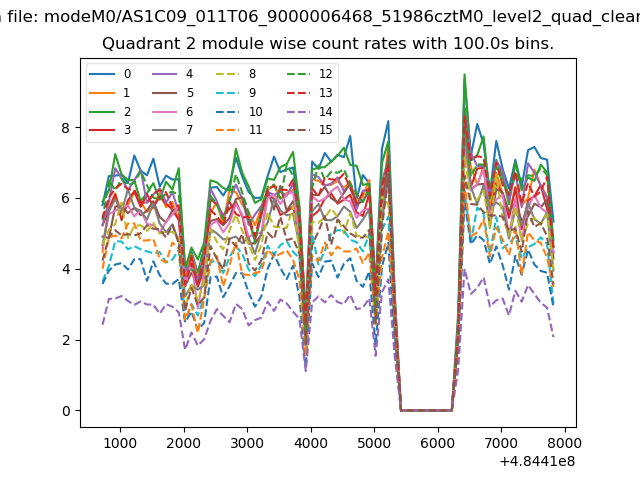
| Module-wise count rates for Quadrant B Data is divided into 100 sec bins |
 |
 |
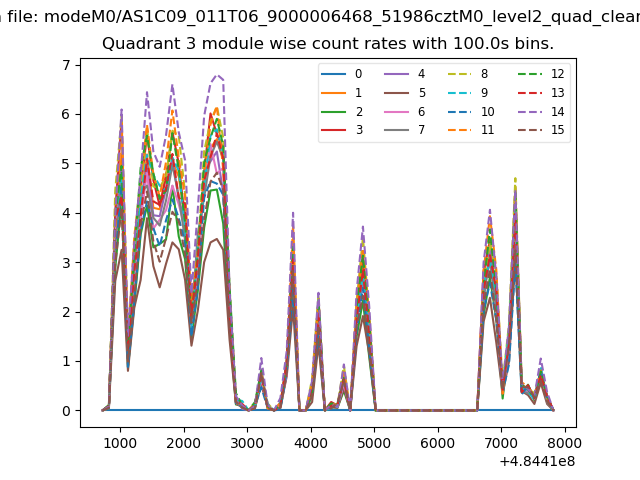
| Module-wise count rates for Quadrant C Data is divided into 100 sec bins |
 |
 |
| Module-wise count rates for Quadrant D Data is divided into 100 sec bins |
 |
 |
| Parameter | Plot |
|---|---|
| CZT HV Monitor | 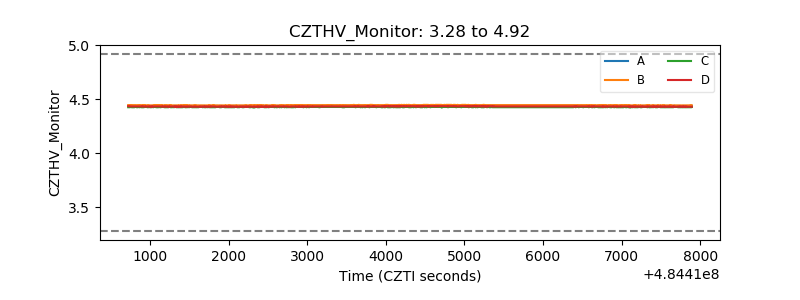 |
| D_VDD | 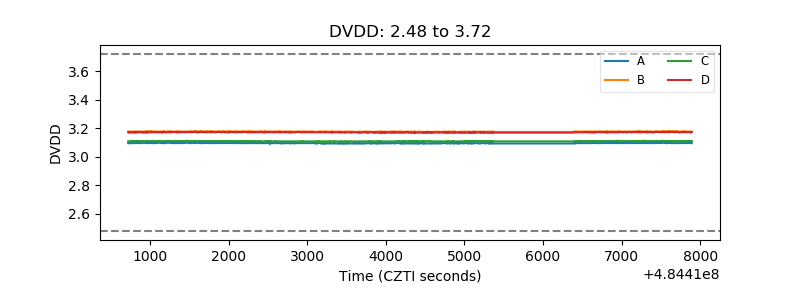 |
| Temperature 1 | 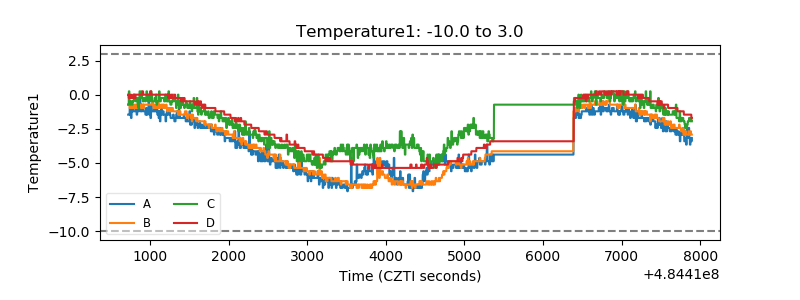 |
| Veto HV Monitor | 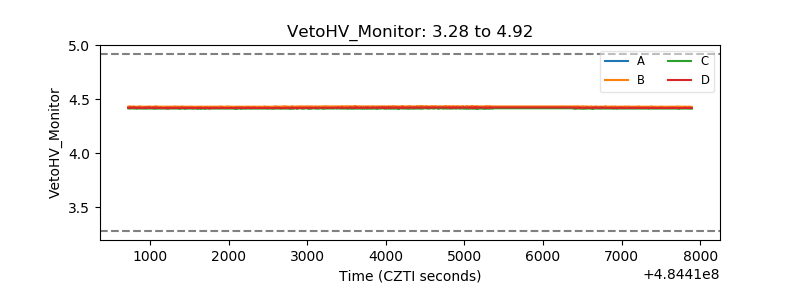 |
| Veto LLD | 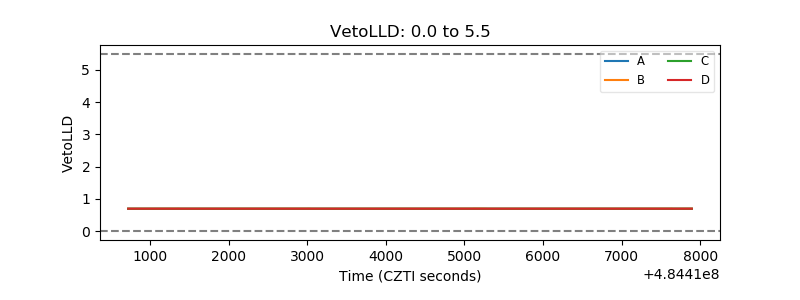 |
| Alpha Counter | 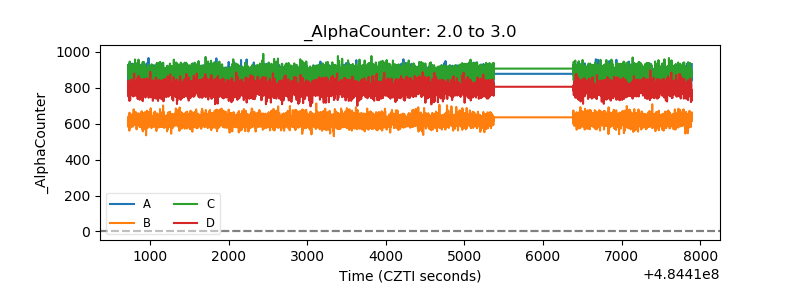 |
| _CPM_Rate | 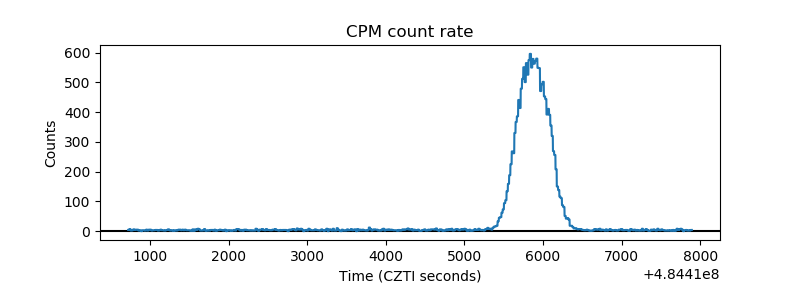 |
| CZT Counter | 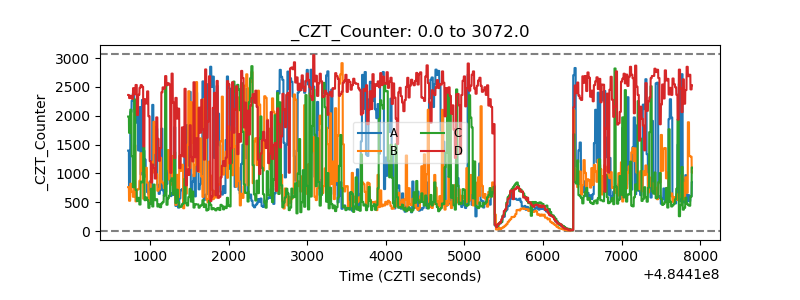 |
| +2.5 Volts monitor | 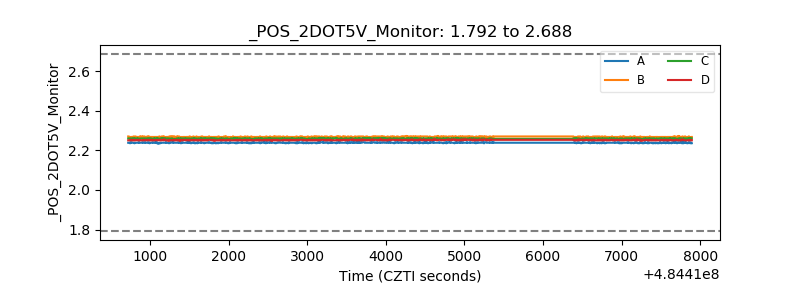 |
| +5 Volts monitor | 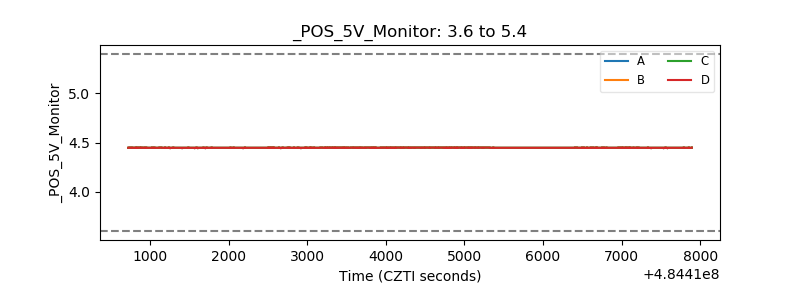 |
| _ROLL_ROT | 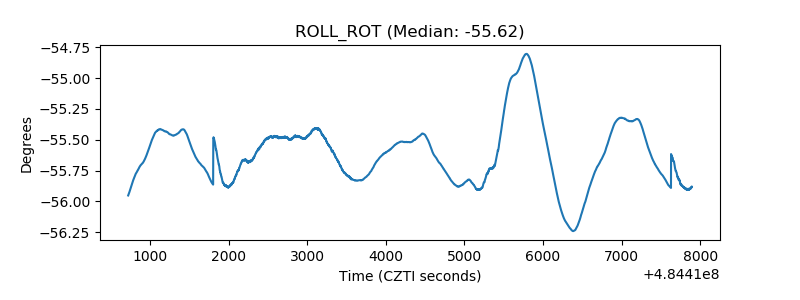 |
| _Roll_DEC | 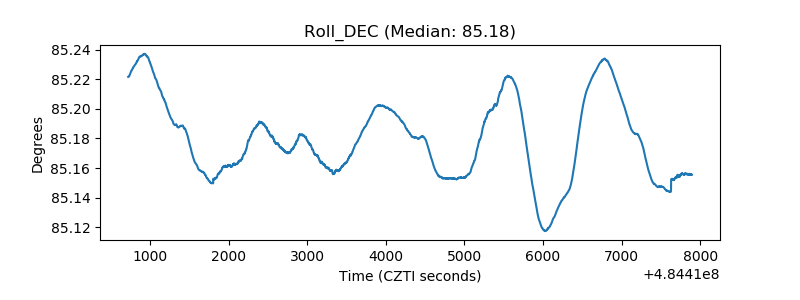 |
| _Roll_RA | 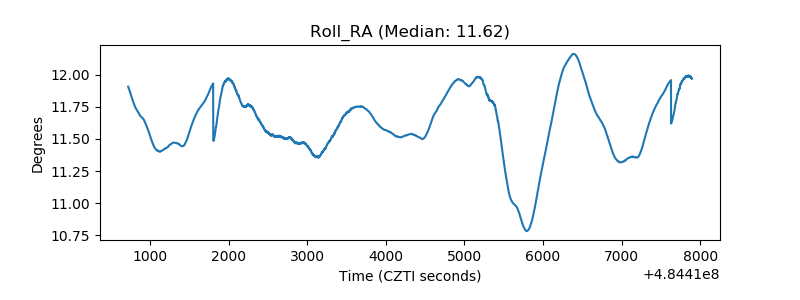 |
| Veto Counter | 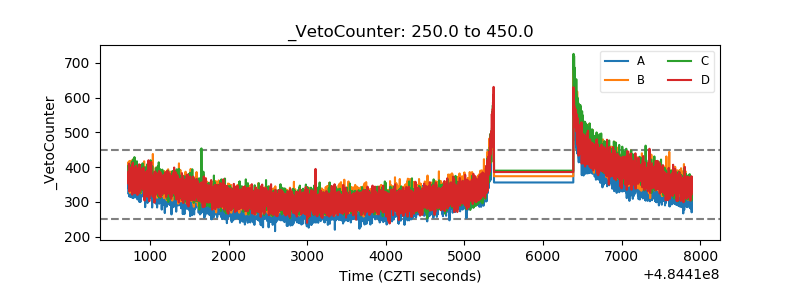 |